. 2023 Sep 26;23(1):214.
doi: 10.1186/s12935-023-03048-9.

Machine learning-derived identification of tumor-infiltrating immune cell-related signature for improving prognosis and immunotherapy responses in patients with skin cutaneous melanoma

Affiliations

Machine learning-derived identification of tumor-infiltrating immune cell-related signature for improving prognosis and immunotherapy responses in patients with skin cutaneous melanoma

Shaolong Leng et al. Cancer Cell Int. .

Abstract

Background: Immunoblockade therapy based on the PD-1 checkpoint has greatly improved the survival rate of patients with skin cutaneous melanoma (SKCM). However, existing anti-PD-1 therapeutic efficacy prediction markers often exhibit a poor situation of poor reliability in identifying potential beneficiary patients in clinical applications, and an ideal biomarker for precision medicine is urgently needed.

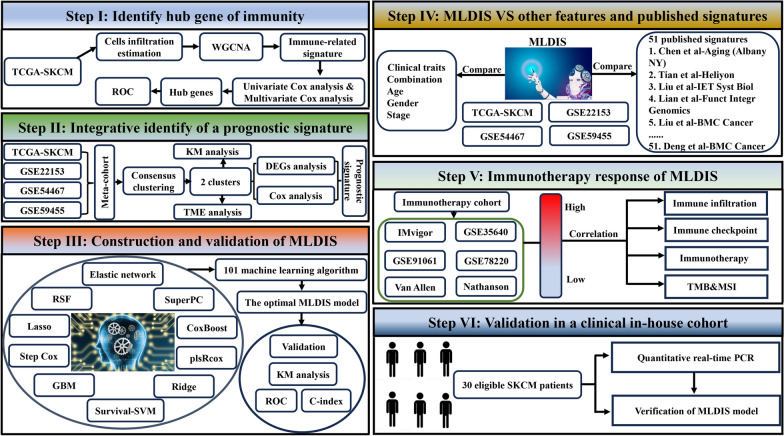
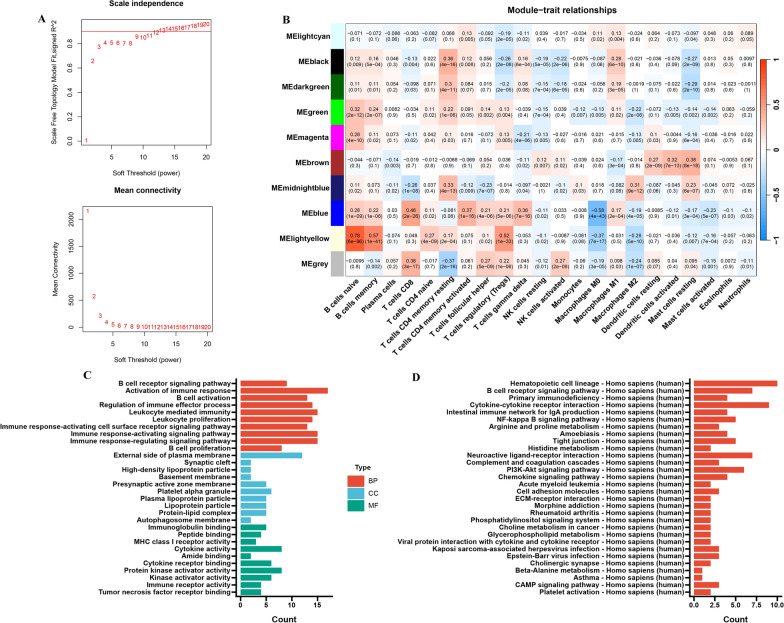
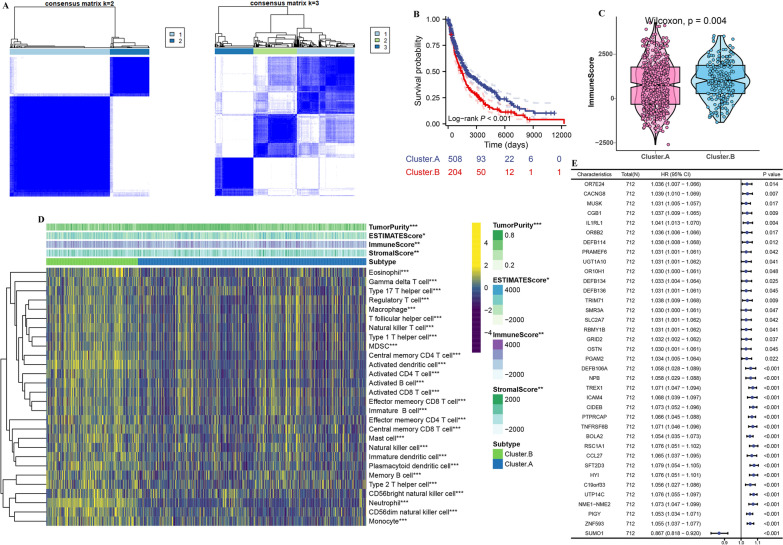
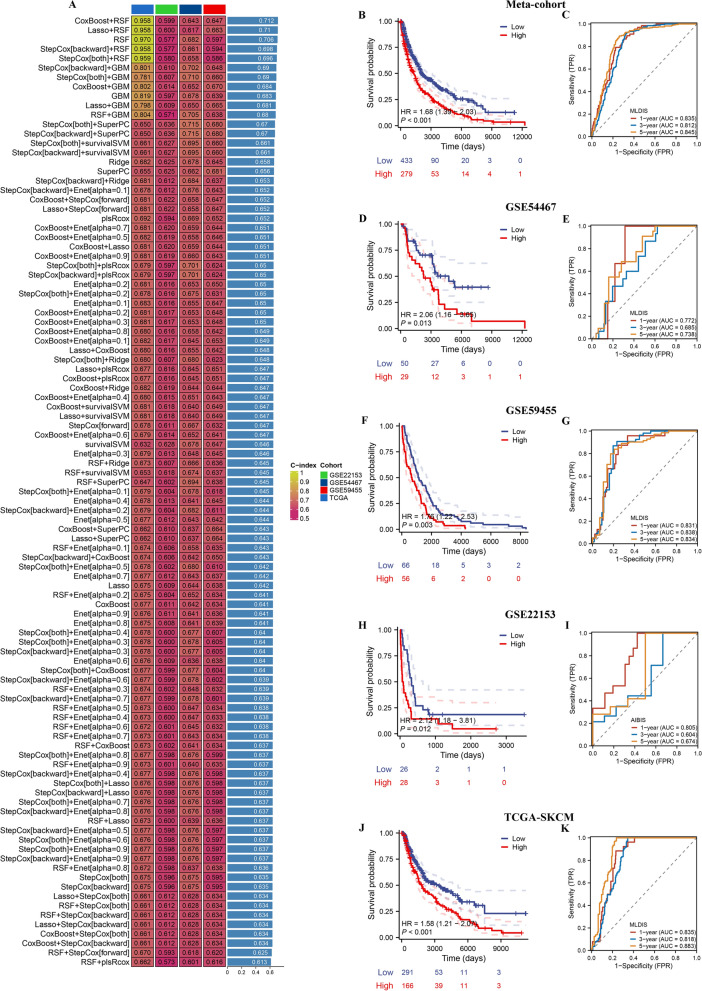
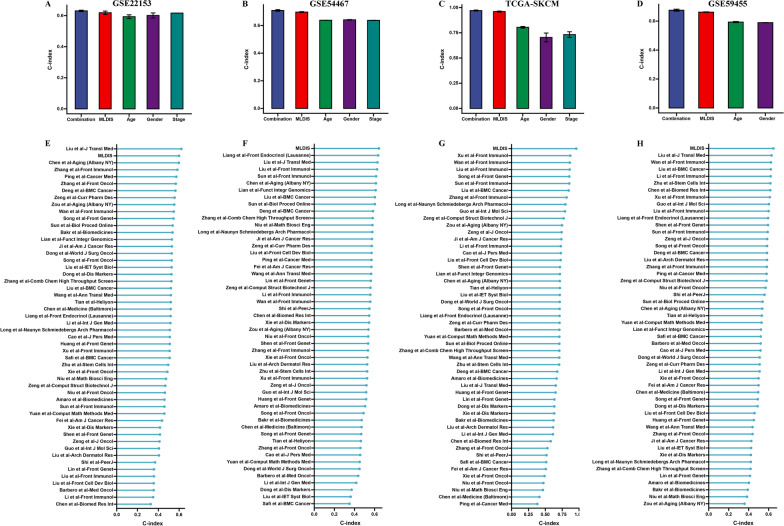
Methods: 10 multicenter cohorts including 4 SKCM cohorts and 6 immunotherapy cohorts were selected. Through the analysis of WGCNA, survival analysis, consensus clustering, we screened 36 prognostic genes. Then, ten machine learning algorithms were used to construct a machine learning-derived immune signature (MLDIS). Finally, the independent data sets (GSE22153, GSE54467, GSE59455, and in-house cohort) were used as the verification set, and the ROC index standard was used to evaluate the model.

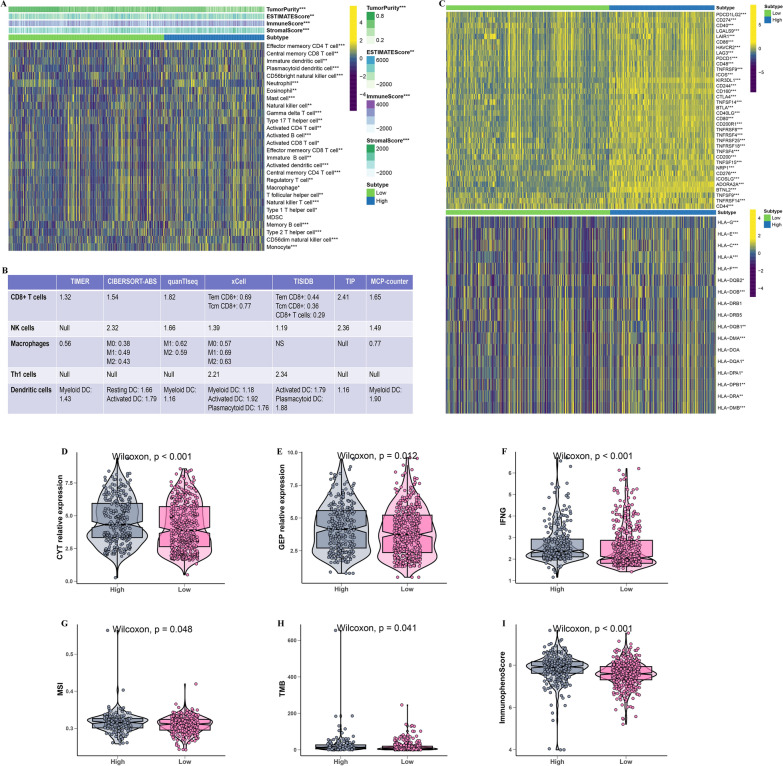
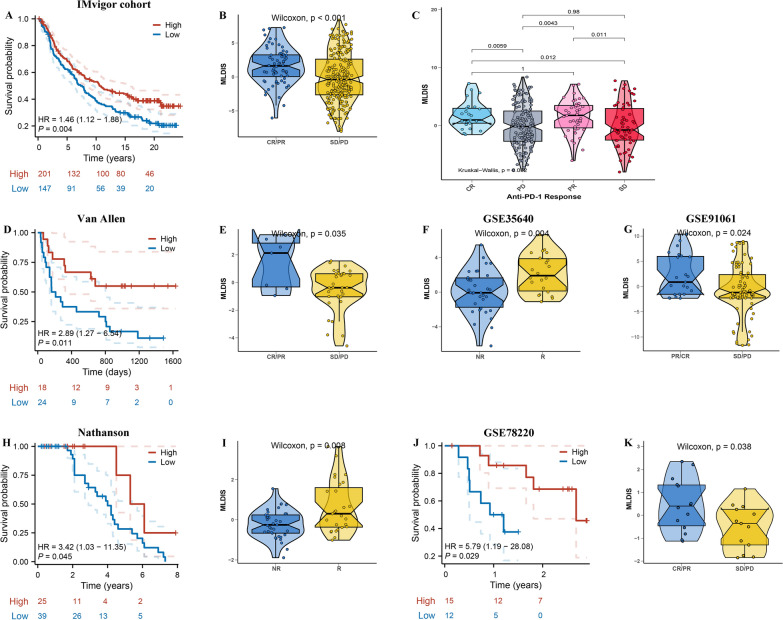
Results: Based on computing framework, we found that patients with high MLDIS had poor overall survival and has good prediction performance in all cohorts and in-house cohort. It is worth noting that MLDIS performs better in each data set than almost all models which from 51 prognostic signatures for SKCM. Meanwhile, high MLDIS have a positive prognostic impact on patients treated with anti-PD-1 immunotherapy by driving changes in the level of infiltration of immune cells in the tumor microenvironment. Additionally, patients suffering from SKCM with high MLDIS were more sensitive to immunotherapy.

Conclusions: Our study identified that MLDIS could provide new insights into the prognosis of SKCM and predict the immunotherapy response in patients with SKCM.

Keywords: Immunotherapy; Machine learning; Skin cutaneous melanoma; Tumor microenvironment.


Conflict of interest statement

The authors declare that they have no competing interests.

Figures

Fig. 1
Fig. 1
Flow chart of the study
Fig. 2
Fig. 2
Screening of key immune cell-related gene modules in TCGA-SKCM. A Analysis of network topology for different soft-threshold power. The top panel shows the impact of soft-threshold power on the scale-free topology fit index; the bottom panel displays the impact of soft-threshold power on the mean connectivity. B Correlation analysis between module eigengenes and immune cells. C GO enrichment analysis on the module genes. (D) KEGG enrichment analysis on the module genes
Fig. 3
Fig. 3
Identify hub genes in TCGA-SKCM. A Univariate Cox analysis and B multivariate Cox analysis identified 10 prognostic RNAs in the TCGA-SKCM cohort (n = 457). Kaplan–Meier curves of OS for the RASGRP2 (C), TXK (E), COL4A4 (G), ACHE (I), RBP5 (K), ANKRD29 (M), GHRL (O), CARNS1 (Q), ARMH1 (S), TNFRSF25 (U) in the TCGA-SKCM cohort (n = 457). Time-dependent ROC analysis for predicting OS at 1, 3, and 5 years for the RASGRP2 (D), TXK (F), COL4A4 (H), ACHE (J), RBP5 (L), ANKRD29 (N), GHRL (P), CARNS1 (R), ARMH1 (T), TNFRSF25 (V) in the TCGA-SKCM cohort (n = 457). Data are presented as hazard ratio (HR) ± 95% confidence interval [CI]
Fig. 4
Fig. 4
Development consensus clusters based on 10 hub genes in a meta-cohort. A The consensus score matrix of all samples when k = 2. A higher consensus score between two samples indicates they are more likely to be grouped into the same cluster in different iterations. B Kaplan–Meier curve showed a significant difference between the 2 clusters. C The distribution of immune score inferred by ESTIMATE algorithm between 2 clusters in the meta-cohort. D The distribution of 28 immune cell subsets infiltration between 2 clusters. E Univariate Cox analysis identified 37 prognostic RNAs in the meta-cohort (n = 712). The asterisks represented the statistical p-value (*P < 0.05; **P < 0.01; ***P < 0.001)
Fig. 5
Fig. 5
A MLDIS was developed and validated via the machine learning-based integrative procedure. A A total of 101 kinds of prediction models via LOOCV framework and further calculated the C-index of each model across all validation datasets. Kaplan–Meier curves of OS according to the MLDIS in meta-cohort (log-rank test: P < 0.001) (B), GSE54467 (log-rank test: P = 0.013) (D), GSE59455 (log-rank test: P = 0.003) (F), GSE22153 (log-rank test: P = 0.012) (H), and TCGA-SKCM (log-rank test: P < 0.001) (J). Time-dependent ROC analysis for predicting OS at 1, 3, and 5 years in meta-cohort (C), GSE54467 (E), GSE59455 (G), GSE22153 (I), and TCGA-SKCM (K)
Fig. 6
Fig. 6
Evaluation of the MLDIS model. The performance of MLDIS was compared with other clinical and molecular variables in predicting prognosis in GSE22153 (A), GSE54467 (B), TCGA-SKCM (C), and GSE59455 (D). C-index analysis MLDIS and 51 published signatures in GSE22153 (E), GSE54467 (F), TCGA-SKCM (G), and GSE59455 (H)
Fig. 7
Fig. 7
Immune landscape of MLDIS. A Heatmap displaying the correlation between the MLDIS and immune infiltrating cells. B Correlations between MLDIS and the infiltration levels of five tumor-associated immune cells (CD8 + T cells, NK cells, macrophages, Th1 cells, and dendritic cells). C Heatmap displaying the correlation between the MLDIS and immune modulator molecules. D Box plot displaying the CYT levels between high and low MLDIS groups. E Box plot displaying the GEP levels between high and low MLDIS groups. F Box plot displaying the IFN-γ levels between high and low MLDIS groups. G Box plot displaying MSI levels between high and low MLDIS groups. H Box plot displaying the TMB levels between high and low MLDIS groups. I Box plot displaying the IPS levels between high and low MLDIS groups. The asterisks represented the statistical p-value (*P < 0.05; **P < 0.01; ***P < 0.001)
Fig. 8
Fig. 8
Predictive value of the MLDIS in immunotherapy response. A Kaplan–Meier survival curve of OS between patients with a high MLDIS and a low MLDIS in the IMvigor dataset. B Box plot displaying the MLDIS in patients with different immunotherapy responses in the IMvigor dataset. C Differences in MLDIS among distinct anti-PD-1 clinical response groups. D Kaplan–Meier survival curve of OS between patients with a high MLDIS and a low MLDIS in the Van Allen dataset. E Box plot displaying the MLDIS in patients with different immunotherapy responses in the Van Allen dataset. F Box plot displaying the MLDIS in patients with different immunotherapy responses in the GSE35640 dataset. G Box plot displaying the MLDIS in patients with different immunotherapy responses in the GSE91061 dataset. H Kaplan–Meier survival curve of OS between patients with a high MLDIS and a low MLDIS in the Nathanson dataset. I Box plot displaying the MLDIS in patients with different immunotherapy responses in the Nathanson dataset. J Kaplan–Meier survival curve of OS between patients with a high MLDIS and a low MLDIS in the GSE78220 dataset. (K) Box plot displaying the MLDIS in patients with different immunotherapy responses in the GSE78220 dataset
Fig. 9
Fig. 9
Validation in a clinical in-house cohort. A Kaplan–Meier survival curve of OS between patients with a high MLDIS and a low MLDIS in the in-house dataset. B Time-dependent ROC analysis for predicting OS at 1, 3, and 5 years in the in-house dataset. C The performance of MLDIS was compared with other clinical and molecular variables in predicting prognosis in the in-house dataset. D Univariate Cox analysis of OS in the in-house dataset (n = 30). E Scatter plot displaying the correlation between the MLDIS and CD8, PD-1, and PD-L1 in the in-house dataset. F Box plot displaying the IHC score levels of CD8, PD-1, and PD-L1 based on IHC staining between two MLDIS groups in the MLDIS in-house dataset. G Representative IHC staining images of CD8, PD-1, and PD-L1 in two MLDIS groups in the in-house dataset

Similar articles

Cited by

References

    1. Siegel RL, Miller KD, Wagle NS, Jemal A. Cancer statistics, 2023. CA Cancer J Clin. 2023;73(1):17–48. doi: 10.3322/caac.21763. - DOI - PubMed
    1. Perez M, Abisaad JA, Rojas KD, Marchetti MA, Jaimes N. Skin cancer: primary, secondary, and tertiary prevention. Part I. J Am Acad Dermatol. 2022;87(2):255–268. doi: 10.1016/j.jaad.2021.12.066. - DOI - PubMed
    1. Carlino MS, Larkin J, Long GV. Immune checkpoint inhibitors in melanoma. Lancet (London, England) 2021;398(10304):1002–1014. doi: 10.1016/S0140-6736(21)01206-X. - DOI - PubMed
    1. Garbe C, Amaral T, Peris K, Hauschild A, Arenberger P, Basset-Seguin N, Bastholt L, Bataille V, Del Marmol V, Dréno B, et al. European consensus-based interdisciplinary guideline for melanoma. Part 2: treatment—update 2022. Eur J Cancer (Oxford, England: 1990) 2022;170:256–284. doi: 10.1016/j.ejca.2022.04.018. - DOI - PubMed
    1. Bagchi S, Yuan R, Engleman EG. Immune checkpoint inhibitors for the treatment of cancer: clinical impact and mechanisms of response and resistance. Annu Rev Pathol. 2021;16:223–249. doi: 10.1146/annurev-pathol-042020-042741. - DOI - PubMed

LinkOut - more resources