. 2023 Sep 26;15(1):89.
doi: 10.1186/s13321-023-00761-5.

A molecule perturbation software library and its application to study the effects of molecular design constraints

Affiliations

A molecule perturbation software library and its application to study the effects of molecular design constraints

Alan Kerstjens et al. J Cheminform. .

Abstract

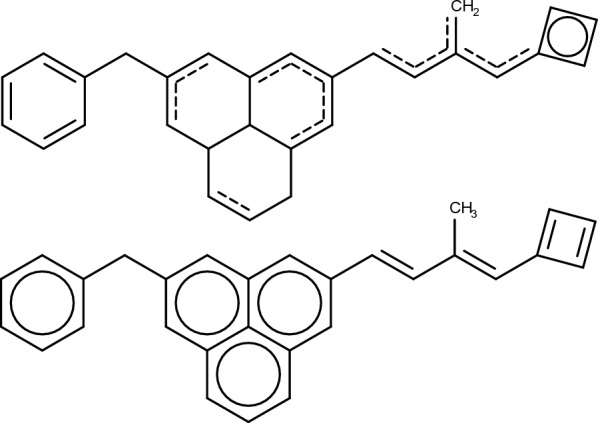
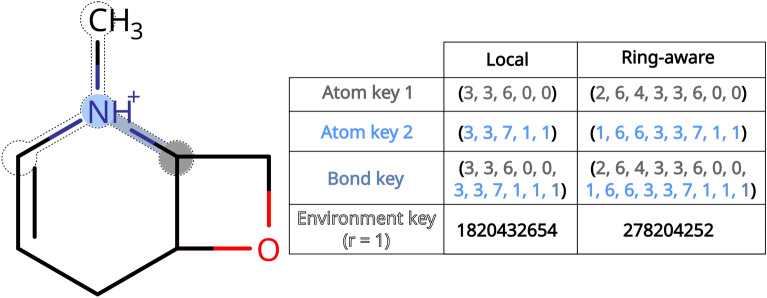
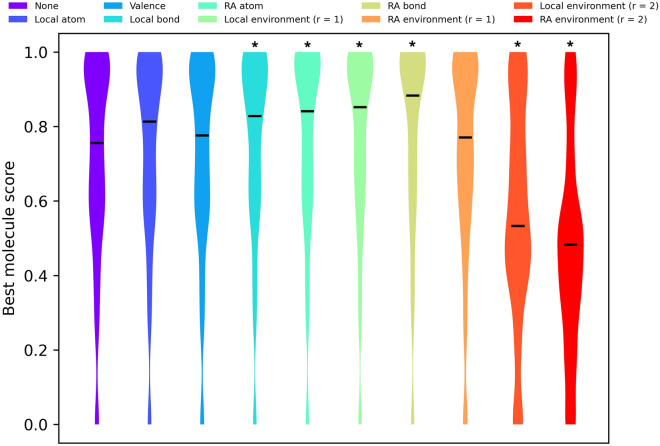
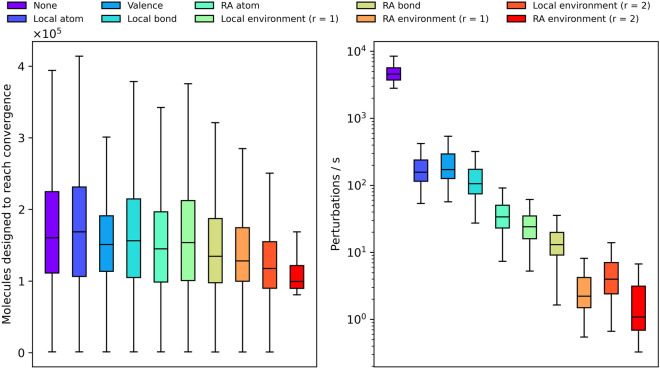
Computational molecular design can yield chemically unreasonable compounds when performed carelessly. A popular strategy to mitigate this risk is mimicking reference chemistry. This is commonly achieved by restricting the way in which molecules are constructed or modified. While it is well established that such an approach helps in designing chemically appealing molecules, concerns about these restrictions impacting chemical space exploration negatively linger. In this work we present a software library for constrained graph-based molecule manipulation and showcase its functionality by developing a molecule generator. Said generator designs molecules mimicking reference chemical features of differing granularity. We find that restricting molecular construction lightly, beyond the usual positive effects on drug-likeness and synthesizability of designed molecules, provides guidance to optimization algorithms navigating chemical space. Nonetheless, restricting molecular construction excessively can indeed hinder effective chemical space exploration.

Keywords: Chemical space; Constraints; De novo molecule generation; Molecular design; Molecular fingerprints; RDKit; Software library; Topological perturbations.


Conflict of interest statement

The authors declare that they have no competing interests.

Figures

Fig. 1
Fig. 1
A section of graph-like chemical space with an excluded area (center). The exclusion stems from molecular construction constraints and corresponds to a maximum on an undesirability objective landscape (red)
Fig. 2
Fig. 2
Examples of transition graphs of different population and density. The shortest path between two vertices A and B is highlighted in orange. Note that the path is shorter if the graph’s population is lower or the density is higher. As the population and density decrease the probability of two vertices being connected decreases
Fig. 3
Fig. 3
Examples of topological perturbations. Input and output molecules are depicted on the top and bottom respectively. Deleted atoms and bonds are highlighted in red while inserted atoms and bonds are highlighted in blue. In the atom insertion example N = {1, 2, 3} and p = {1}. In the atom deletion example N = {2, 3, 4, 5} and r = {2}
Fig. 4
Fig. 4
Aromaticity sanitization example. Aromatic bonds are depicted as dashed bonds. Aromatic ring systems where all bonds are aromatic are depicted with internal circles. Partially aromatic ring systems are either aromatized or kekulized depending on their “degree of aromaticity”. Bonds incorrectly labelled as aromatic are kekulized
Fig. 5
Fig. 5
Example molecular keys. The color highlighted atoms are characterized with atom keys, and the color highlighted bond between them characterized with a bond key. The nitrogen’s circular atomic environment of radius 1 is shown as a dotted outline and characterized with the hash of its bonds’ keys, resulting in seemingly random numbers. For the meaning of each integer see Table 1
Fig. 6
Fig. 6
A Average number of neighboring molecules for molecules in ChEMBL based on their size and molecular constraints. The lower the number of neighbors the sparser the chemical transition graph. B Fraction of accepted perturbations broken down by perturbation type. The remainder of the perturbations were rejected by the molecular constraints
Fig. 7
Fig. 7
SAScore distributions of RDM using different types of constraints. Medians are shown as black lines. Lower SAScores are indicative of an easier synthesis. Stars on top of the distributions indicate statistically significant differences with the “no constraints” control group. A more detailed statistical analysis can be found in Additional file 1: Table S2
Fig. 8
Fig. 8
Examples of molecules designed by successive random atom and bond insertions using different types of constraints
Fig. 9
Fig. 9
QED distributions of RDM using different types of constraints. Medians are shown as black lines. Higher values are indicative of more drug-like molecules. Stars on top of the distributions indicate statistically significant differences with the “no constraints” control group. A more detailed statistical analysis can be found in Additional file 1: Table S3
Fig. 10
Fig. 10
Positions of RDM in 2D PCA space. The grayscale grid represents the density of ChEMBL molecules in chemical space on a linear scale, with darker cells being more densely populated
Fig. 11
Fig. 11
Distributions of top molecule scores, as assessed by the GuacaMol goal-directed scoring functions. Medians are shown as black lines. Only the best molecule of each population is included. The benchmark suite consists of 20 individual benchmarks, but for clarity’s sake the results of all benchmarks were aggregated. A per-benchmark breakdown can be found in Additional file 1: Figure S1. Stars on top of the distributions indicate statistically significant differences with the “no constraints” control group. A more detailed statistical analysis can be found in Additional file 1: Table S5
Fig. 12
Fig. 12
Celecoxib (A), troglitazone (C) and examples of molecules designed during their rediscovery benchmark using local bond constraints. The designed molecules (B) and (D) score relatively high (0.62 and 0.69 respectively) due to the presence of common chemical features albeit in different positions. Note that the 10-membered cycles in (B) and (D) are deemed aromatic by Hückel’s rule [48] and the RDKit, despite not being aromatic due to ring strain [49]
Fig. 13
Fig. 13
Number of molecules designed to reach convergence (left) and the number of perturbations executed per second (right) stratified per constraint type. Performance numbers are for a single-threaded workload on an AMD Epyc 7452 CPU clocked at 2.35 GHz

Similar articles

Cited by

References

    1. Schneider G, Fechner U. Computer-based de novo design of drug-like molecules. Nat Rev Drug Discov. 2005;4:649–663. doi: 10.1038/nrd1799. - DOI - PubMed
    1. Meyers J, Fabian B, Brown N. De novo molecular design and generative models. Drug Discov Today. 2021;26:2707–2715. doi: 10.1016/j.drudis.2021.05.019. - DOI - PubMed
    1. Virshup AM, Contreras-García J, Wipf P, et al. Stochastic voyages into uncharted chemical space produce a representative library of all possible drug-like compounds. J Am Chem Soc. 2013;135:7296–7303. doi: 10.1021/ja401184g. - DOI - PMC - PubMed
    1. Yuan W, Jiang D, Nambiar DK, et al. Chemical Space Mimicry for Drug Discovery. J Chem Inf Model. 2017;57:875–882. doi: 10.1021/acs.jcim.6b00754. - DOI - PMC - PubMed
    1. Oprea TI, Gottfries J. Chemography: The art of navigating in chemical space. J Comb Chem. 2001;3:157–166. doi: 10.1021/cc0000388. - DOI - PubMed

LinkOut - more resources