. 2024 Mar;30(3):e14445.
doi: 10.1111/cns.14445. Epub 2023 Sep 26.

Effects of tail nerve electrical stimulation on the activation and plasticity of the lumbar locomotor circuits and the prevention of skeletal muscle atrophy after spinal cord transection in rats

Affiliations

Effects of tail nerve electrical stimulation on the activation and plasticity of the lumbar locomotor circuits and the prevention of skeletal muscle atrophy after spinal cord transection in rats

Jia-Lin Liu et al. CNS Neurosci Ther. 2024 Mar.

Abstract

Introduction: Severe spinal cord injury results in the loss of neurons in the relatively intact spinal cord below the injury area and skeletal muscle atrophy in the paralyzed limbs. These pathological processes are significant obstacles for motor function reconstruction.

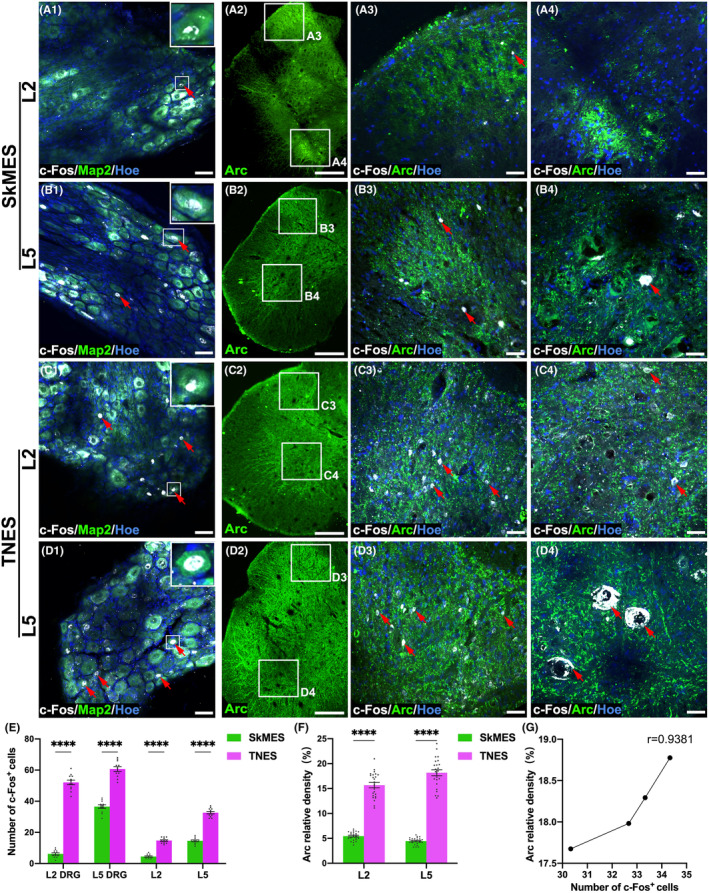
Objective: We performed tail nerve electrical stimulation (TNES) to activate the motor neural circuits below the injury site of the spinal cord to elucidate the regulatory mechanisms of the excitatory afferent neurons in promoting the reconstruction of locomotor function.

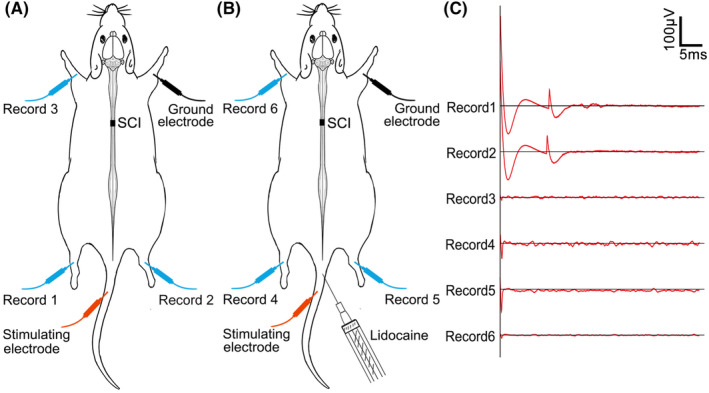
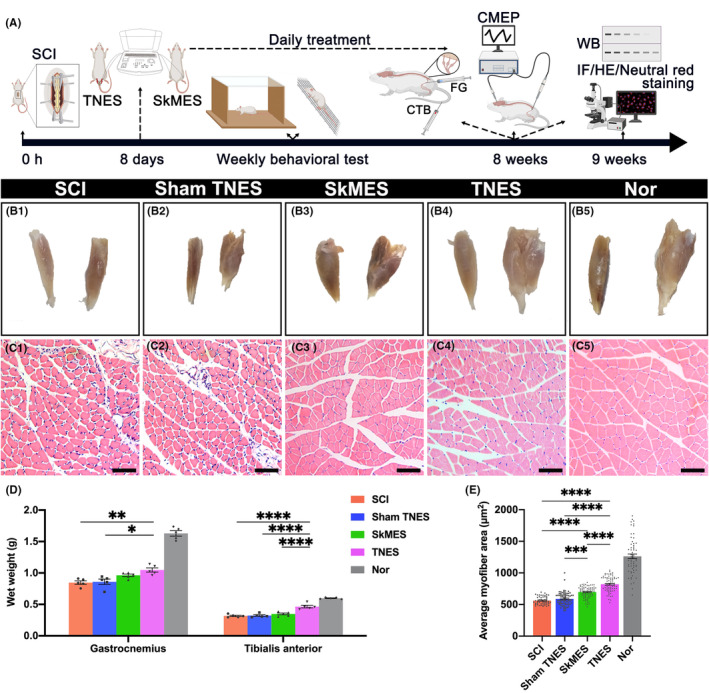
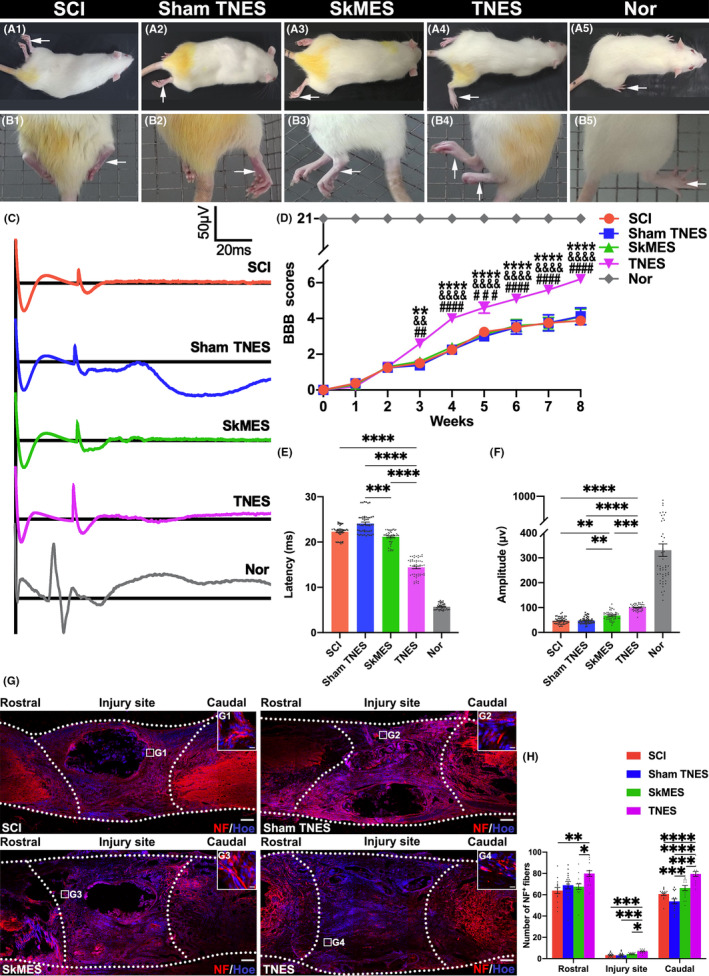
Methods: Eight days after T10 spinal cord transection in rats, TNES was performed for 7 weeks. Behavioral scores were assessed weekly. Electrophysiological tests and double retrograde tracings were performed at week 8.

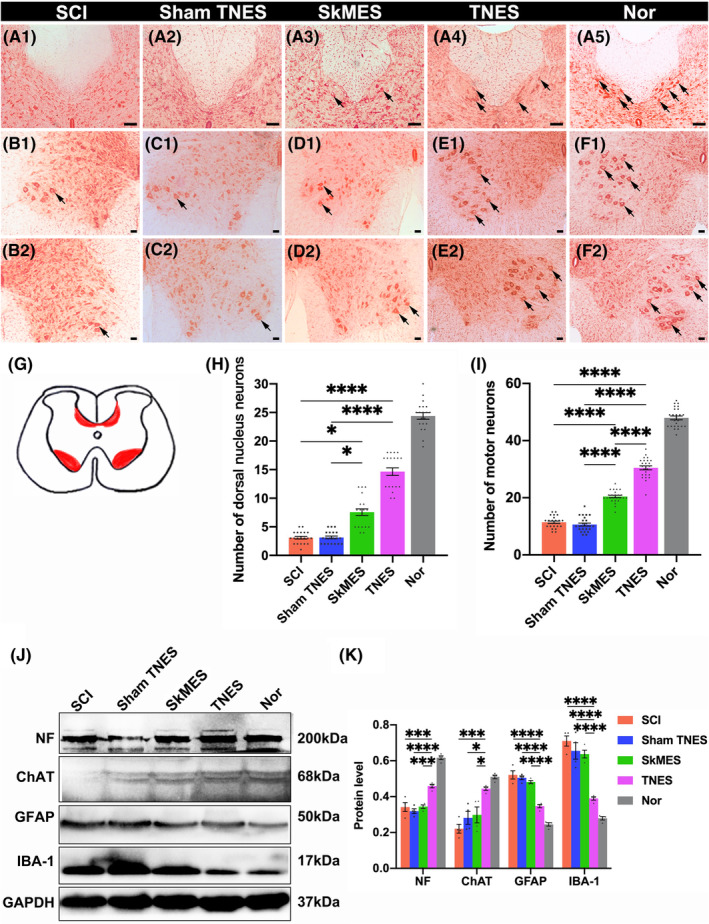
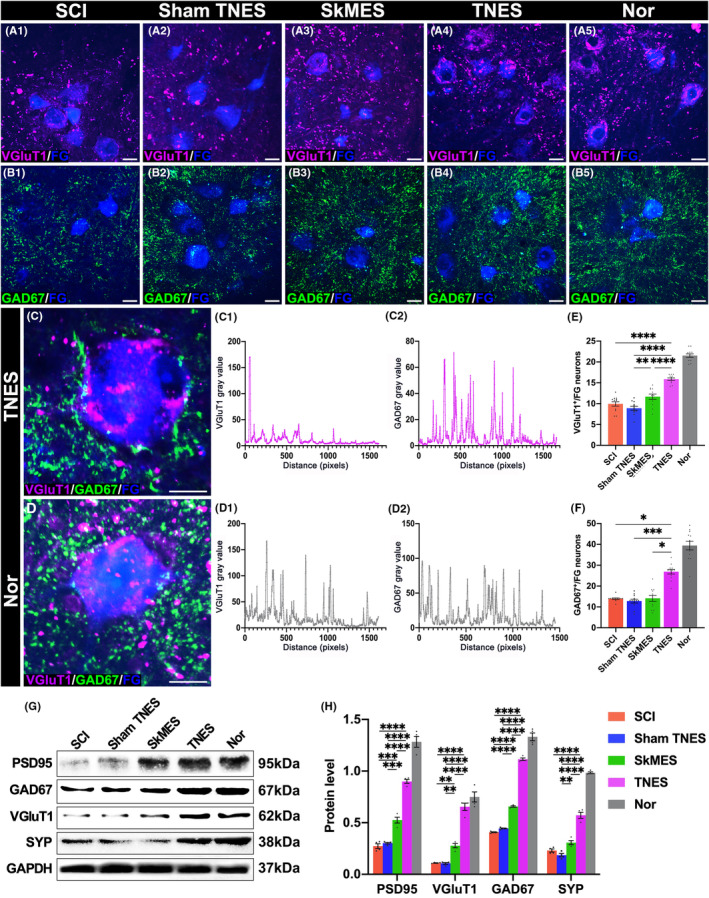
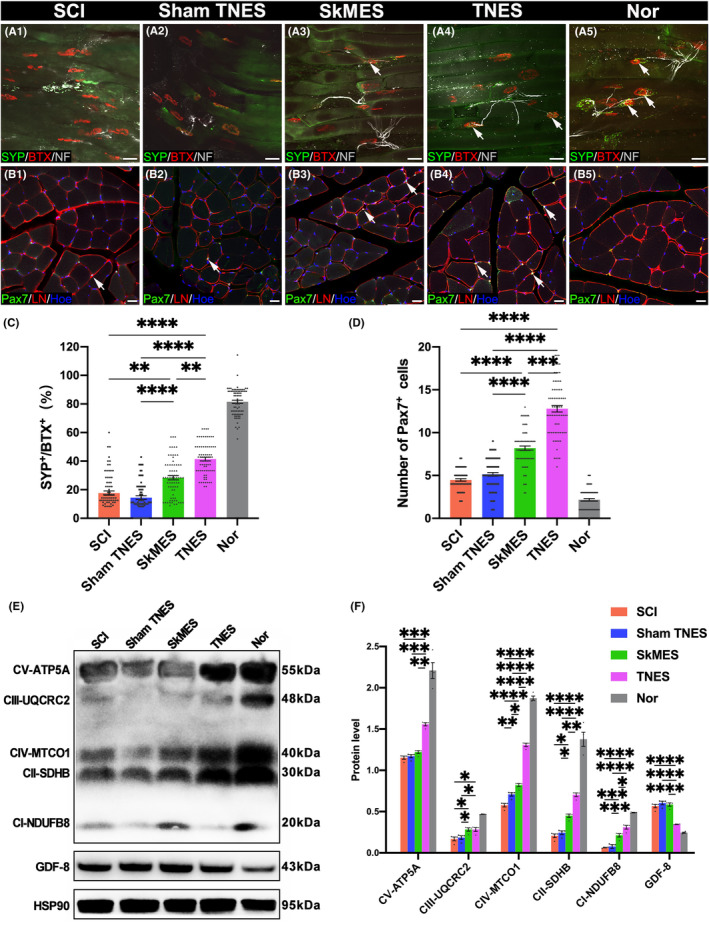
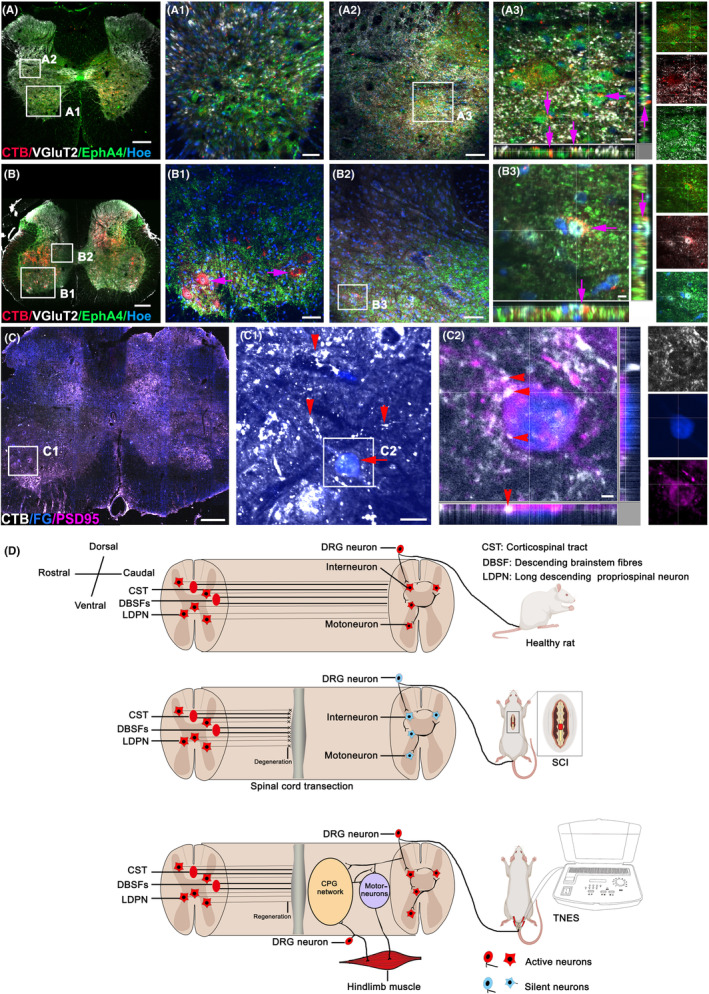
Results: After 7 weeks of TNES treatment, there was restoration in innervation, the number of stem cells, and mitochondrial metabolism in the rats' hindlimb muscles. Double retrograde tracings of the tail nerve and sciatic nerve further confirmed the presence of synaptic connections between the tail nerve and central pattern generator (CPG) neurons in the lumbar spinal cord, as well as motor neurons innervating the hindlimb muscles.

Conclusion: The mechanisms of TNES induced by the stimulation of primary afferent nerve fibers involves efficient activation of the motor neural circuits in the lumbosacral segment, alterations of synaptic plasticity, and the improvement of muscle and nerve regeneration, which provides the structural and functional foundation for the future use of cutting-edge biological treatment strategies to restore voluntary movement of paralyzed hindlimbs.

Keywords: motor neural circuit activation; muscle atrophy; regeneration; spinal cord transection; tail nerve electrical stimulation.


Conflict of interest statement

The authors declare that they have no conflict of interest. Animals were used with the approval of the ethics committee of Sun Yat‐sen University (Animal Use Protocol no. SYSU‐IACUC‐2019‐B1101).

Figures

FIGURE 1
FIGURE 1
The neural pathway associated with tail nerve electrical stimulation (TNES). (A) EMGs could be recorded in the tibialis anterior muscles of both hindlimbs (record 1 and record 2) but no signals were recorded in the forelimbs (record 3) during TNES treatment. (B) When lidocaine was injected at multiple points around the tail root, EMGs could not be recorded in the tibialis anterior muscles of both hindlimbs (record 4 and record 5) or in the forelimbs (record 6) during TNES treatment.
FIGURE 2
FIGURE 2
Tail nerve electrical stimulation (TNES) alleviated muscle atrophy in the hindlimbs. (A) Experimental paradigms illustrating the timelines of the major experimental manipulations. (B) The appearance of the tibialis anterior muscle (left) and the gastrocnemius muscle (right) in each group. TNES significantly alleviated atrophy in the tibialis anterior muscle and gastrocnemius muscle. (C) HE staining in transverse sections from the tibialis anterior muscle in each group. (D) Bar chart showing the wet weights of the gastrocnemius and tibialis anterior muscles (n = 5. Data are shown as mean ± SEM. One‐way anova followed by Bonferroni post‐hoc test was used, *p < 0.05, **p < 0.01, ****p < 0.0001). (E) Bar chart showing the mean myofiber areas (n = 5). Data are shown as mean ± SEM. One‐way anova followed by Bonferroni post‐hoc test was used, ***p < 0.001, ****p < 0.0001). Scale bar = 20 μm in (C1–C5).
FIGURE 3
FIGURE 3
Tail nerve electrical stimulation (TNES) promoted the survival of spinal cord neurons. (A) Neutral red staining showing neurons in the L1 dorsal nucleus (arrows in A1–A5). The number of neurons in the L1 dorsal nucleus in the TNES group was higher than that in the SCI, sham TNES, and SkMES groups. (B–F) Neutral red staining showing motoneurons in the anterolateral horn of the L4 segment (arrows). The number of motoneurons in the TNES group (E1, E2) was higher than that in the SCI (B1, B2); sham TNES (C1, C2); and SkMES groups (D1, D2). (G) Sections of the spinal cord showing neurons in the dorsal nucleus and the anterolateral horn motoneurons. (H) Bar chart showing the number of neurons in the L1 dorsal nucleus (n = 5. Data are shown as mean ± SEM. Kruskal–Wallis test was used, *p < 0.05, ****p < 0.0001). (I) Bar chart showing the number of motoneurons in the anterolateral horn of the L4 segment (n = 5. Data are shown as mean ± SEM. One‐way anova followed by Bonferroni post‐hoc test was used, ****p < 0.0001). (J) Western blotting for NF, ChAT, GFAP, IBA‐1, and glyceraldehyde 3‐phosphate dehydrogenase (GAPDH) in the L1‐S2 segments of the spinal cord. The levels of NF and ChAT were higher and the levels of GFAP and IBA‐1 were lower in the TNES group than the SCI, sham TNES, and SkMES groups. (K) Bar chart showing the quantification of protein expression based on western blotting (n = 4. Data are shown as mean ± SEM. One‐way anova followed by Bonferroni post‐hoc test was used, *p < 0.05, ***p < 0.001, ****p < 0.0001). Scale bar = 100 μm in (A1–A5), 50 μm in (B1–F1, B2–F2).
FIGURE 4
FIGURE 4
Tail nerve electrical stimulation (TNES) increased activation of the neural circuits in the lumbar spinal cord. In the SkMES group, the co‐expression of c‐Fos+ and microtubule‐associated protein 2 (Map2)+ is shown in the L2 (A1) and L5 (B1) DRG neurons (arrows). Inserts in the upper right corner of the images are the magnification of the area shown in the box; Arc+ neurons in the L2 (A2) and L5 (B2) segments is shown; the co‐expression of c‐Fos+ and Arc+ in the L2 (A3) and L5 (B3) dorsal horn neurons (arrows) is shown; the co‐expression of c‐Fos+ and Arc+ in the L2 (A4) and L5 (B4) ventral horn neurons is shown (arrows). In the TNES group, the co‐expression of c‐Fos+ and Map2+ in the L2 (C1) and L5 (D1) DRG neurons is shown (arrows). Inserts in the upper right corner of the images are the magnification of the area shown in the box; Arc+ neurons in the L2 (C2) and L5 (D2) segment is shown; the co‐expression of c‐Fos+ and Arc+ in the L2 (C3) and L5 (D3) dorsal horn neurons is shown (arrows); the co‐expression of c‐Fos+ and Arc+ in the L2 (C4) and L5 (D4) ventral horn neurons is shown (arrows). (E) Bar chart showing the number of c‐Fos+ neurons in the DRG, L2, and L5 spinal cord (n = 4. Data are shown as mean ± SEM. Unpaired t test was used, ****p < 0.0001). (F) Bar chart showing the relative density of Arc+ neurons in the L2 and L5 spinal cord (n = 4. Data are shown as mean ± SEM. Unpaired t test was used, ****p < 0.0001). (G) Line chart showing the linear relationship between the relative density of Arc+ and the number of c‐Fos+ neurons of L5 in the TNES group (r = 0.9381). Scale bar = 50 μm in (A1–D1), 200 μm in (A2–D2), and 50 μm in (A3–D3, A4–D4).
FIGURE 5
FIGURE 5
Tail nerve electrical stimulation (TNES) increased the number of presynaptic terminals on the surface of motoneurons. (A) VGluT1+ presynaptic terminals on the surface of FG+ motoneurons in each group. (B) GAD67+ presynaptic terminals on the surface of FG+ motoneurons in each group. (C) The co‐expression of VGluT1+ and GAD67+ presynaptic terminals in the TNES group. The chart shows gray value changes of VGluT1+ (C1) and GAD67+ (C2) presynaptic terminals on the surface of FG+ motoneurons in the TNES group. (D) The co‐expression of VGluT1+ and GAD67+ presynaptic terminals in the Nor group. The chart shows gray value changes of VGluT1+ (D1) and GAD67+ (D2) presynaptic terminals on the surface of FG+ motoneurons in the Nor group. Bar chart showing the gray value of presynaptic VGluT1+ (E) and GAD67+ (F) terminals on the surface of FG+ neurons in each group (n = 4. Data are shown as mean ± SEM. One‐way anova followed by Bonferroni post‐hoc test was used in (E), and Kruskal–Wallis test was used in (F), *p < 0.05, **p < 0.01, ***p < 0.001, ****p < 0.0001). (G) Western blotting in the L1‐S2 segments of the spinal cord. The levels of PSD95, GAD67, VGluT1, and SYP were higher in the TNES group than in the SCI, sham TNES, and SkMES groups. (H) Bar chart showing quantification of the protein expression based on western blots (n = 4. Data are shown as mean ± SEM. One‐way anova followed by Bonferroni's post‐hoc test was used, **p < 0.01, ***p < 0.001, ****p < 0.0001). Scale bar = 30 μm in (A1–A5, B1–B5), 20 μm in (C, D).
FIGURE 6
FIGURE 6
Tail nerve electrical stimulation (TNES) improved muscle innervation and regeneration. (A1–A5) BTX+ motor endplates with SYP+/NF+ nerve fibers in each group. (B1–B5) Representative images showing Pax7+ cells and LN in the extracellular matrix located between the tibialis anterior muscle. (C) Bar chart showing the ratio of SYP and BTX double‐positive motor endplates to the total BTX+ motor endplates (n = 5. Data are shown as mean ± SEM. Kruskal–Wallis test was used, **p < 0.01, ****p < 0.0001). (D) Bar chart showing the number of Pax7+ cells (n = 5. Data are shown as mean ± SEM. Kruskal–Wallis test was used, ***p < 0.001, ****p < 0.0001). (E) Western blot showing mitochondrial respiratory chain complex proteins and GAPDH in the gastrocnemius muscles. Compared with the SCI, sham TNES, and SkMES groups, the levels of mitochondrial respiratory chain complex proteins were increased in the TNES group; however, the levels of GDF‐8 were reduced in the TNES group. (F) Bar chart showing the quantification of protein expression based on western blots (n = 4. Data are shown as mean ± SEM. One‐way anova followed by Bonferroni post‐hoc test was used, *p < 0.05, **p < 0.01, ***p < 0.001, ****p < 0.0001). Scale bar = 50 μm in (A1–A5), 20 μm in (B1–B5).
FIGURE 7
FIGURE 7
Tail nerve electrical stimulation (TNES) improved hindlimb movement, electrophysiological function, and nerve regeneration. (A1–A5) BBB assessment was performed in each group. (B1–B5) The grid climbing test was performed. (C) CMEPs were obtained by electrophysiological analysis. (D) Comparison of BBB scores for hindlimb locomotor function (n = 8 in SCI, sham TNES, and Nor group; n = 10 in the SkMES and TNES groups; #, &, * indicate statistical significance compared with the SCI, sham TNES, and SkMES groups, respectively) ## p < 0.01; && p < 0.01; **p < 0.01; ### p < 0.001; #### p < 0.0001; &&&& p < 0.0001; ****p < 0.0001. (E) Bar charts of CMEPs latency showing a shorter latency in the TNES group than the SCI, sham TNES, and SkMES groups (n = 5. Data are shown as mean ± SEM. Kruskal–Wallis test was used, ***p < 0.001, ****p < 0.0001). (F) Bar charts of CMEPs amplitude, showing higher amplitudes in the TNES group than the SCI and sham TNES groups (n = 5. Data are shown as mean ± SEM. Kruskal–Wallis test was used, **p < 0.01, ****p < 0.0001). (G) NF+ nerve fibers at the site of SCI and its rostral and caudal sites. (G1–G4) The pictures are the magnification of the area indicated in the box area of (G). The dotted lines delineate the contours of longitudinal sectioning of the spinal cord and the scope of the injury area corresponding to the injury length of 2 mm. (H) Bar chart showing the number of NF+ nerve fibers in the regions rostral and caudal to/in the injury site (n = 5). Data are shown as mean ± SEM. Kruskal–Wallis test was used in the rostral regions and injury site and one‐way anova followed by Bonferroni's post‐hoc test was used in the caudal regions, *p < 0.05, **p < 0.01, ***p < 0.001, ****p < 0.0001). Scale bar = 200 μm in (G), 10 μm in (G1‐G4).
FIGURE 8
FIGURE 8
Retrograde nerve tracing demonstrated the specific neural pathway of tail nerve electrical stimulation (TNES). (A) Representative images showing CTB+ afferent nerve fibers in the L2 segment of the TNES group. (A1) Magnified image in the boxed area of (A) showing CTB+ afferent nerve fibers in the L2 ventral horn. (A2) Magnified image in the boxed area of (A) showing CTB+ afferent nerve fibers contacting VgluT2+/EPHA4+ CPG neurons in the middle lamellae of the L2 gray matter (arrows in A3). (A3) Magnified image in the boxed area of (A2). (B) Representative images showing CTB+ afferent nerve fibers and neurons in the L5 segment of the TNES group. (B1) Magnified image in the boxed area of (B) showing CTB+ afferent nerve fibers and motoneurons in the L5 ventral horn. (B2) Magnified image in the boxed area of (B) showing CTB+ afferent nerve fibers contacting VgluT2+/EPHA4+ CPG neurons in the middle lamellae of the L5 gray matter (arrows in B3). (B3) Magnified image in the boxed area of (B2). (C) Representative images showing FG+ motoneurons and CTB+ nerve fibers and neurons in the L5 segment of the TNES group. (C1) Magnified image in the boxed area of (C) showing that CTB+ nerve fibers (arrowheads) and FG+ motoneuron cell bodies (arrow) formed abundant close contacts with the CTB+ presynaptic terminals in the L5 ventral horn. (C2) Magnified image in the boxed area of (C1) showing the co‐expression of FG+ motoneurons, CTB+ presynaptic terminals and PSD95 protein (arrowheads). (D) A schematic diagram showing the specific neural pathway and the mechanism of activation in the spinal cord CPG and effects on the motor neural circuits during TNES treatment. Scale bar = 300 μm in (A–C), 70 μm in (A1–B1, A2–B2), 20 μm in (A3), 10 μm in (B3, C2), and 30 μm in (C1).

Similar articles

Cited by

References

    1. Gill ML, Grahn PJ, Calvert JS, et al. Neuromodulation of lumbosacral spinal networks enables independent stepping after complete paraplegia. Nat Med. 2018;24(11):1677‐1682. doi:10.1038/s41591-018-0175-7 - DOI - PubMed
    1. Chen X, Wu J, Sun R, et al. Tubular scaffold with microchannels and an H‐shaped lumen loaded with bone marrow stromal cells promotes neuroregeneration and inhibits apoptosis after spinal cord injury. J Tissue Eng Regen Med. 2020;14(3):397‐411. doi:10.1002/term.2996 - DOI - PMC - PubMed
    1. David G, Pfyffer D, Vallotton K, et al. Longitudinal changes of spinal cord grey and white matter following spinal cord injury. J Neurol Neurosurg Psychiatry. 2021;92(11):1222‐1230. doi:10.1136/jnnp-2021-326337 - DOI - PMC - PubMed
    1. James ND, McMahon SB, Field‐Fote EC, Bradbury EJ. Neuromodulation in the restoration of function after spinal cord injury. Lancet Neurol. 2018;17(10):905‐917. doi:10.1016/s1474-4422(18)30287-4 - DOI - PubMed
    1. Madaro L, Passafaro M, Sala D, et al. Denervation‐activated STAT3‐IL‐6 signalling in fibro‐adipogenic progenitors promotes myofibres atrophy and fibrosis. Nat Cell Biol. 2018;20(8):917‐927. doi:10.1038/s41556-018-0151-y - DOI - PMC - PubMed

Publication types