

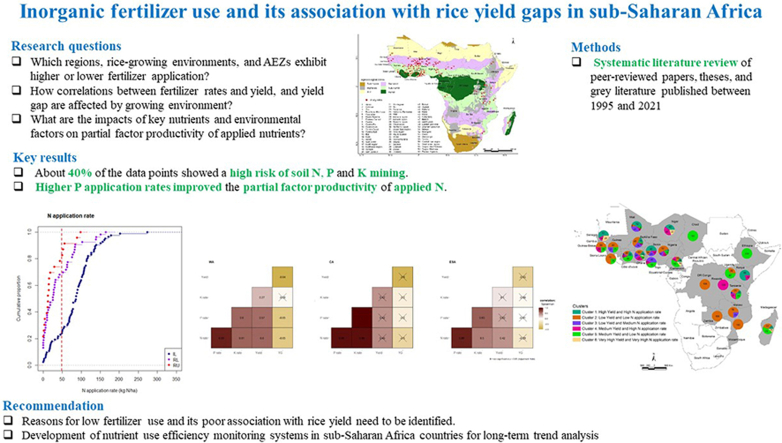
Inorganic fertilizer use and its association with rice yield gaps in sub-Saharan Africa
- PMID: 37752897
- PMCID: PMC10518462
- DOI: 10.1016/j.gfs.2023.100708
Inorganic fertilizer use and its association with rice yield gaps in sub-Saharan Africa
Abstract
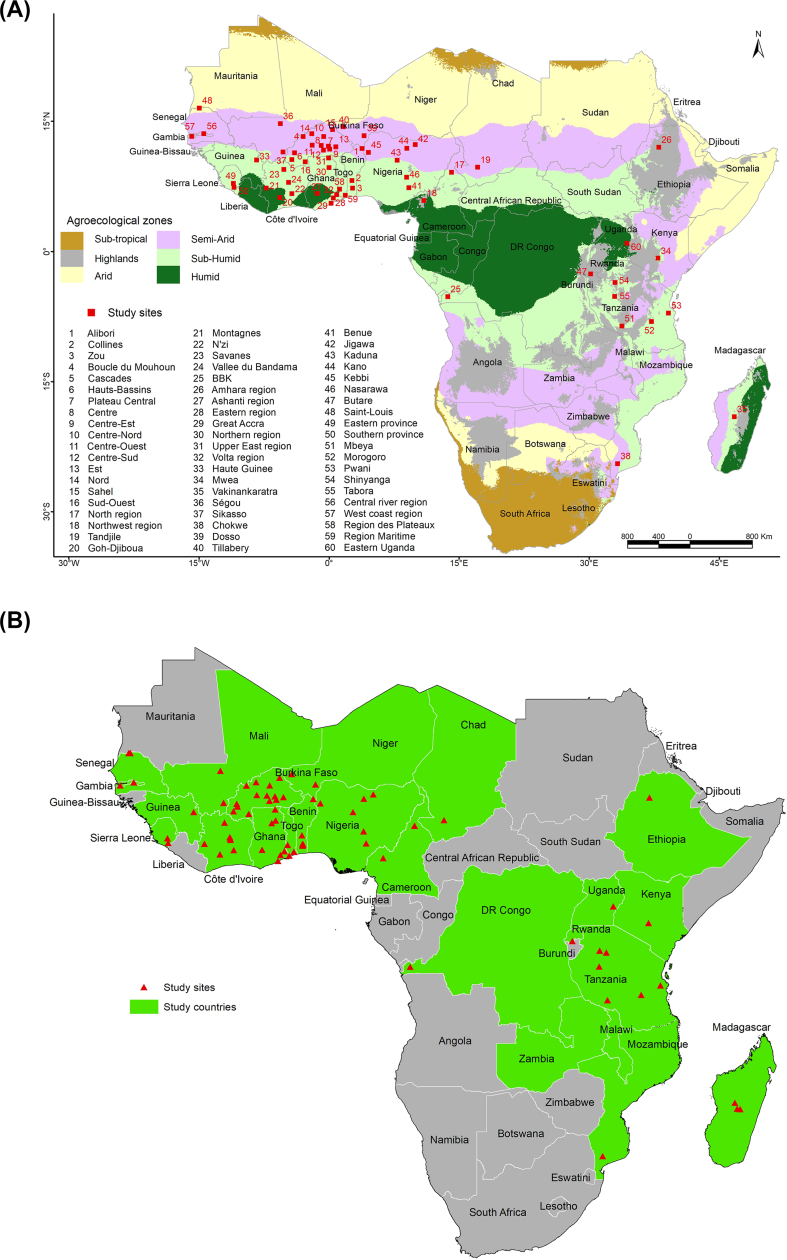
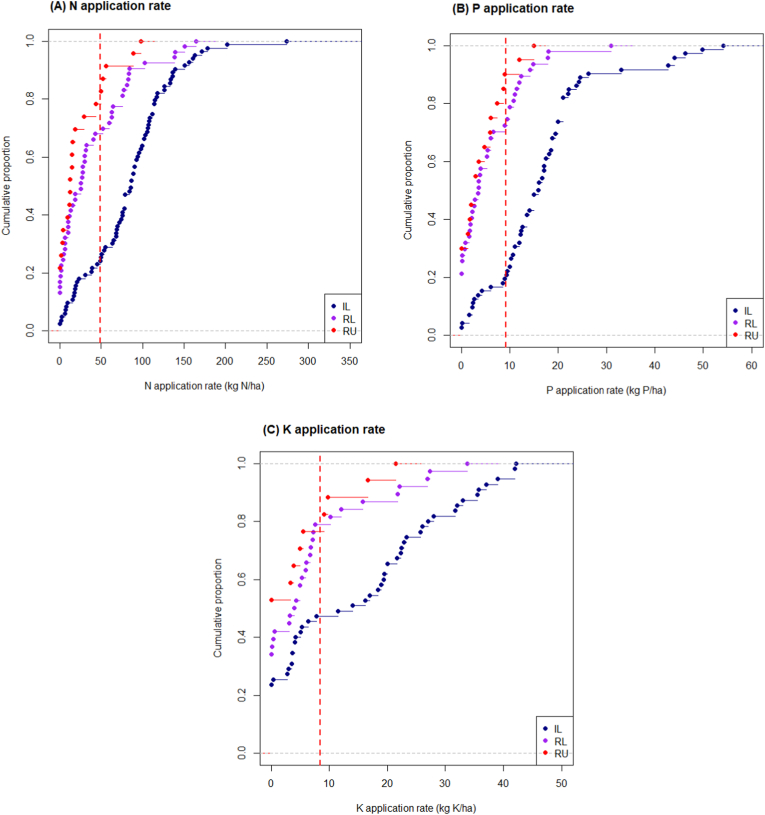
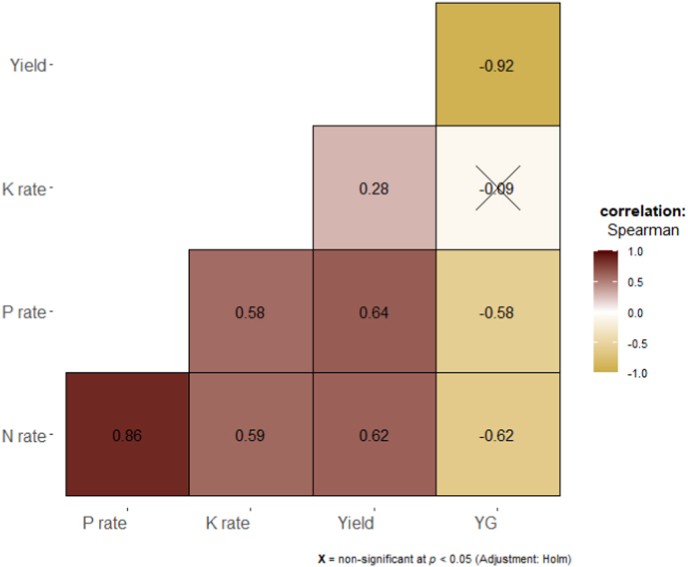
Where and which countries should receive higher priority for improving inorganic fertilizer use in rice fields in sub-Saharan Africa (SSA)? This study addressed this question by assessing the spatial variation in fertilizer use and its association with rice yield and yield gap in 24 SSA countries through a systematic literature review of peer-reviewed papers, theses, and grey literature published between 1995 and 2021. The results showed a large variation in N, P, and K fertilizer application rates and rice yield and an opportunity for narrowing the yield gap by increasing N and P rates, especially in irrigated rice systems. We identified clusters of sites/countries based on nutrient input and yield and suggested research and development strategies for improving yields and optimizing nutrient use efficiencies. Further research is essential to identify the factors causing low fertilizer use and the poor association between its use and yield in rainfed systems.
Keywords: Agroecological zone; Fertilizer use efficiency; Oryza spp.; Partial factor productivity; Yield gap.
© 2023 The Authors.
Conflict of interest statement
The authors declare that they have no known competing financial interests or personal relationships that could have appeared to influence the work reported in this paper.
Figures
References
-
- Arouna A., Devkota K.P., Yergo W.G., Saito K., Frimpong B.N., Adegbola P.Y., Depieu M.E., Kenyi D.M., Ibro G., Fall A.A., Usman S. Assessing rice production sustainability performance indicators and their gaps in twelve sub-Saharan African countries. Field Crop. Res. 2021;271 doi: 10.1016/j.fcr.2021.108263. - DOI - PMC - PubMed
-
- Arouna A., Michler J.D., Yergo W.G., Saito K. One size fits all? Experimental evidence on the digital delivery of personalized extension advice in Nigeria. Am. J. Agric. Econ. 2021;103:596–619. doi: 10.1111/ajae.12151. - DOI
-
- Asai H., Saito K., Kawamura K. Application of a Bayesian approach to quantify the impact of nitrogen fertilizer on upland rice yield in sub-Saharan Africa. Field Crop. Res. 2021;272 doi: 10.1016/j.fcr.2021.108284. - DOI
-
- Awio T., Senthilkumar K., Dimkpa C.O., Otim-Nape G.W., Kempen B., Struik P.C., Stomph T.J. Micro-nutrients in East African lowlands: are they needed to intensify rice production? Field Crop. Res. 2021;270 doi: 10.1016/j.fcr.2021.108219. - DOI
Publication types
LinkOut - more resources
Full Text Sources
Research Materials
Miscellaneous