

Investigating the value of glucodensity analysis of continuous glucose monitoring data in type 1 diabetes: an exploratory analysis
- PMID: 37753312
- PMCID: PMC10518413
- DOI: 10.3389/fcdhc.2023.1244613
Investigating the value of glucodensity analysis of continuous glucose monitoring data in type 1 diabetes: an exploratory analysis
Abstract
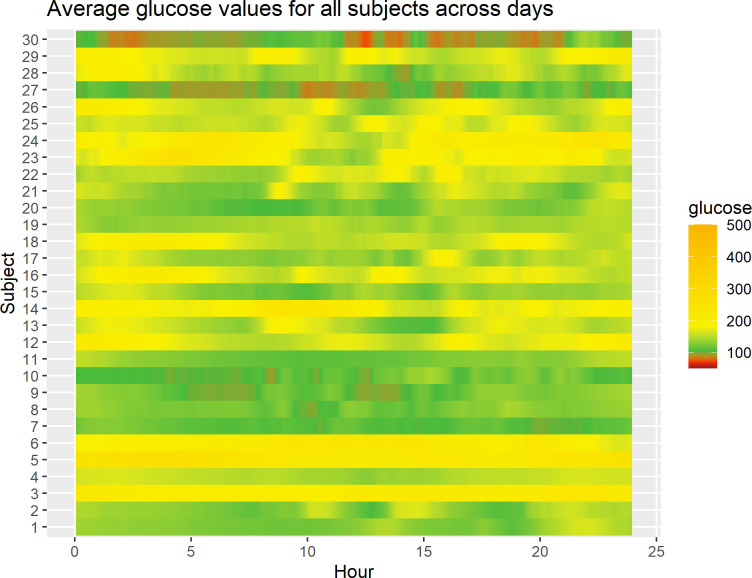
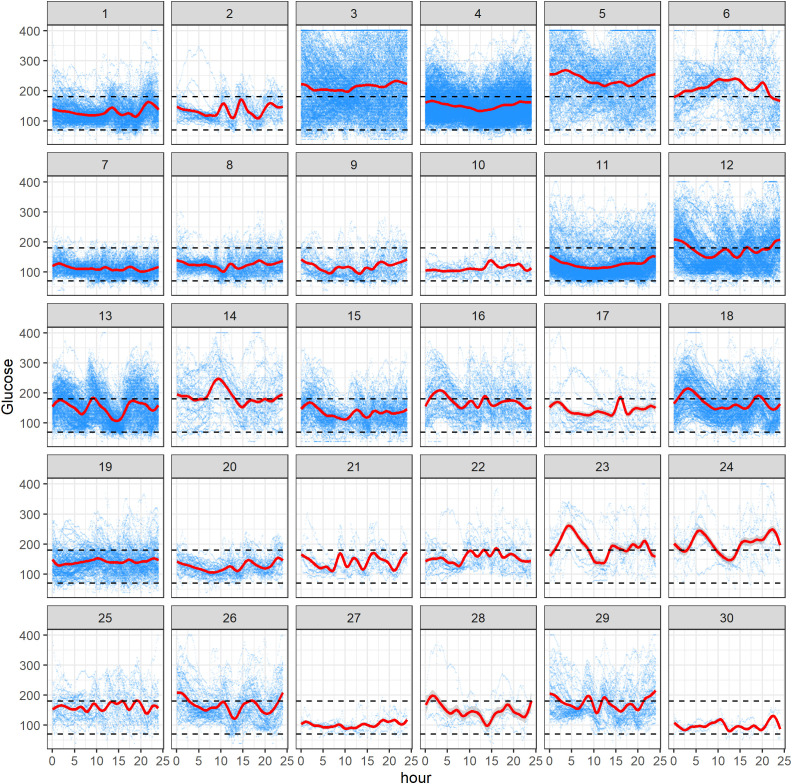
Introduction: Continuous glucose monitoring (CGM) devices capture longitudinal data on interstitial glucose levels and are increasingly used to show the dynamics of diabetes metabolism. Given the complexity of CGM data, it is crucial to extract important patterns hidden in these data through efficient visualization and statistical analysis techniques.
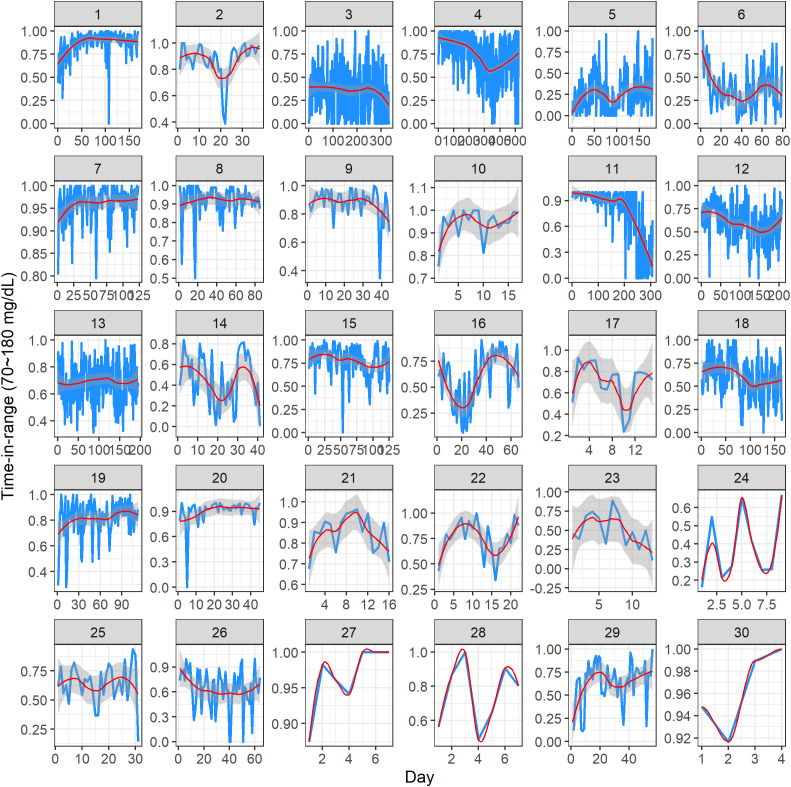
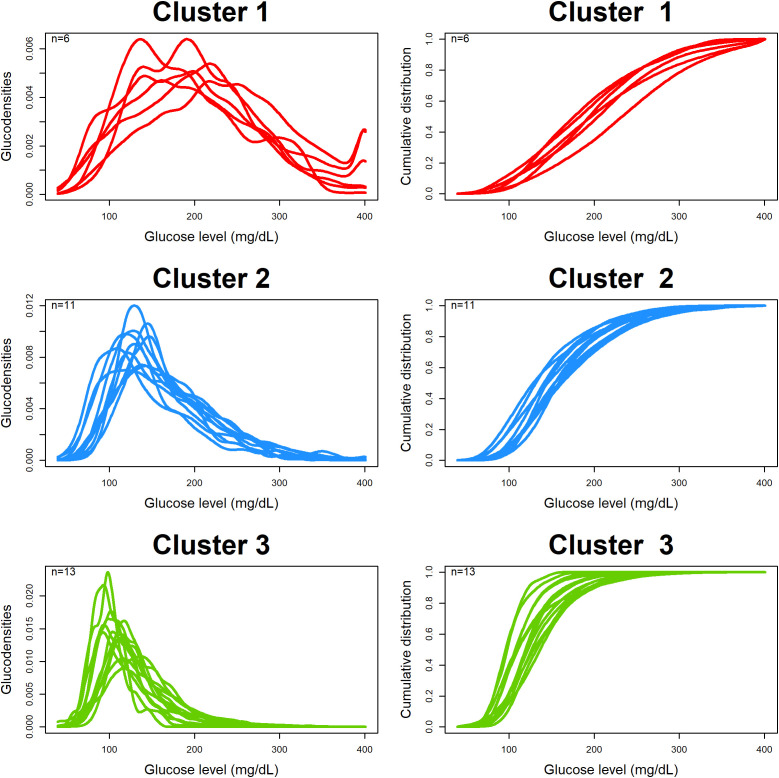
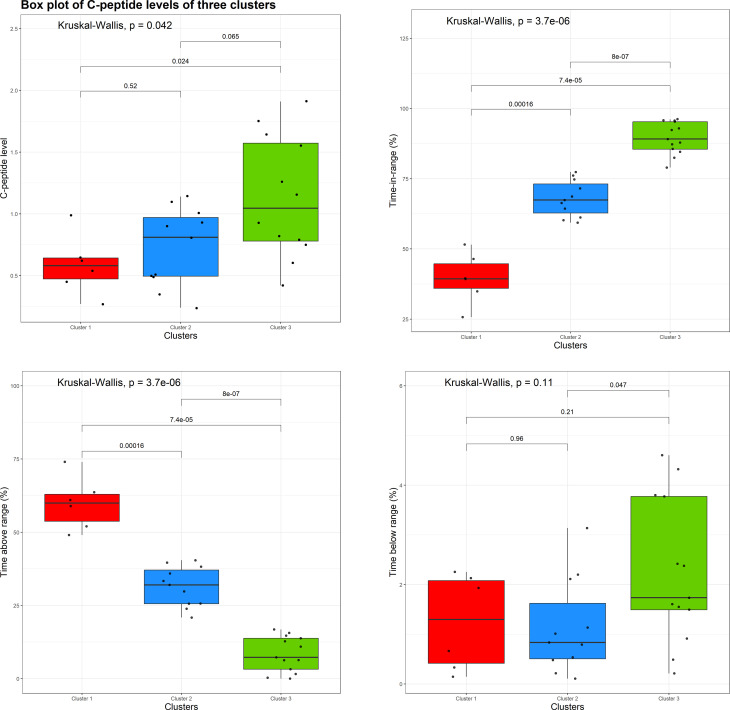
Methods: In this paper, we adopted the concept of glucodensity, and using a subset of data from an ongoing clinical trial in pediatric individuals and young adults with new-onset type 1 diabetes, we performed a cluster analysis of glucodensities. We assessed the differences among the identified clusters using analysis of variance (ANOVA) with respect to residual pancreatic beta-cell function and some standard CGM-derived parameters such as time in range, time above range, and time below range.
Results: Distinct CGM data patterns were identified using cluster analysis based on glucodensities. Statistically significant differences were shown among the clusters with respect to baseline levels of pancreatic beta-cell function surrogate (C-peptide) and with respect to time in range and time above range.
Discussion: Our findings provide supportive evidence for the value of glucodensity in the analysis of CGM data. Some challenges in the modeling of CGM data include unbalanced data structure, missing observations, and many known and unknown confounders, which speaks to the importance of--and provides opportunities for--taking an approach integrating clinical, statistical, and data science expertise in the analysis of these data.
Keywords: CGM; functional data analysis; glucodensity; pharmacodynamics; visualization.
Copyright © 2023 Cui, Goldfine, Quinlan, James and Sverdlov.
Conflict of interest statement
The analyzed data is from a study sponsored by Novartis Institutes for Biomedical Research. Authors AG, MQ, DJ, and OS are employed by the company Novartis. The remaining author declares that the research was conducted in the absence of any commercial or financial relationships that could be construed as a potential conflict of interest.
Figures
Similar articles
-
Glucodensities: A new representation of glucose profiles using distributional data analysis.Stat Methods Med Res. 2021 Jun;30(6):1445-1464. doi: 10.1177/0962280221998064. Epub 2021 Mar 24. Stat Methods Med Res. 2021. PMID: 33760665 Free PMC article.
-
Diabetes technology and treatments in the paediatric age group.Int J Clin Pract Suppl. 2011 Feb;(170):76-82. doi: 10.1111/j.1742-1241.2010.02582.x. Int J Clin Pract Suppl. 2011. PMID: 21323816 Review.
-
Multilevel clustering approach driven by continuous glucose monitoring data for further classification of type 2 diabetes.BMJ Open Diabetes Res Care. 2021 Feb;9(1):e001869. doi: 10.1136/bmjdrc-2020-001869. BMJ Open Diabetes Res Care. 2021. PMID: 33627315 Free PMC article.
-
The effectiveness of continuous subcutaneous insulin pumps with continuous glucose monitoring in outpatient adolescents with type 1 diabetes: A systematic review.JBI Libr Syst Rev. 2012;10(42 Suppl):1-10. doi: 10.11124/jbisrir-2012-170. JBI Libr Syst Rev. 2012. PMID: 27820140
-
Role of continuous glucose monitoring for type 2 in diabetes management and research.J Diabetes Complications. 2017 Jan;31(1):280-287. doi: 10.1016/j.jdiacomp.2016.10.007. Epub 2016 Oct 14. J Diabetes Complications. 2017. PMID: 27818105 Review.
Cited by
-
Multilevel functional data analysis modeling of human glucose response to meal intake.ArXiv [Preprint]. 2024 May 23:arXiv:2405.14690v1. ArXiv. 2024. PMID: 38827463 Free PMC article. Preprint.
References
-
- Atkinson MA, McGill DE, Dassau E, Laffel L. Type 1 diabetes mellitus. In: Melmed S, Auchus RJ, Goldfine AB, Koenig RJ, Rosen CJ, editors. Williams textbook of endocrinology, 14th edition. Philadelphia, PA: Elsevier; (2020). p. 1403–37.
-
- Ferstad JO, Vallon JJ, Jun D, Gu A, Vitko A, Morales DP, et al. . Population-level management of type 1 diabetes via continuous glucose monitoring and algorithm-enabled patient prioritization: Precision health meets population health. Pediatr Diabetes (2021) 22(7):982–91. doi: 10.1111/pedi.13256 - DOI - PMC - PubMed
LinkOut - more resources
Full Text Sources