

Evidence of synergy coordination patterns of upper-limb motor control in stroke patients with mild and moderate impairment
- PMID: 37753453
- PMCID: PMC10518409
- DOI: 10.3389/fphys.2023.1214995
Evidence of synergy coordination patterns of upper-limb motor control in stroke patients with mild and moderate impairment
Abstract
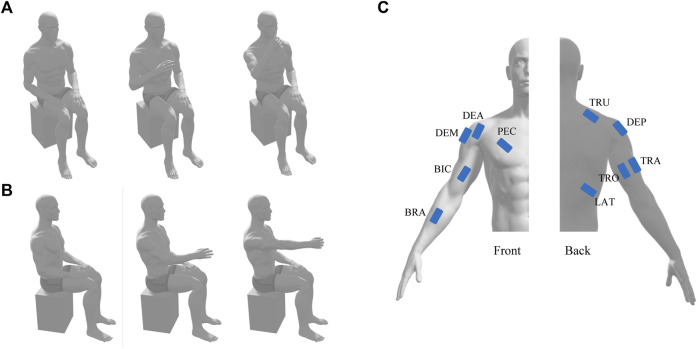
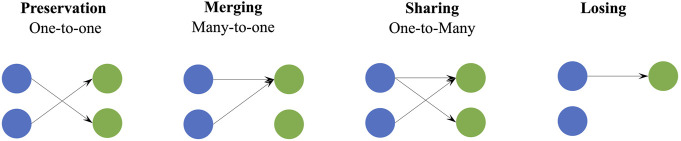
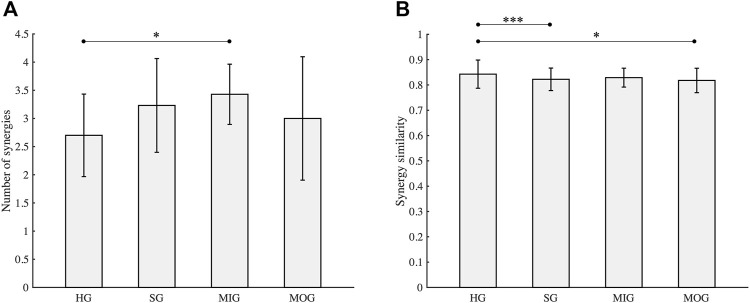
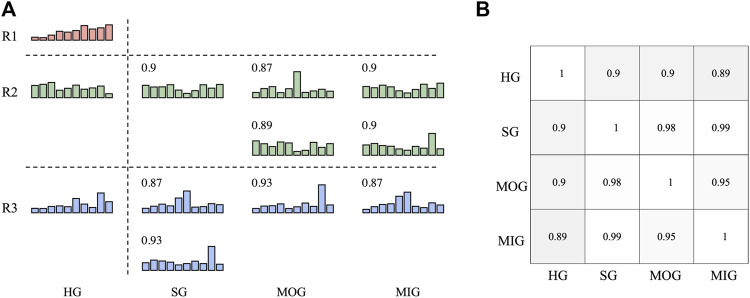
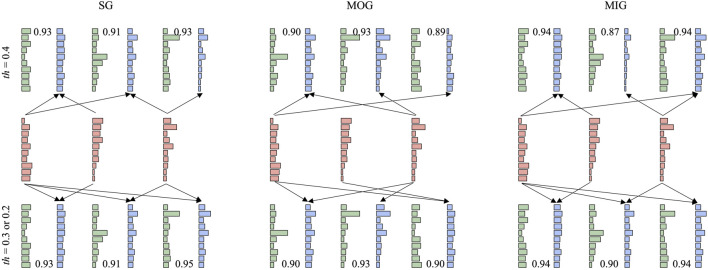
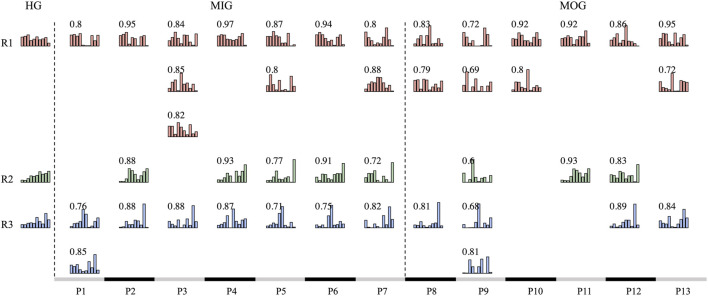
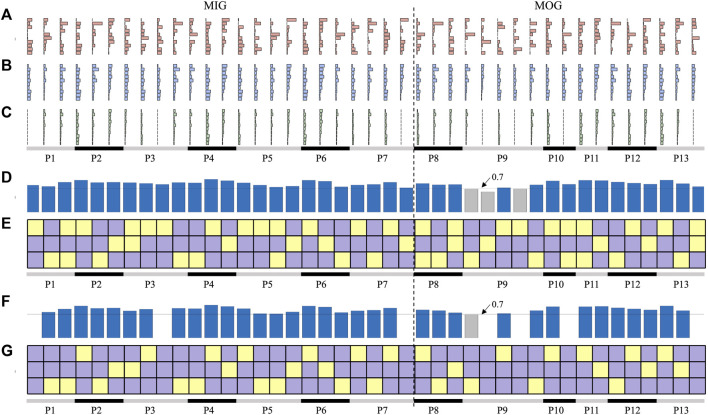
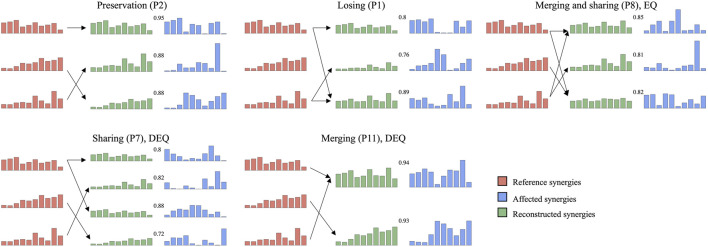
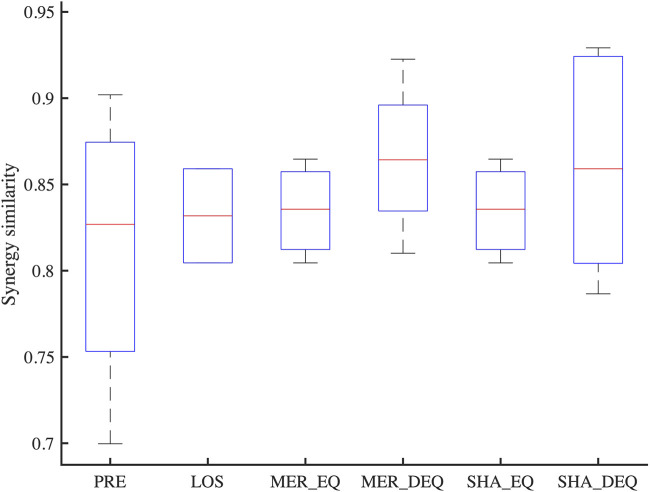
Objectives: Previous studies showed that the central nervous system (CNS) controls movements by recruiting a low-dimensional set of modules, usually referred to as muscle synergies. Stroke alters the structure and recruitment patterns of muscle synergies, leading to abnormal motor performances. Some studies have shown that muscle synergies can be used as biomarkers for assessing motor function. However, coordination patterns of muscle synergies in post-stroke patients need more investigation to characterize how they are modified in functional movements. Methods: Thirteen mild-to-moderate stroke patients and twenty age-matched healthy subjects were recruited to perform two upper-limb movements, hand-to-mouth movement and reaching movement. Muscle synergies were extracted with nonnegative matrix factorization. We identified a set of reference synergies (i.e., averaged across healthy subjects) and typical synergies (i.e., averaged across stroke subjects) from the healthy group and stroke group respectively, and extracted affected synergies from each patient. Synergy similarity between groups was computed and analyzed. Synergy reconstruction analysis was performed to verify synergy coordination patterns in post-stroke patients. Results: On average, three synergies were extracted from both the healthy and stroke groups, while the mild impairment group had a significantly higher number of synergies than the healthy group. The similarity analysis showed that synergy structure was more consistent in the healthy group, and stroke instead altered synergy structure and induced more variability. Synergy reconstruction analysis at group and individual levels showed that muscle synergies of patients often showed a combination of healthy reference synergies in the analyzed movements. Finally, this study associated four synergy coordination patterns with patients: merging (equilibrium and disequilibrium), sharing (equilibrium and disequilibrium), losing, and preservation. The preservation was mainly represented in the mild impairment group, and the moderate impairment group showed more merging and sharing. Conclusion: This study concludes that stroke shows more synergy variability compared to the healthy group and the alterations of muscle synergies can be described as a combination of reference synergies by four synergy coordination patterns. These findings deepen the understanding of the underlying neurophysiological mechanisms and possible motor control strategies adopted by the CNS in post-stroke patients.
Keywords: electromyography (EMG); muscle synergies; rehabilitation; stroke; synergic patterns; upper-limb.
Copyright © 2023 Zhao, He, Xiang, Zhou, Zhang, Li and Scano.
Conflict of interest statement
The authors declare that the research was conducted in the absence of any commercial or financial relationships that could be construed as a potential conflict of interest.
Figures
Similar articles
-
Alterations in intermuscular coordination underlying isokinetic exercise after a stroke and their implications on neurorehabilitation.J Neuroeng Rehabil. 2021 Jul 3;18(1):110. doi: 10.1186/s12984-021-00900-9. J Neuroeng Rehabil. 2021. PMID: 34217328 Free PMC article.
-
Muscle-to-action mapping for intuitive training of muscle synergies in post-stroke upper-limb rehabilitation.J Neuroeng Rehabil. 2025 Apr 28;22(1):99. doi: 10.1186/s12984-025-01630-y. J Neuroeng Rehabil. 2025. PMID: 40296104 Free PMC article.
-
Evidence for altered upper extremity muscle synergies in chronic stroke survivors with mild and moderate impairment.Front Hum Neurosci. 2015 Feb 11;9:6. doi: 10.3389/fnhum.2015.00006. eCollection 2015. Front Hum Neurosci. 2015. PMID: 25717296 Free PMC article.
-
Muscle synergies for evaluating upper limb in clinical applications: A systematic review.Heliyon. 2023 May 11;9(5):e16202. doi: 10.1016/j.heliyon.2023.e16202. eCollection 2023 May. Heliyon. 2023. PMID: 37215841 Free PMC article. Review.
-
Neuromuscular synergies in motor control in normal and poststroke individuals.Rev Neurosci. 2018 Aug 28;29(6):593-612. doi: 10.1515/revneuro-2017-0058. Rev Neurosci. 2018. PMID: 29397390 Review.
Cited by
-
Alterations of upper-extremity functional muscle networks in chronic stroke survivors.Exp Brain Res. 2024 Dec 23;243(1):31. doi: 10.1007/s00221-024-06973-x. Exp Brain Res. 2024. PMID: 39710730 Free PMC article.
References
LinkOut - more resources
Full Text Sources