Computational Analysis of Plasma Lipidomics from Mice Fed Standard Chow and Ketogenic Diet
- PMID: 37753463
- PMCID: PMC10518786
- DOI: 10.21769/BioProtoc.4819
Computational Analysis of Plasma Lipidomics from Mice Fed Standard Chow and Ketogenic Diet
Abstract
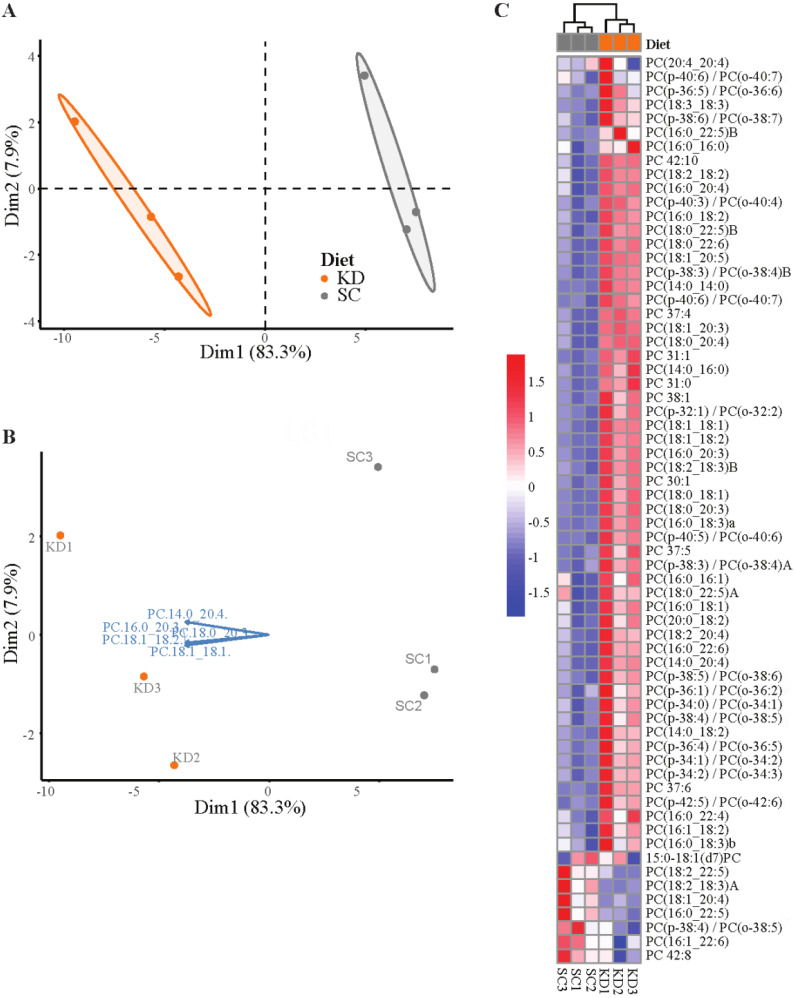
Dietary saturated fatty acids (SFAs) are upregulated in the blood circulation following digestion. A variety of circulating lipid species have been implicated in metabolic and inflammatory diseases; however, due to the extreme variability in serum or plasma lipid concentrations found in human studies, established reference ranges are still lacking, in addition to lipid specificity and diagnostic biomarkers. Mass spectrometry is widely used for identification of lipid species in the plasma, and there are many differences in sample extraction methods within the literature. We used ultra-high performance liquid chromatography (UPLC) coupled to a high-resolution hybrid triple quadrupole-time-of-flight (QToF) mass spectrometry (MS) to compare relative peak abundance of specific lipid species within the following lipid classes: free fatty acids (FFAs), triglycerides (TAGs), phosphatidylcholines (PCs), and sphingolipids (SGs), in the plasma of mice fed a standard chow (SC; low in SFAs) or ketogenic diet (KD; high in SFAs) for two weeks. In this protocol, we used Principal Component Analysis (PCA) and R to visualize how individual mice clustered together according to their diet, and we found that KD-fed mice displayed unique blood profiles for many lipid species identified within each lipid class compared to SC-fed mice. We conclude that two weeks of KD feeding is sufficient to significantly alter circulating lipids, with PCs being the most altered lipid class, followed by SGs, TAGs, and FFAs, including palmitic acid (PA) and PA-saturated lipids. This protocol is needed to advance knowledge on the impact that SFA-enriched diets have on concentrations of specific lipids in the blood that are known to be associated with metabolic and inflammatory diseases. Key features • Analysis of relative plasma lipid concentrations from mice on different diets using R. • Lipidomics data collected via ultra-high performance liquid chromatography (UPLC) coupled to a high-resolution hybrid triple quadrupole-time-of-flight (QToF) mass spectrometry (MS). • Allows for a comprehensive comparison of diet-dependent plasma lipid profiles, including a variety of specific lipid species within several different lipid classes. • Accumulation of certain free fatty acids, phosphatidylcholines, triglycerides, and sphingolipids are associated with metabolic and inflammatory diseases, and plasma concentrations may be clinically useful.
Keywords: Circulating lipids; Free fatty acids; Ketogenic diet; Lipidomics; Mass spectrometry; Phosphatidylcholines; Sphingolipids; Triglycerides.
©Copyright : © 2023 The Authors; This is an open access article under the CC BY license.
Conflict of interest statement
Competing interestsNo competing interests declared.
Figures
References
-
- Abdi H. and Williams L. J.(2010). Principal component analysis. Wiley Interdiscip. Rev. Comput. Stat. 2(4): 433-459.
-
- Batarseh A. M., Abbott S. K., Duchoslav E., Alqarni A., Blanksby S. J. and Mitchell T. W.(2018). Discrimination of isobaric and isomeric lipids in complex mixtures by combining ultra-high pressure liquid chromatography with collision and ozone-induced dissociation. Int. J. Mass Spectrom. 431: 27-36.
Grants and funding
LinkOut - more resources
Full Text Sources