. 2023 Dec 10;42(28):5160-5188.
doi: 10.1002/sim.9906. Epub 2023 Sep 27.

Estimating seroconversion rates accounting for repeated infections by approximate Bayesian computation

Affiliations

Estimating seroconversion rates accounting for repeated infections by approximate Bayesian computation

Peter F M Teunis et al. Stat Med. .

Abstract

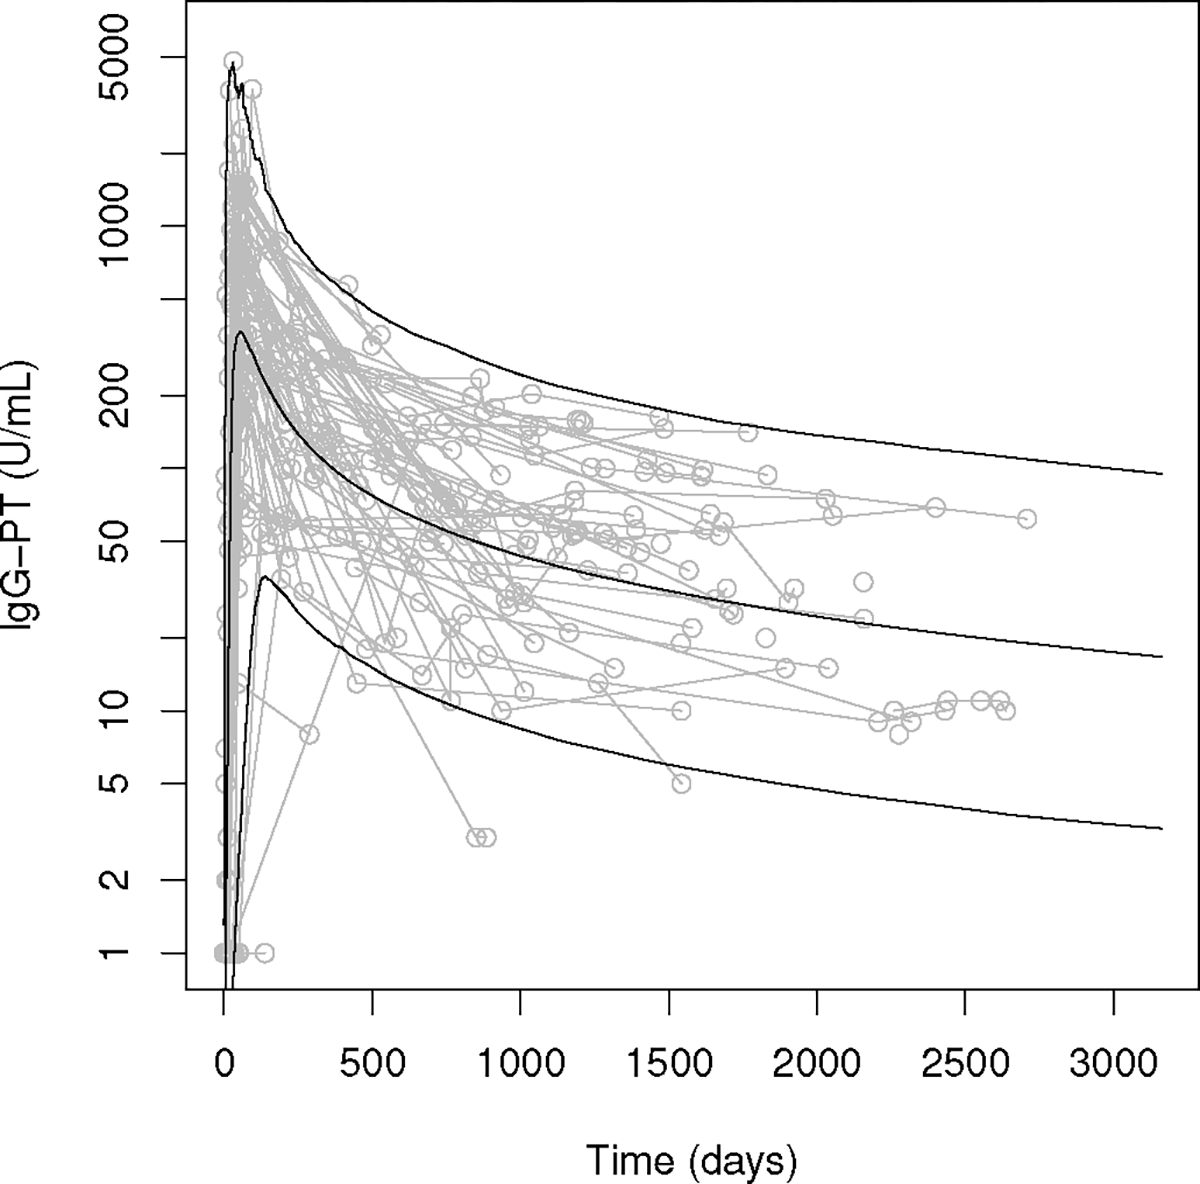
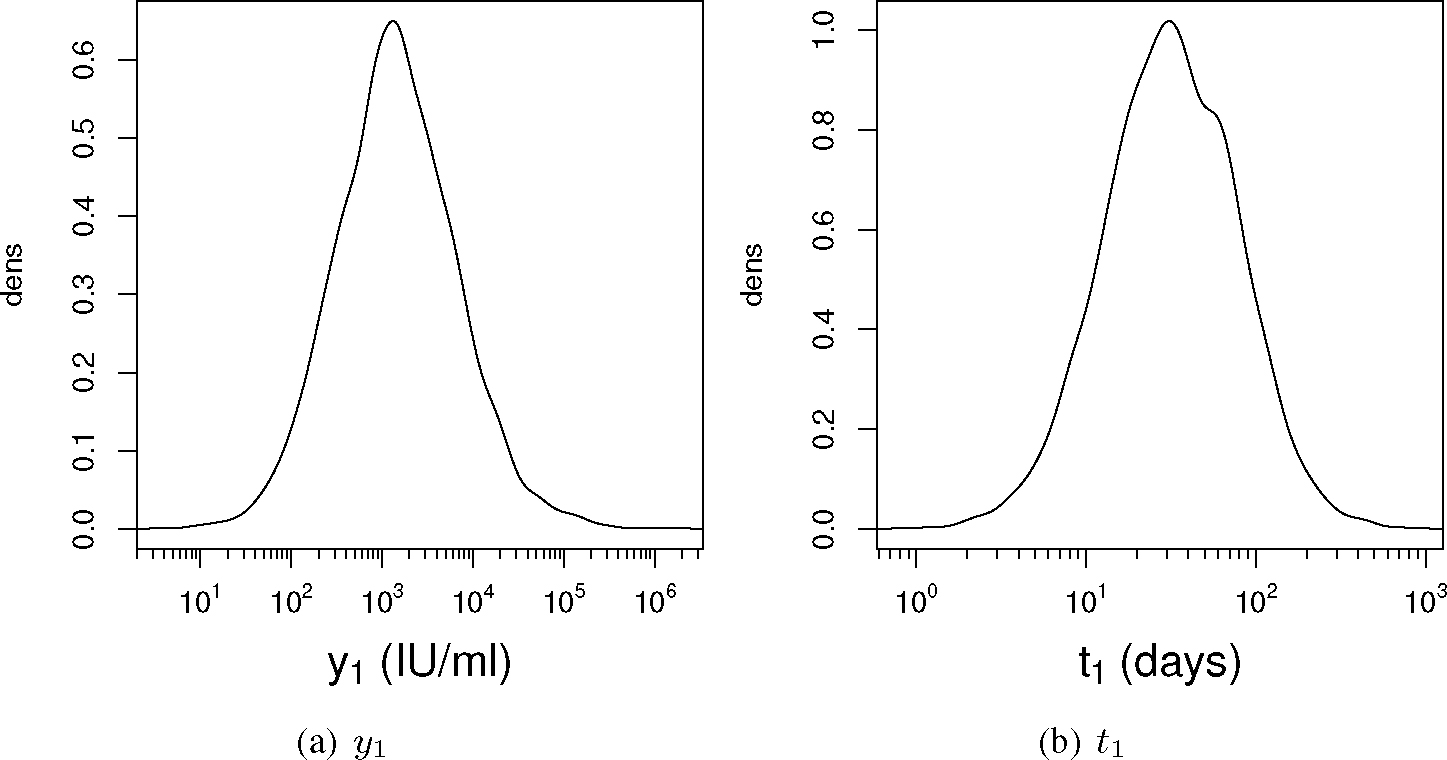
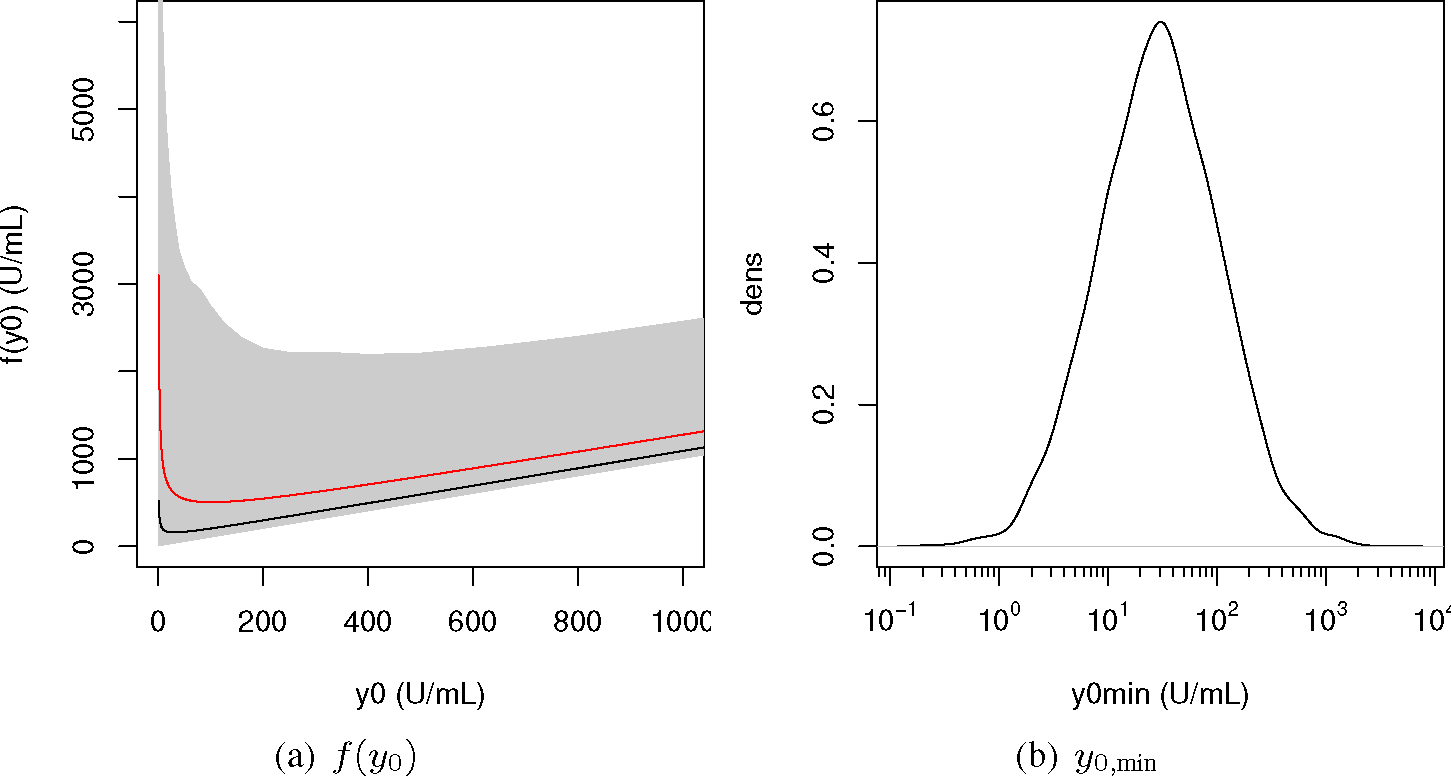
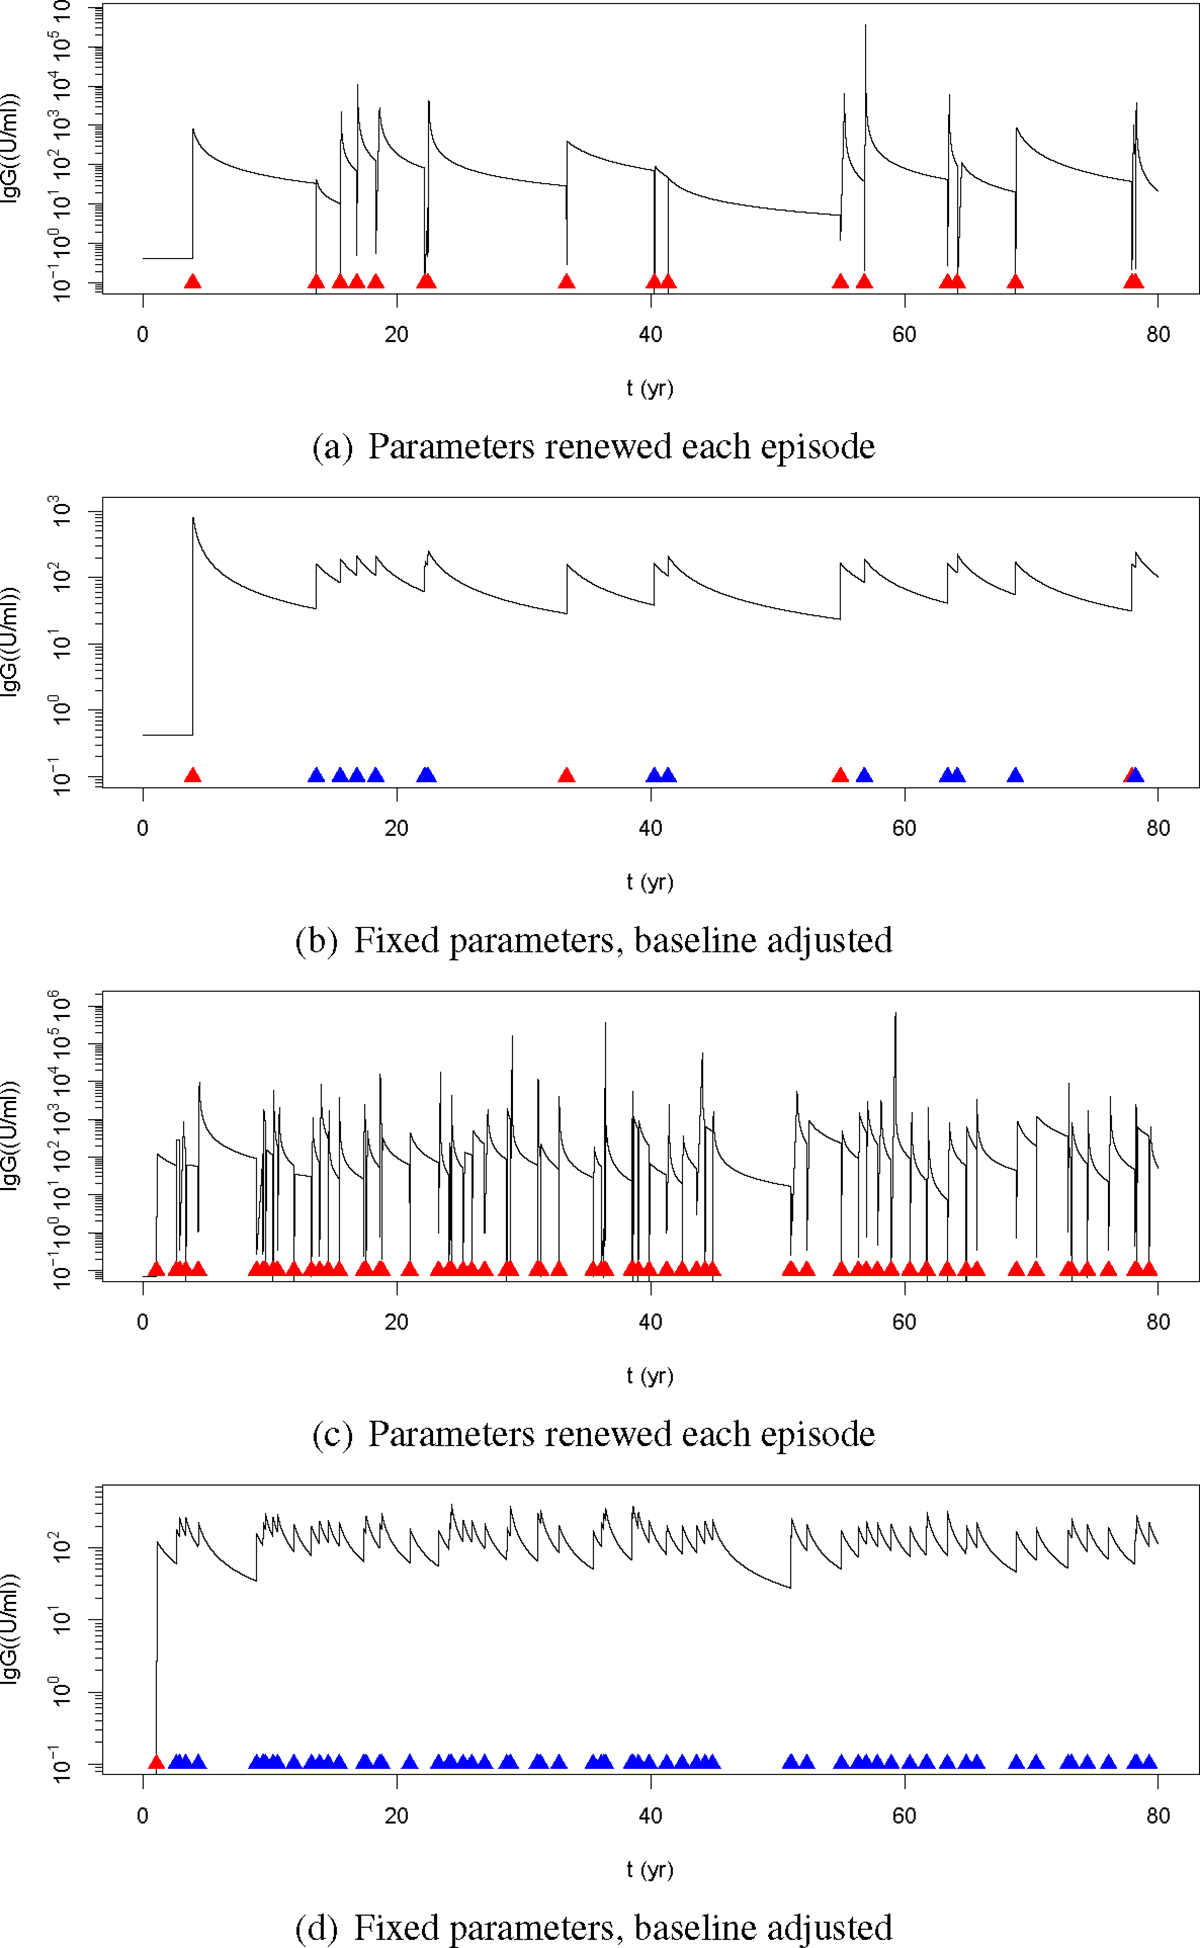
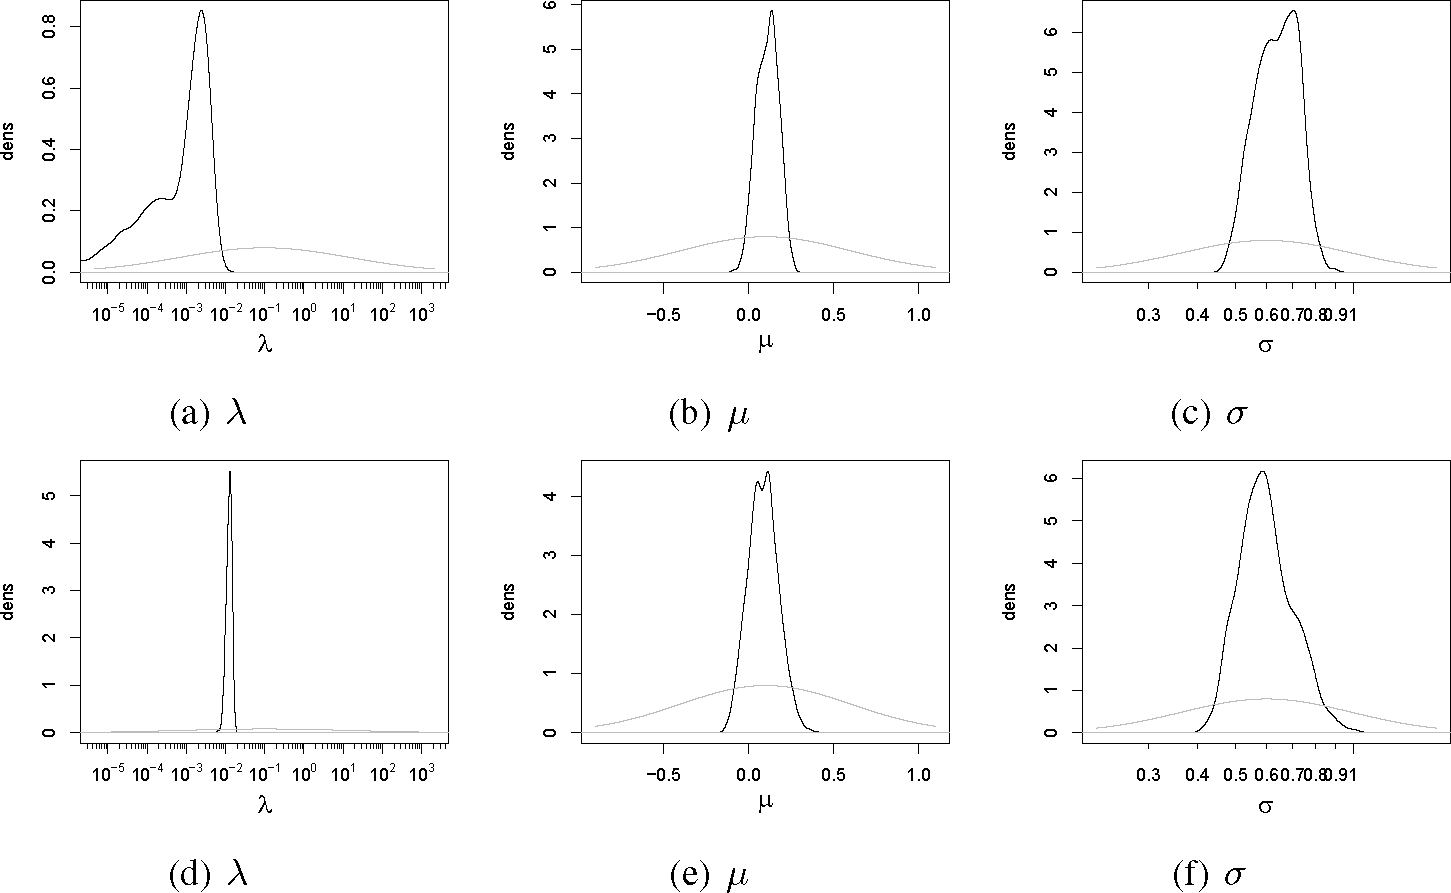
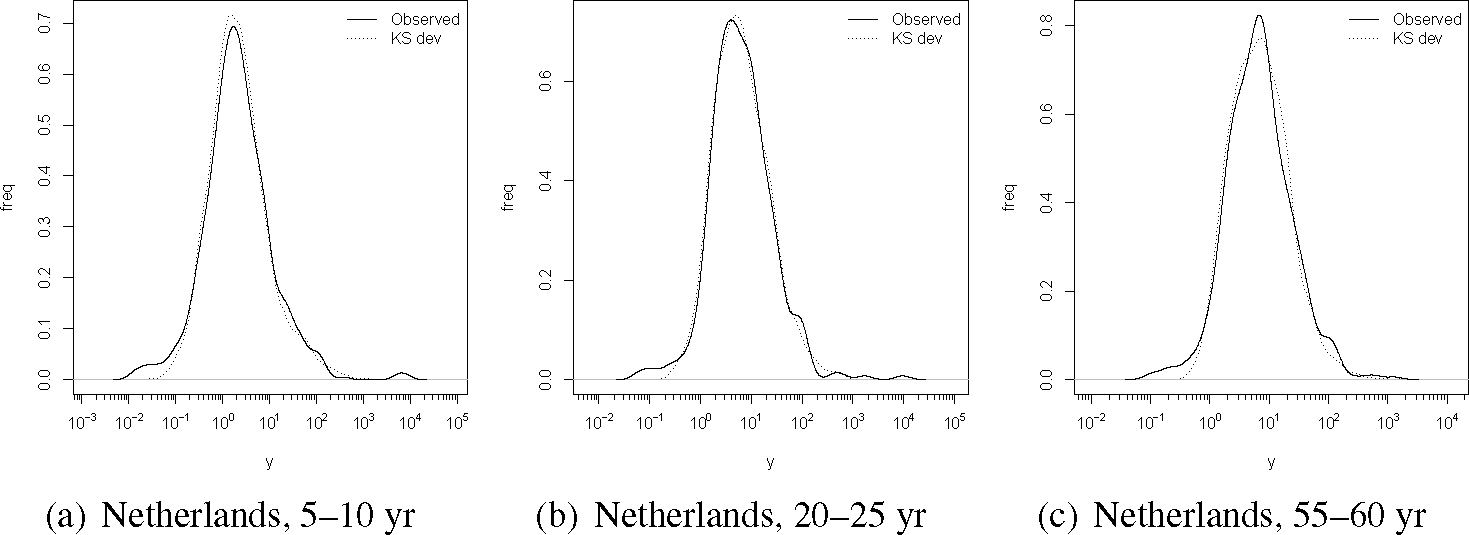
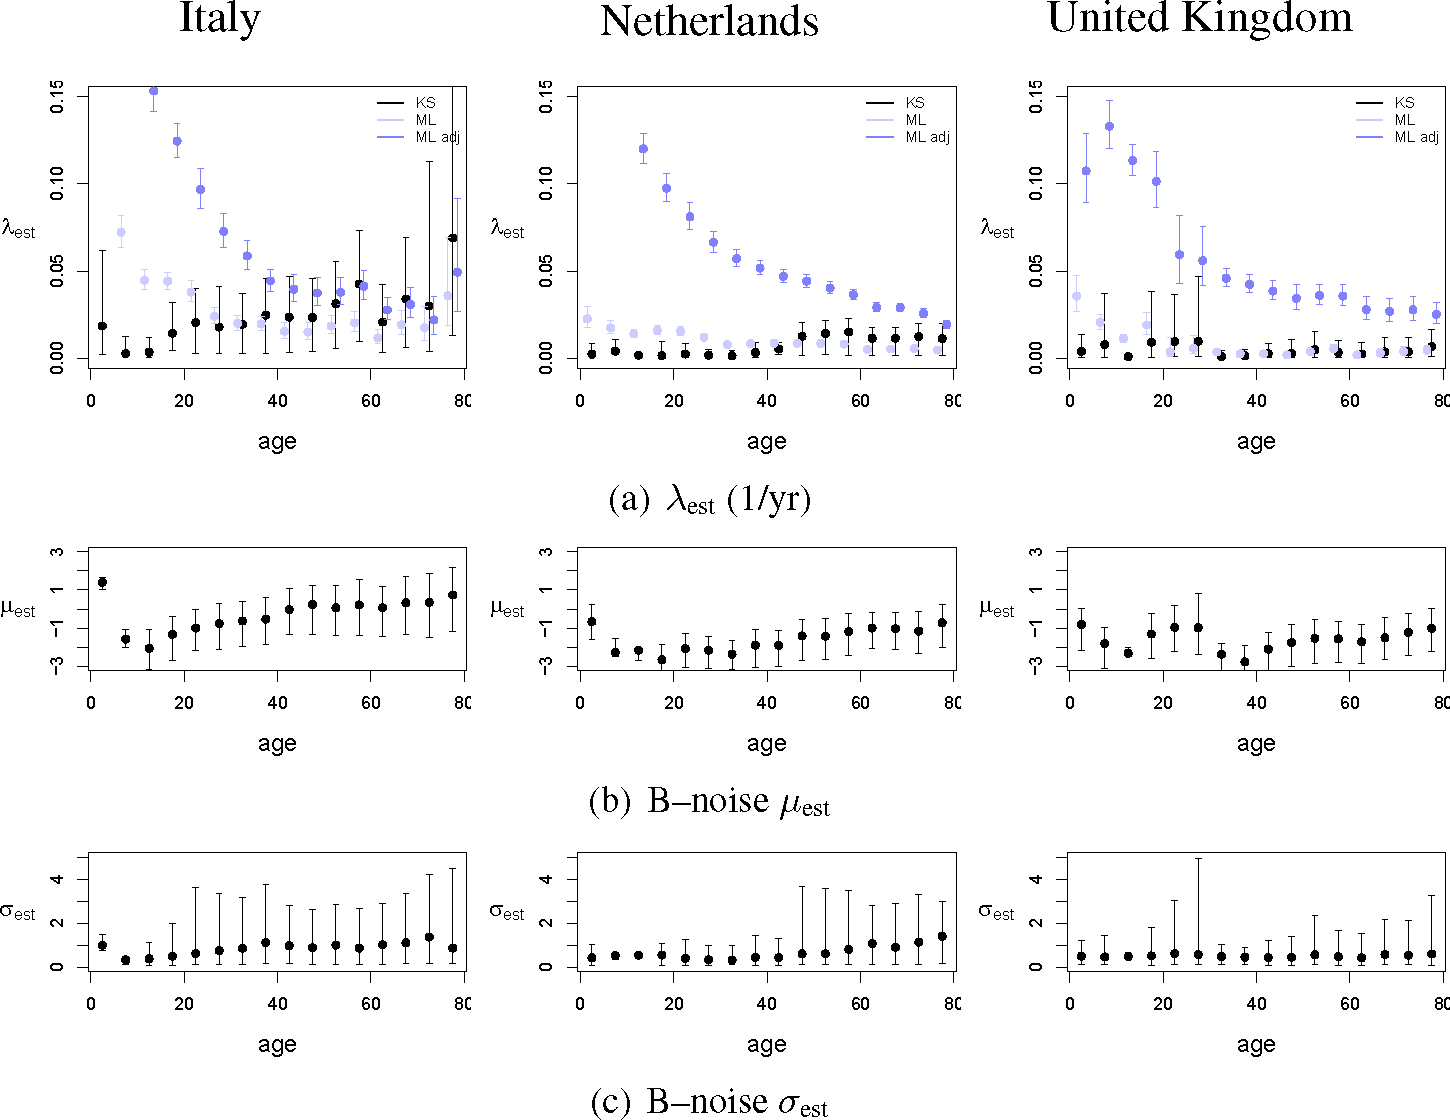
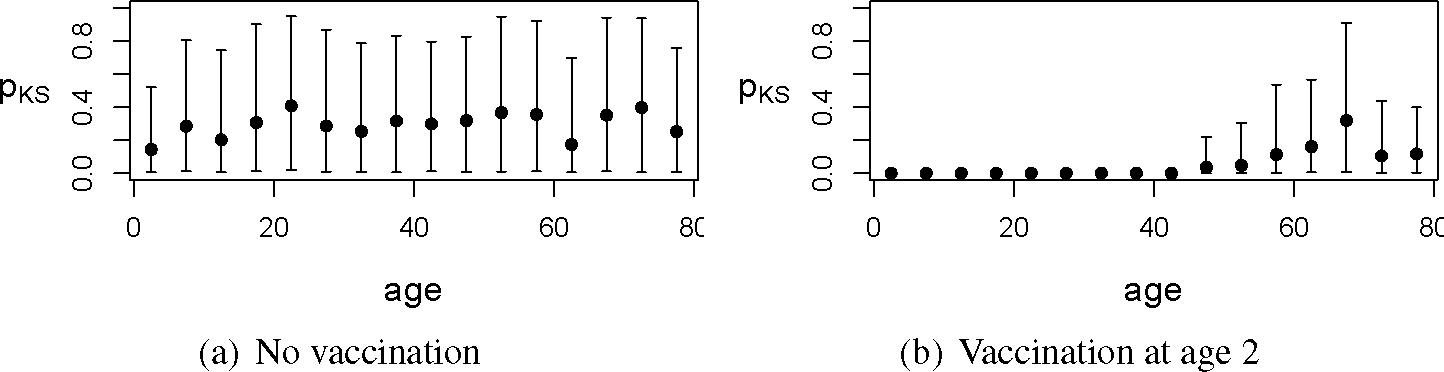
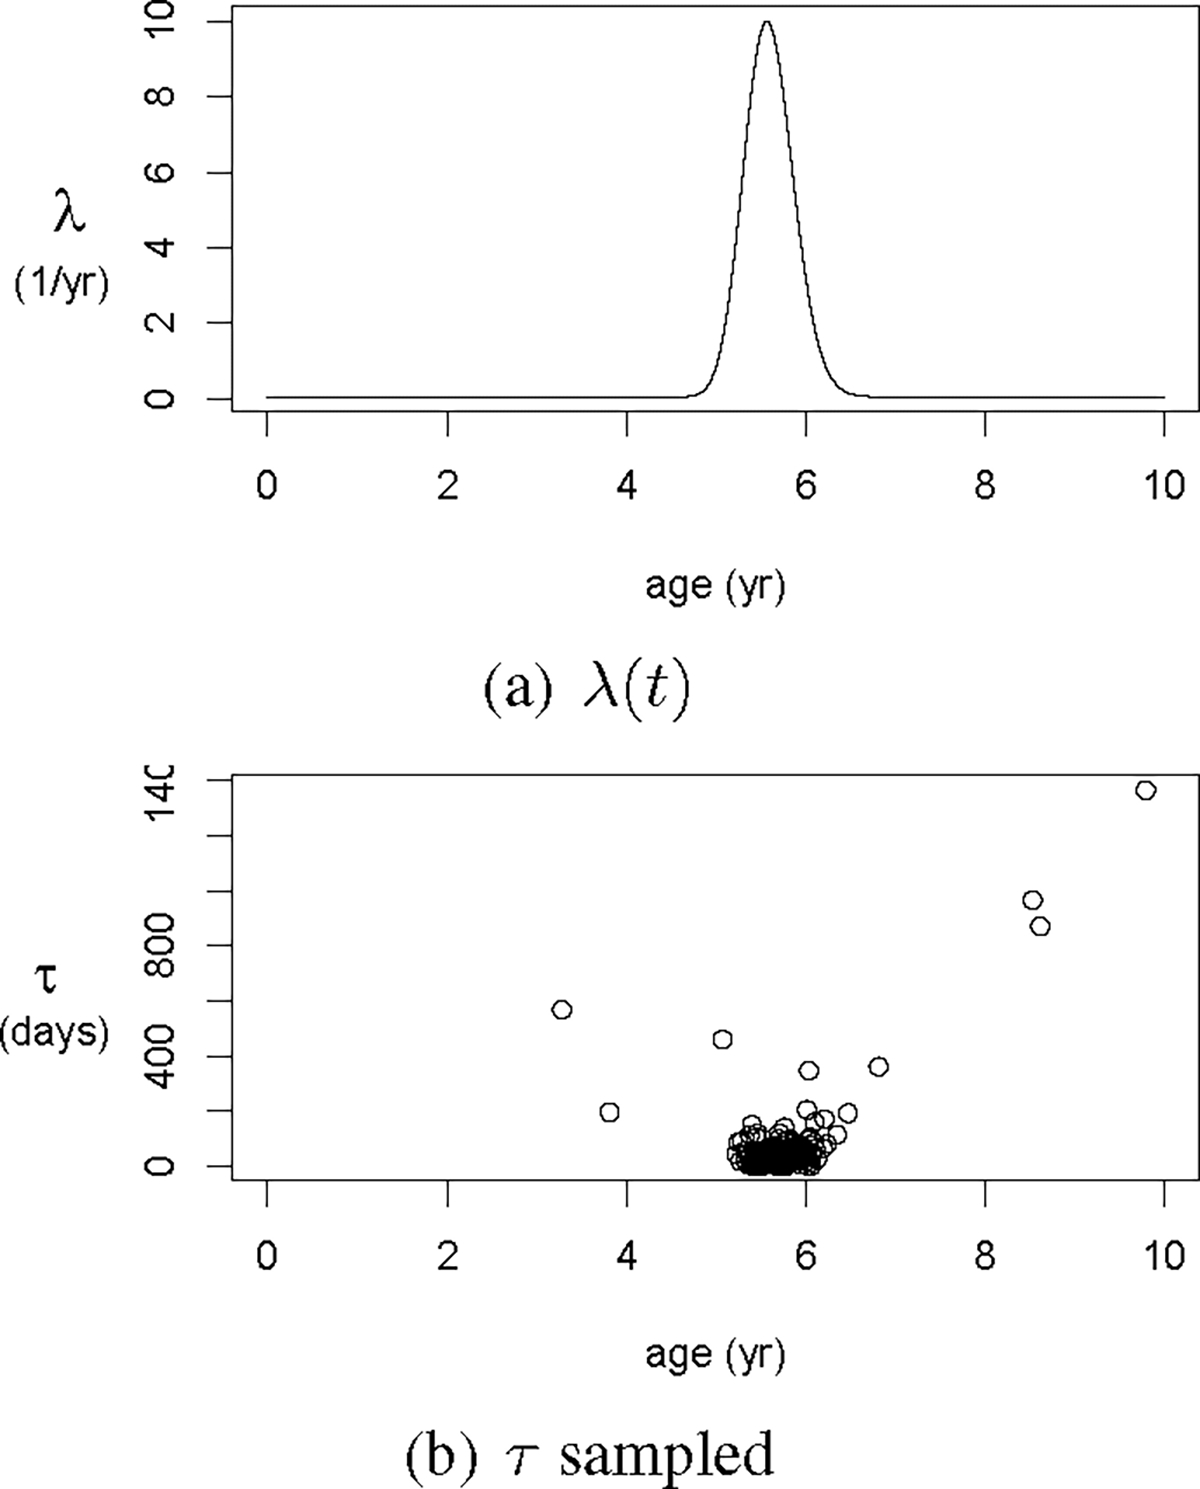
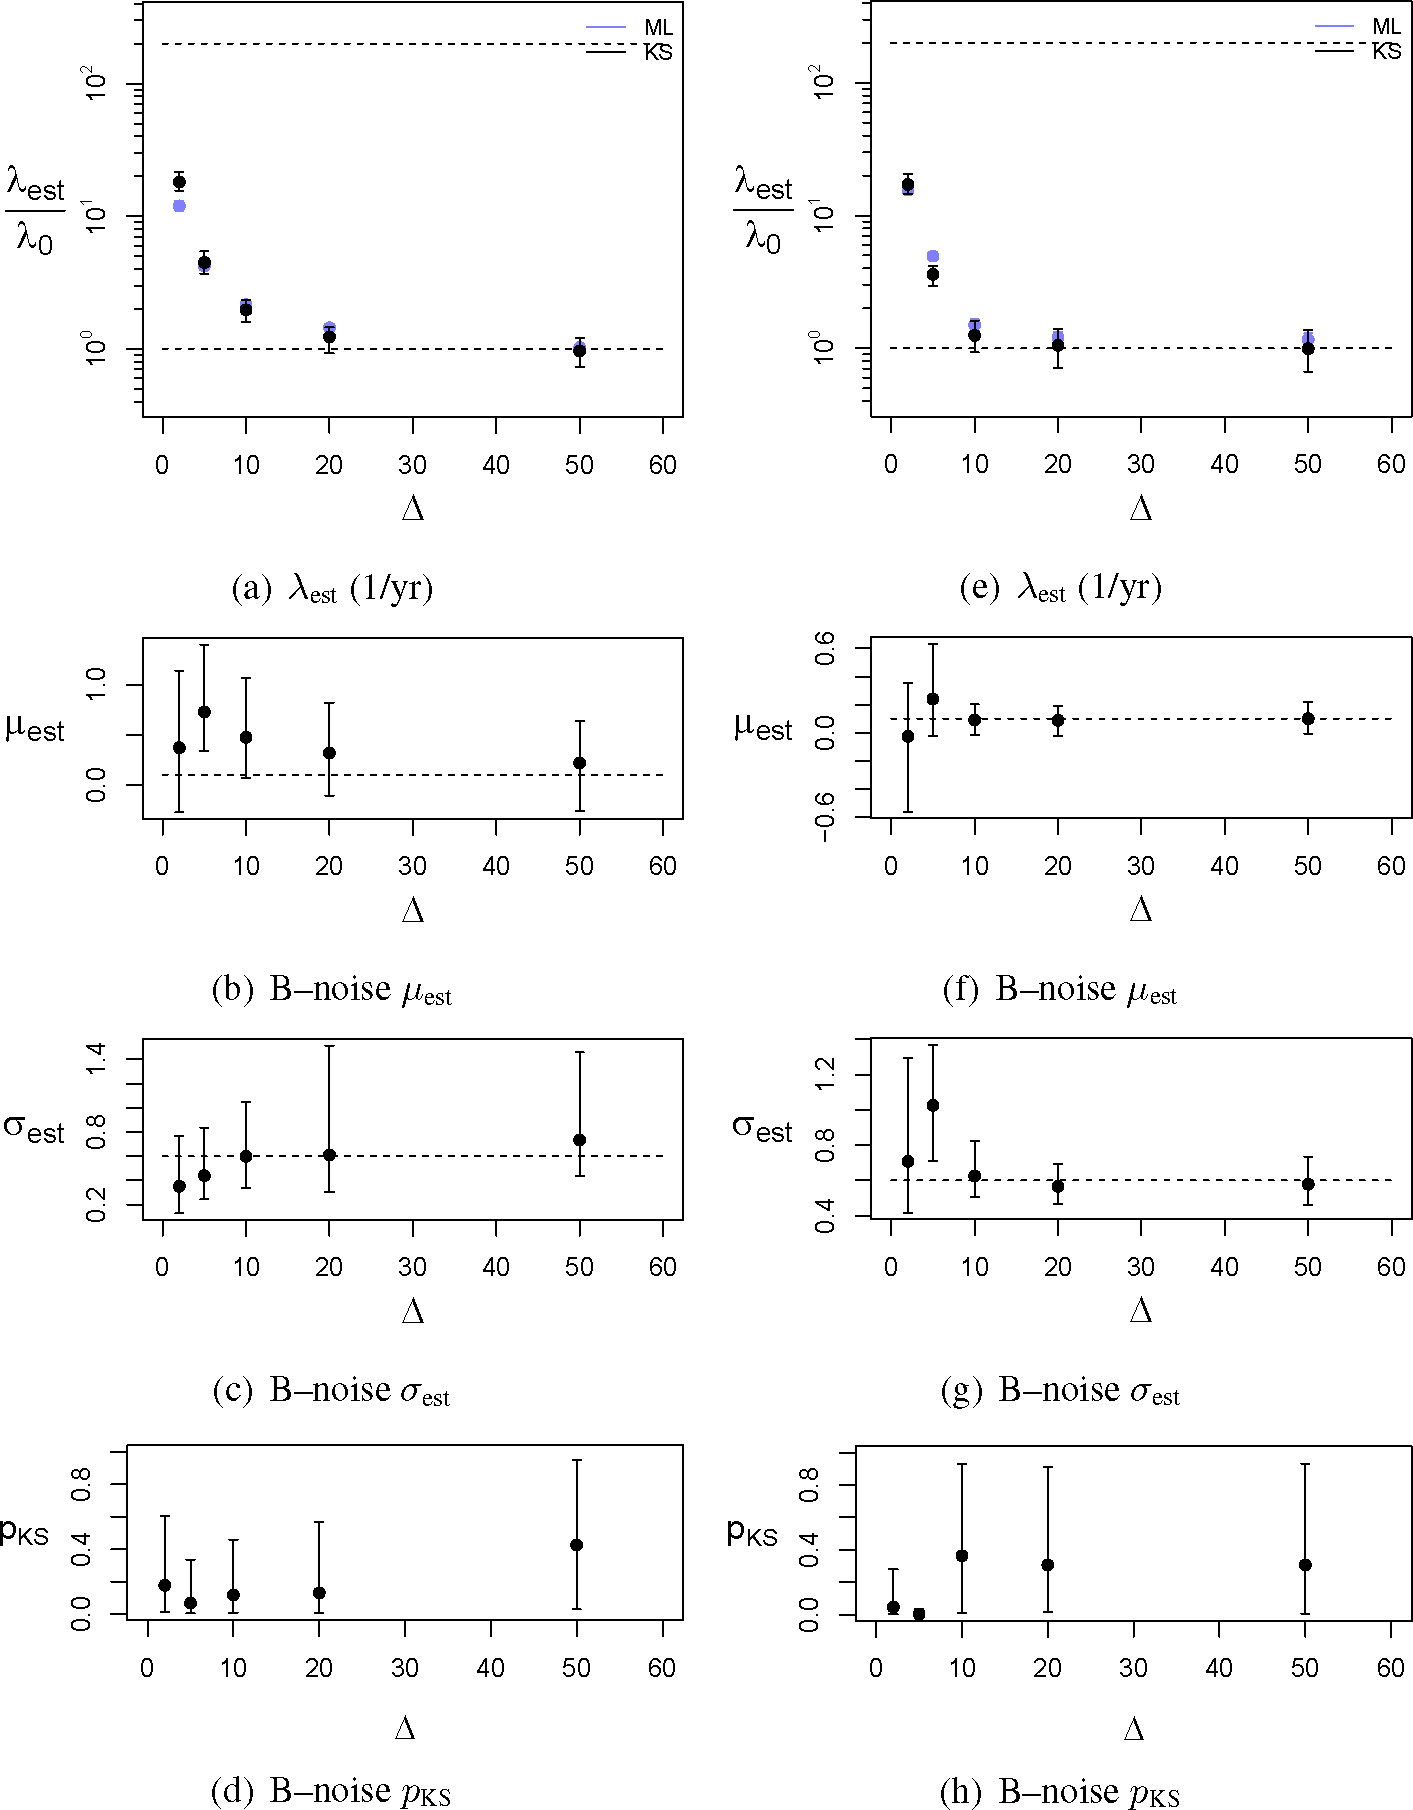
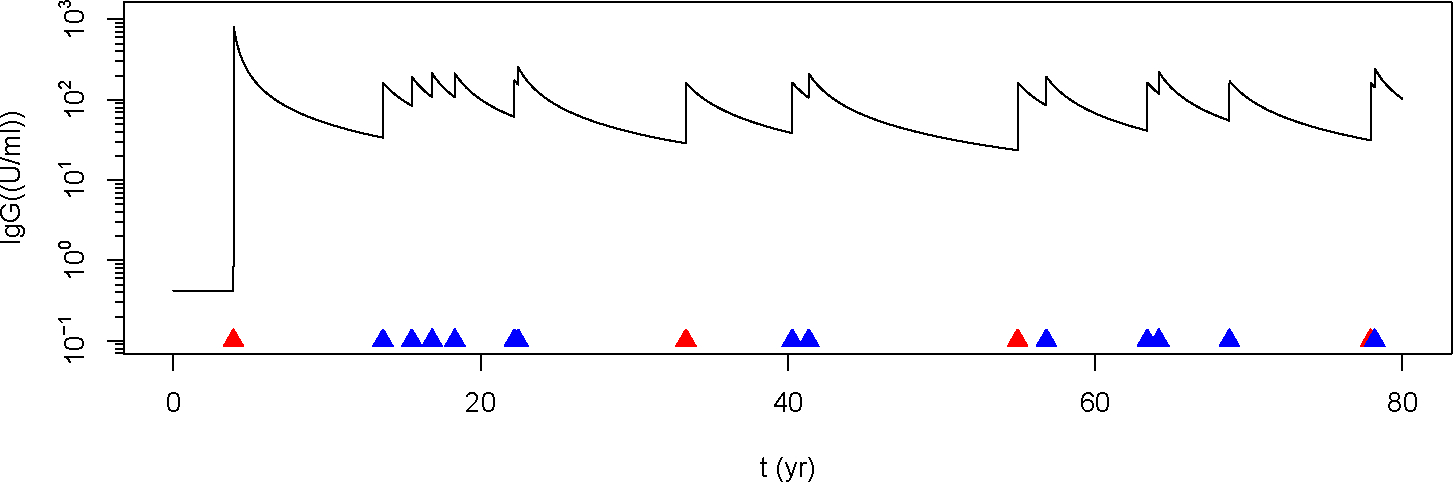
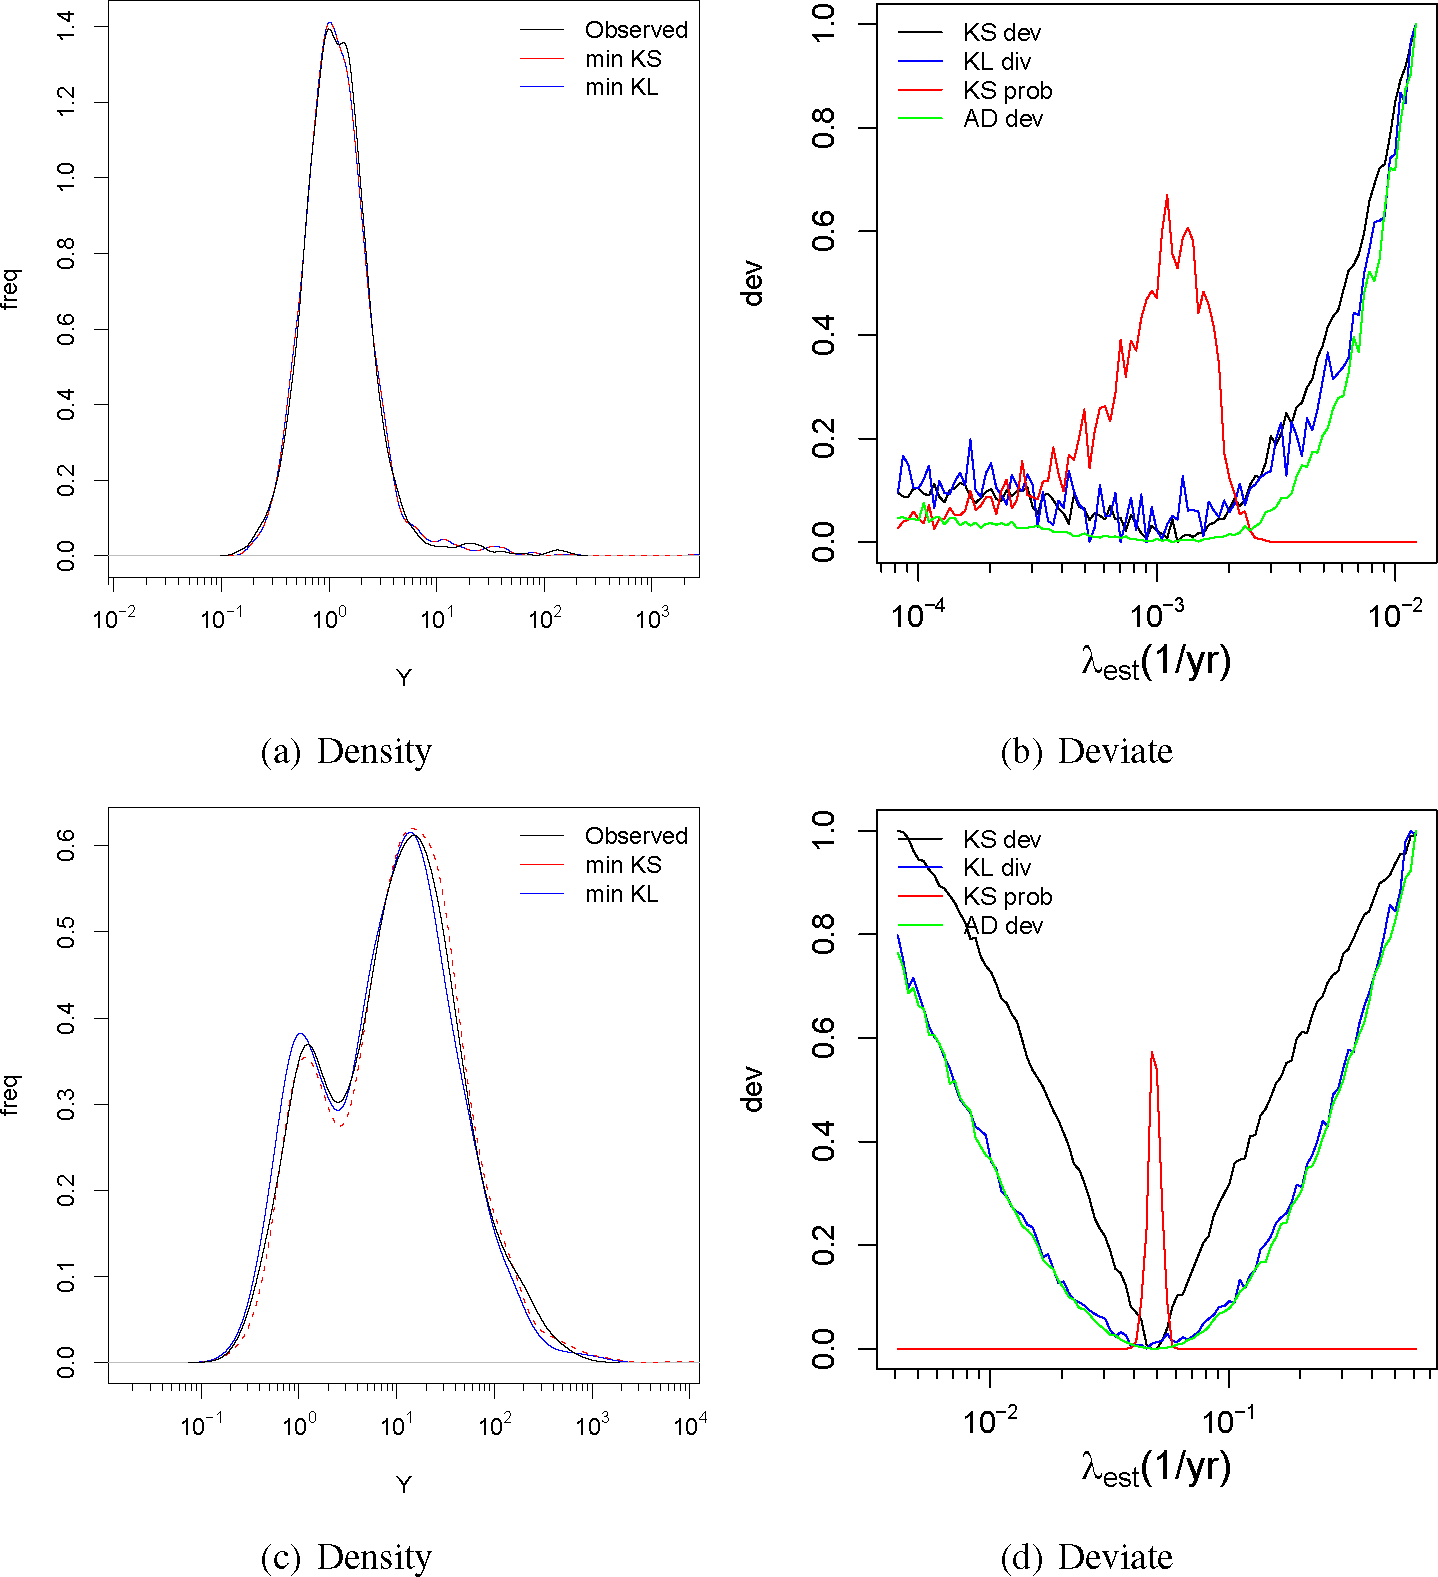
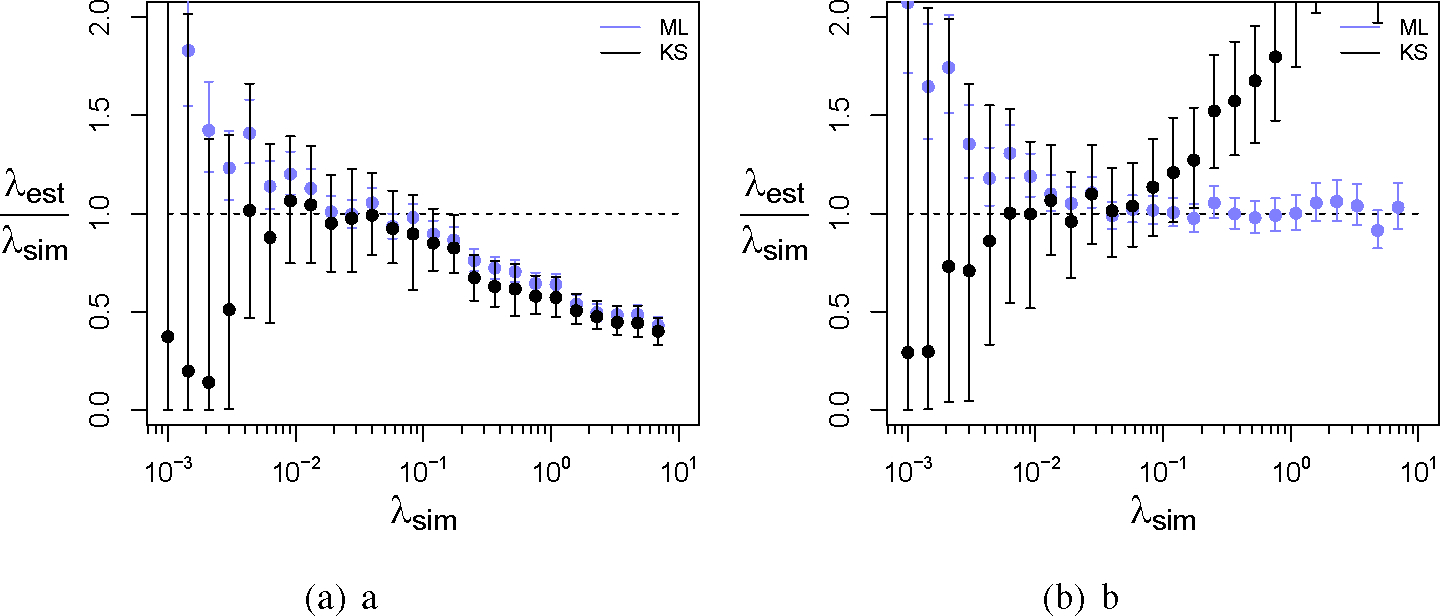
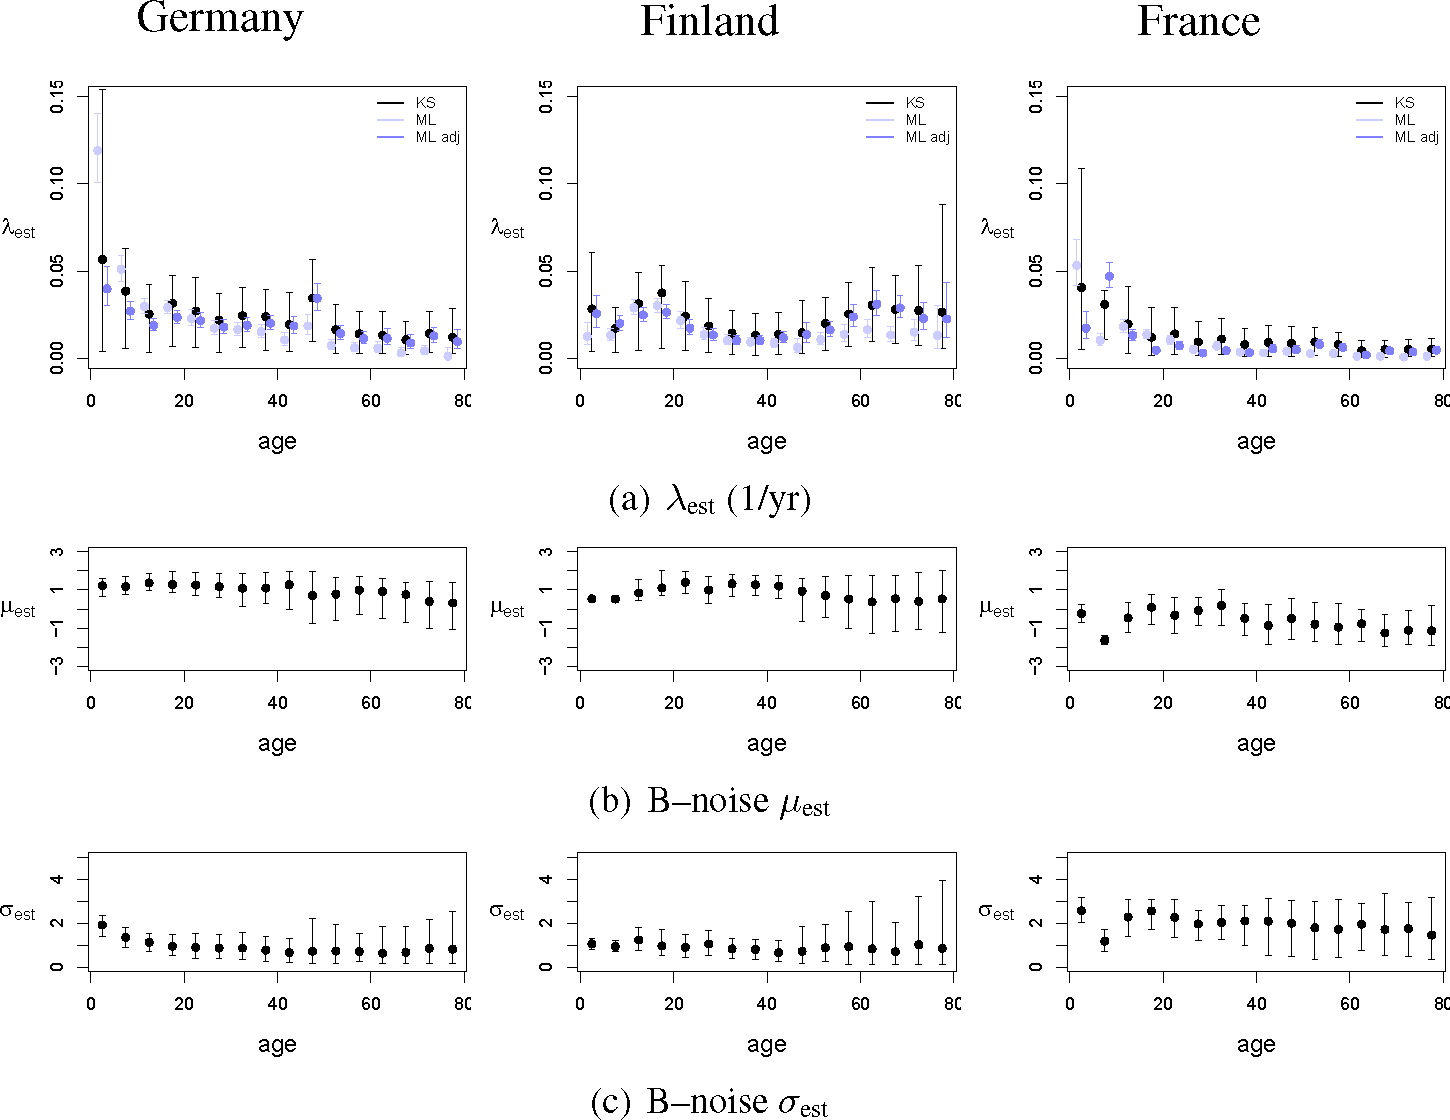
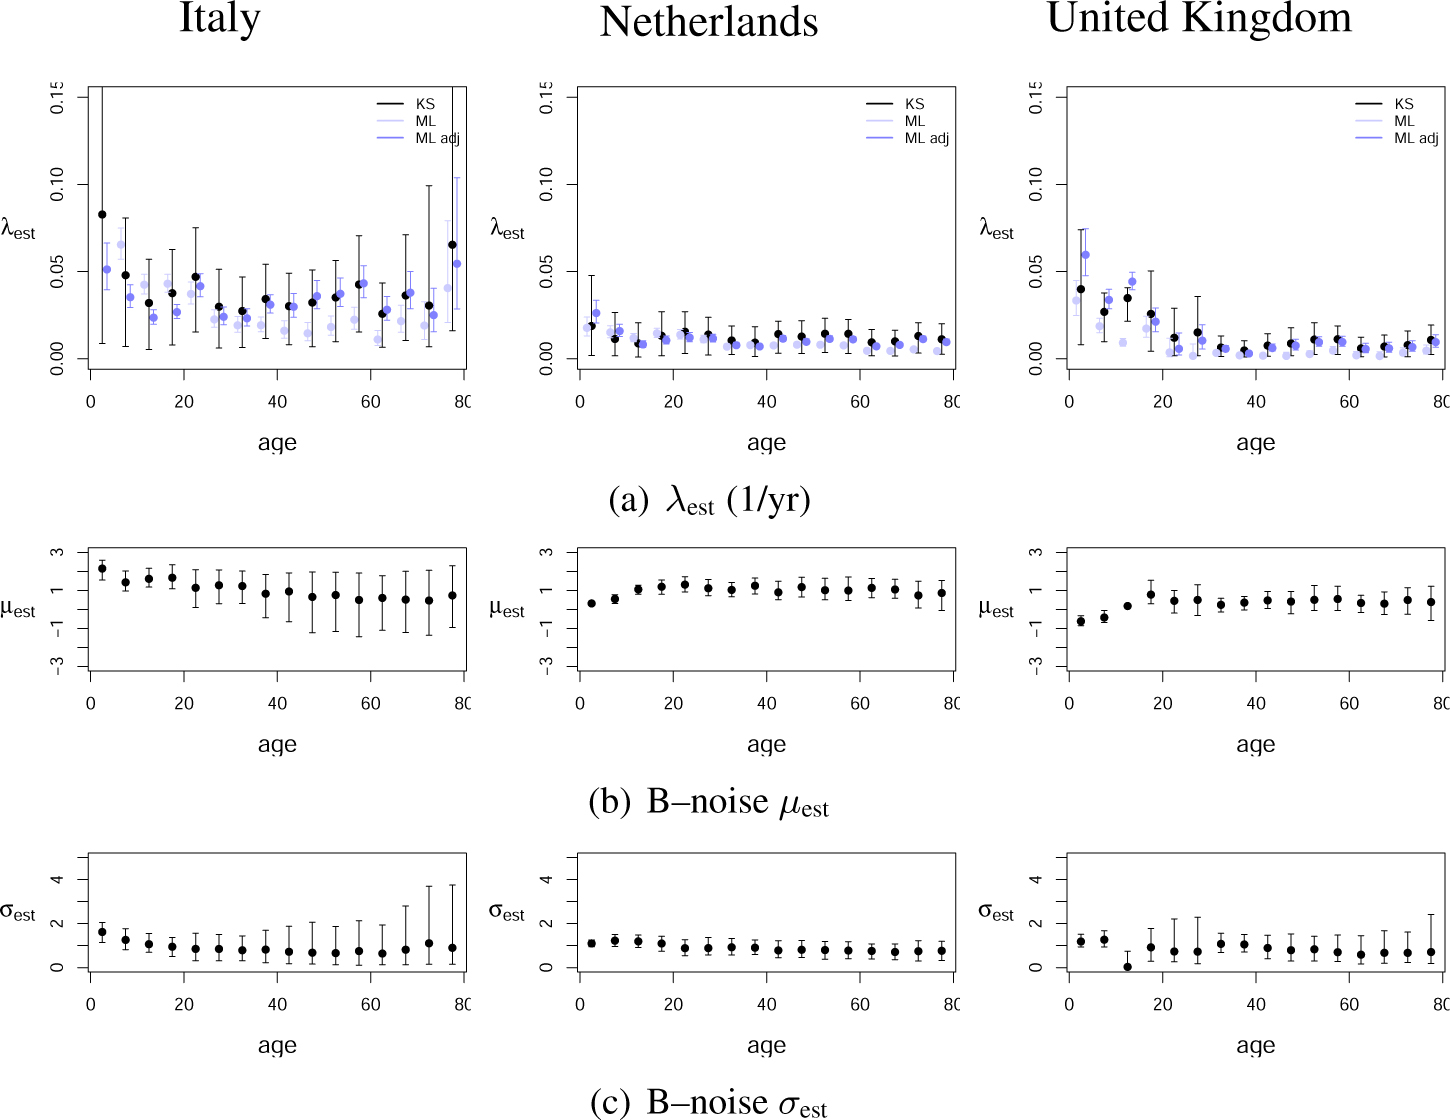
This study presents a novel approach for inferring the incidence of infections by employing a quantitative model of the serum antibody response. Current methodologies often overlook the cumulative effect of an individual's infection history, making it challenging to obtain a marginal distribution for antibody concentrations. Our proposed approach leverages approximate Bayesian computation to simulate cross-sectional antibody responses and compare these to observed data, factoring in the impact of repeated infections. We then assess the empirical distribution functions of the simulated and observed antibody data utilizing Kolmogorov deviance, thereby incorporating a goodness-of-fit check. This new method not only matches the computational efficiency of preceding likelihood-based analyses but also facilitates the joint estimation of antibody noise parameters. The results affirm that the predictions generated by our within-host model closely align with the observed distributions from cross-sectional samples of a well-characterized population. Our findings mirror those of likelihood-based methodologies in scenarios of low infection pressure, such as the transmission of pertussis in Europe. However, our simulations reveal that in settings of higher infection pressure, likelihood-based approaches tend to underestimate the force of infection. Thus, our novel methodology presents significant advancements in estimating infection incidence, thereby enhancing our understanding of disease dynamics in the field of epidemiology.

Keywords: approximate Bayesian computation; empirical distribution function; reinfection; seroincidence.


Figures

Fig. A1:
Fig. A1:
Predicted seroresponse for the longitudinal model fitted to pertussis antibody data.
Fig. A2:
Fig. A2:
Posterior predictive density estimates of the peak antibody level and the time to peak, calculated from the estimated parameters μ0,μ1,c* and y0.
Fig. A3:
Fig. A3:
(a) Relation between serum antibody baseline y0 and subsequent peak level y1=fy0. (b) Distribution of baseline threshold for a subsequent “small jump” in seroresponse.
Fig. A4:
Fig. A4:
Simulated seroresponse of a hypothetical subject, from birth to age 80 (years), infections occurring as a Poisson process with rate 0.2/yr (a,b) and 1/yr (c,d). Longitudinal parameters fitted to pertussis data (a,c): parameters and baseline chosen at random at each new infection. This corresponds with published analyses. (b,d): parameters μ0,μ1,c,α,r and baseline y0 chosen at birth and kept fixed. Baseline antibody level y0 for subsequent infections carried over from the prior episode. Triangles indicate symptomatic (“large jump”: red) or asymptomatic seroconversions (“small jump”: blue).
Fig. B1:
Fig. B1:
Prior (gray) and posterior (black) densities for simulated cross–sectional data. Estimated seroconversion rate λ, and the two noise parameters (μ,σ). (a), (b), (c): λsim=0.03(1/yr); (d), (e), (f): λsim=0.013(1/yr). The prior for log(λ) was N(log(0.1),5.0); for μ this was N(0.1,0.5) and for logσN(log(0.6),0.5).
Fig. B2:
Fig. B2:
Prior (gray) and posterior (black) densities for cross–sectional data from the Netherlands (ESEN study). Estimated seroconversion rate λ, and the two noise parameters (μ,σ). (a), (b), (c): ages 5 – 10yr; (d), (e), (f): ages 55 – 60 yr. The prior for log(λ) was N(log(1.0),2.0); for μ this was N(1.0,1.0) and for logσN(log(1.0),1.0).
Fig. B3:
Fig. B3:
Densities for population samples of data of the Netherlands from the ESEN study, and densities from samples fitted by matching EDFs.
Fig. B4:
Fig. B4:
ESEN data, (a) Estimated seroconversion rates λest by (5 yr) age categories. Two fitting methods are shown. ML: maximum likelihood seroincidence with B–noise fixed ν=3.0IU/ml. ML adj: maximum likelihood seroincidence with B–noise adjusted to the 95th percentile of the distribution estimated by EDF. KS: EDF method simulating vaccination at age 2, using pKS, fitted by ABC jointly estimating λ and the two noise parameters. (b) Estimated log mean μ of B–noise. (c) Estimated logsdσ of B–noise.
Fig. B5:
Fig. B5:
ESEN data, (a) Estimated seroconversion rates λest by (5 yr) age categories. Two fitting methods are shown. ML: maximum likelihood seroincidence with B–noise fixed ν=3.0IU/ml. ML adj: maximum likelihood seroincidence with B–noise adjusted to the 95th percentile of the distribution estimated by EDF. KS: EDF method simulating vaccination at age 2, using pKS, fitted by ABC jointly estimating λ and the two noise parameters. (b) Estimated log mean μ of B–noise. (c) Estimated logsdσ of B–noise.
Fig. B6:
Fig. B6:
Kolmogorov probabilities for EDFs of antibody samples generated from posterior parameter estimates in approximate Bayesian computation. Simulated cross–sectional data without (a) and with (b) vaccination at age 2. Observed cross–sectional population data for the Netherlands from the ESEN study for pertussis, analysed in 10 yr age categories, results in Figures 9 and B5.
Fig. B7:
Fig. B7:
(a) Variation in λ. A subject sampled at age 10 was exposed to an outbreak 5 years ago, causing λ to increase from a baseline 0.05 (1/yr) to a peak infection rate of 10 (1/yr). Duration of the outbreak was 465 days, approximately. (b) sample of intervals for this nonhomogeneous Poisson process (n=25).
Fig. B8:
Fig. B8:
Estimated λest and B–noise parameters μest,σest for an outbreak 2, 5, 10, 20 and 50 years ago (Δ) at time of sampling, for subjects aged 0 – 80 years (a – d) or 0 – 10 years (e–h) (uniform age distributions). Baseline infection rate λ0=0.05(1/yr), during the outbreak a peak rate of λ1=10(1/yr) is reached. Simulated B–noise distribution parameters: μsim,σsim=(0.1,0.6). ML: maximum likelihood estimation; KS: EDF based method. Note how recent changes in λ cause decreased pKS(d,h).
Figure 1:
Figure 1:
Simulated seroresponse of a hypothetical subject, from birth to age 80 (years), infections occurring as a Poisson process with rate 0.2/yr. Longitudinal parameters fitted to pertussis data: (μ0,μ1,c,α,r chosen at birth and kept fixed. The baseline antibody level y0 is low at birth. After the first infection y0 is carried over from each prior episode for any further infections. Triangles indicate symptomatic (“large jump”: red) or asymptomatic seroconversions (“small jump”: blue).
Figure 2:
Figure 2:
Fitting λ: output for simulated data for subjects 0–80 yrs of age with baseline distribution parameters: (0.1, 0.6) and seroconversion rate λsim=0.001 and 0.05 (1/yr). (a) Probability density of (simulated) observed serum antibody distribution and best fitting (minimum DKS or DKL) simulated distributions. (b) Scaled deviates as a function λest of the simulated sample of antibody concentrations. (c) and (d): corresponding KS dev (Kolmogorov–Smirnov deviate DKS); KL div (Kullback–Leibler divergence DKL); AD dev (Anderson–Darling deviate A2); KS prob (Kolmogorov probability pKS as a function of λ.
Figure 3:
Figure 3:
Fitting B–noise distribution parameters: output for simulated data for subjects 0 – 80yrs of age with baseline distribution parameters: (0.1, 0.6) and seroconversion rate λsim=0.001 and 0.05 (1/yr). (a) Scaled deviates as a function of the B–noise log mean μest at λsim=0.001(1/yr). (b) Scaled deviates as a function of the B–noise logsdσest at λsim=0.001(1/yr). (c) and (d) Same at λsim=0.05(1/yr). KS dev: Kolmogorov–Smirnov deviate DKS; KL div: Kullback–Leibler divergence DKL; AD dev: Anderson–Darling deviate A2; KS prob: Kolmogorov probability pKS.
Figure 4:
Figure 4:
Estimated λest and B–noise parameters μest,σest for a range of simulated λsim ranging from 0.001 to 10 (1/yr) in subjects 0 – 80yrs of age and B–noise distribution parameters: μsim,σsim=(0.1,0.6). Baseline y0=ytinf from previous infections, generating seroresponses as in Figure 1. (a) Two methods for estimation of λ are compared: ML: maximum likelihood using the published seroincidence method with fixed B–noise parameter adjusted to the 95 th percentile of simulated noise (ν=2.97IU/ml), and KS : EDF based method using pKS to jointly estimate (λ,μ,σ). (b) B–noise log mean μest and (c) logsdσest, estimated jointly with λest using ABC. Dashed lines indicate simulated values: λest=λsim, μest=μsim=0.1, σest=σsim=0.6.
Figure 5:
Figure 5:
Bias in λest due to baseline “memory”. (a) Simulated cross–sectional sample generated with y0=ytinf; λest calculated by ML and EDF fitting (KS) with fixed baseline y0=y(0) and instantaneous seroconversion t1=0. (b) Simulated cross–sectional sample generated with fixed y0=y(0) and instantaneous seroconversion t1=0;λest calculated by ML and EDF fitting (KS) with infection history y0=ytinf and seroconversion t1>0.
Figure 6:
Figure 6:
Estimated λest and B–noise parameters μest,σest for a simulated population vaccinated at age 2. a–c: λest and B–noise parameters μest,σest estimated using a model including vaccination (KS). d–f: same parameters estimated using a model without vaccination at age 2 (KS). For comparison, likelihood based estimated are also shown (ML).
Figure 7:
Figure 7:
ESEN data from the Netherlands: estimates of λ and probability density of antibody levels. Age 35–40 yr (a): DKS (KS dev) and associated probability pKS (KS prob) as a function of λest. Also shown DKL (KL div) and Anderson–Darling A2 (AD dev). (b): probability densities of observed antibody levels and minimum DKS (maximum pKS) sample, and minimum DKL sample.
Figure 8:
Figure 8:
ESEN data, (a) Estimated seroconversion rates λest by (5yr) age categories. Two fitting methods are shown. ML: maximum likelihood seroincidence with B–noise fixed ν=3.0IU/ml. ML adj: maximum likelihood seroincidence with B–noise adjusted to the 95th percentile of the distribution estimated by EDF. KS: EDF method using pKS, fitted by ABC jointly estimating λ and the two noise parameters. (b) Estimated log mean μ of B–noise. (c) Estimated logsdσ of B–noise.
Figure 9:
Figure 9:
ESEN data, (a) Estimated seroconversion rates λest by (5 yr) age categories. Two fitting methods are shown. ML: maximum likelihood seroincidence with B–noise fixed ν=3.0IU/ml. ML adj: maximum likelihood seroincidence with B–noise adjusted to the 95th percentile of the distribution estimated by EDF. KS: EDF method using pKS, fitted by ABC jointly estimating λ and the two noise parameters. (b) Estimated log mean μ of B–noise. (c) Estimated logsdσ of B–noise.

Similar articles

Cited by

References

    1. de Greeff SC, Teunis P, de Melker HE, et al. Two-component cluster analysis of a large serodiagnostic database for specificity of increases of IgG antibodies against pertussis toxin in paired serum samples and of absolute values in single serum samples. Clinical and Vaccine Immunology 2012;19(9):1452–1456. doi:10.1128/CVI.00229-12. - DOI - PMC - PubMed
    1. Konda T, Kamachi K, Iwaki M, Matsunaga Y. Distribution of pertussis antibodies among different age groups in Japan. Vaccine 2002;20:1711–1717. - PubMed
    1. Nardone A, Pebody RG, Maple PAC, Andrews N, Gay NJ, Miller E. Sero-epidemiology of Bordetella pertussis infections in England and Wales. Vaccine 2004;22(9–10):1314–1319. doi:10.1016/j.vaccine.2003.08.039. - DOI - PubMed
    1. Peasey AE, Ruiz-Palacios GM, Quigley M, et al. Seroepidemiology and risk factors for sporadic norovirus/Mexico strain. Journal of Infectious Diseases 2004;189(11):2027–2036. - PubMed
    1. Teunis PFM, van Eijkeren JCH, Ang CW, et al. Biomarker dynamics: estimating infection rates from serological data. Statistics in Medicine 2012;31(20):2240–2248. doi:10.1002/sim.5322. - DOI - PubMed