. 2023 Dec;35(51):e2304654.
doi: 10.1002/adma.202304654. Epub 2023 Oct 27.

Brain-Targeted Liposomes Loaded with Monoclonal Antibodies Reduce Alpha-Synuclein Aggregation and Improve Behavioral Symptoms in Parkinson's Disease

Affiliations

Brain-Targeted Liposomes Loaded with Monoclonal Antibodies Reduce Alpha-Synuclein Aggregation and Improve Behavioral Symptoms in Parkinson's Disease

Mor Sela et al. Adv Mater. 2023 Dec.

Abstract

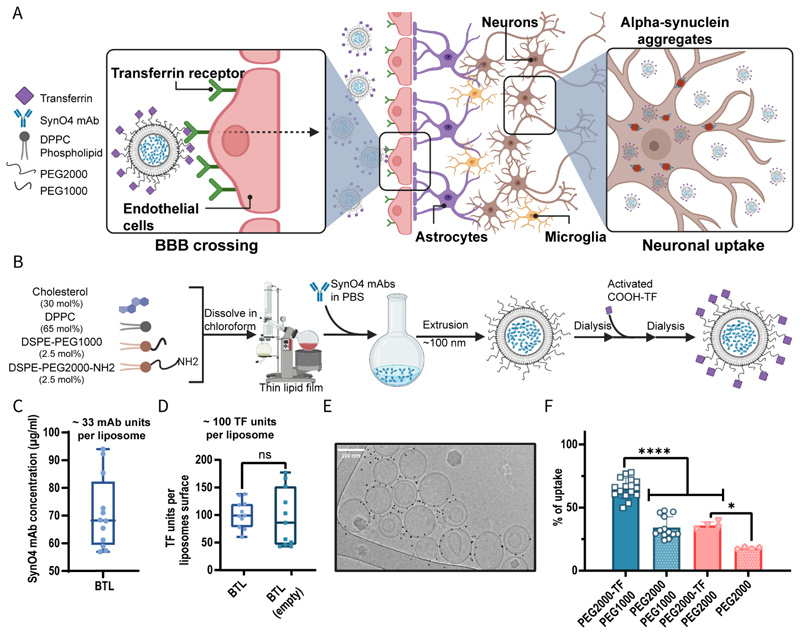
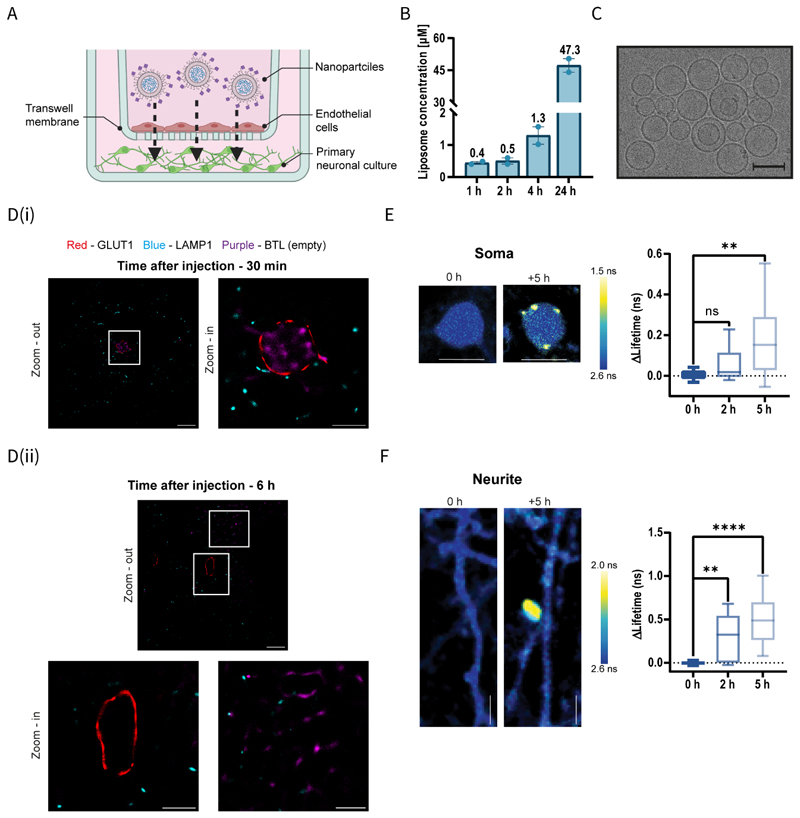
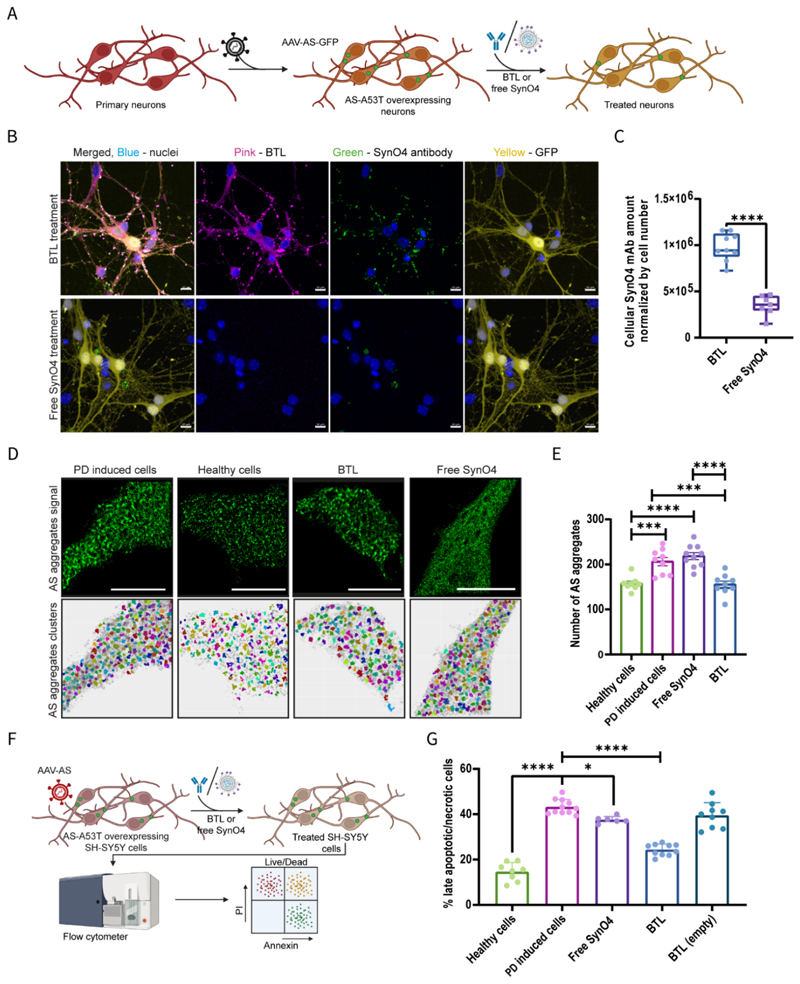
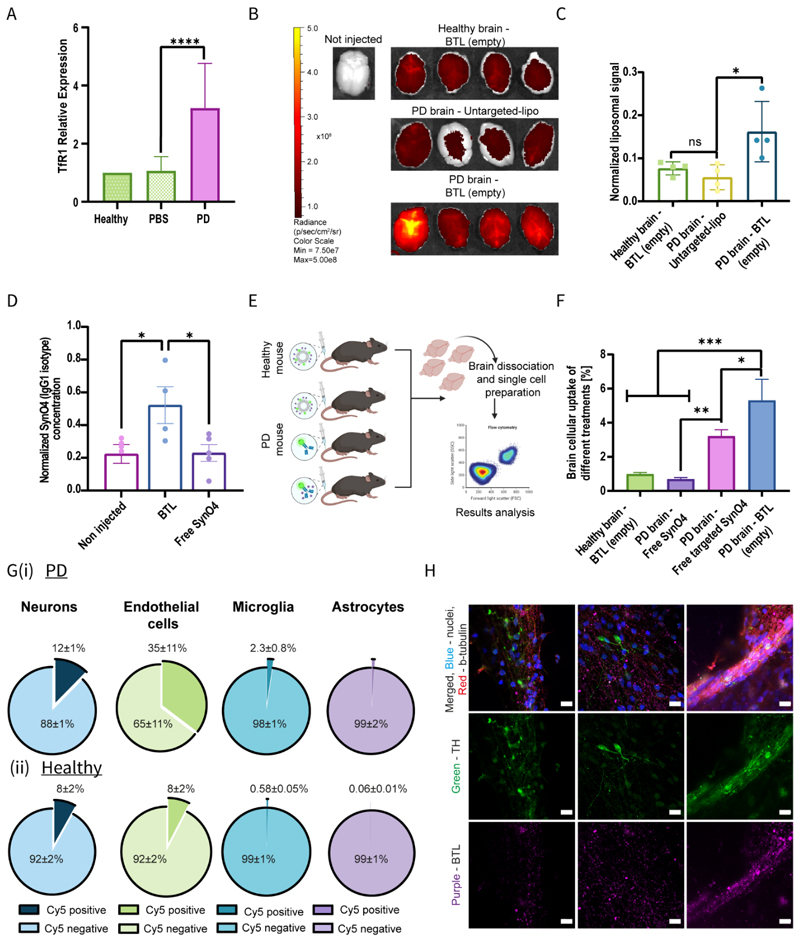
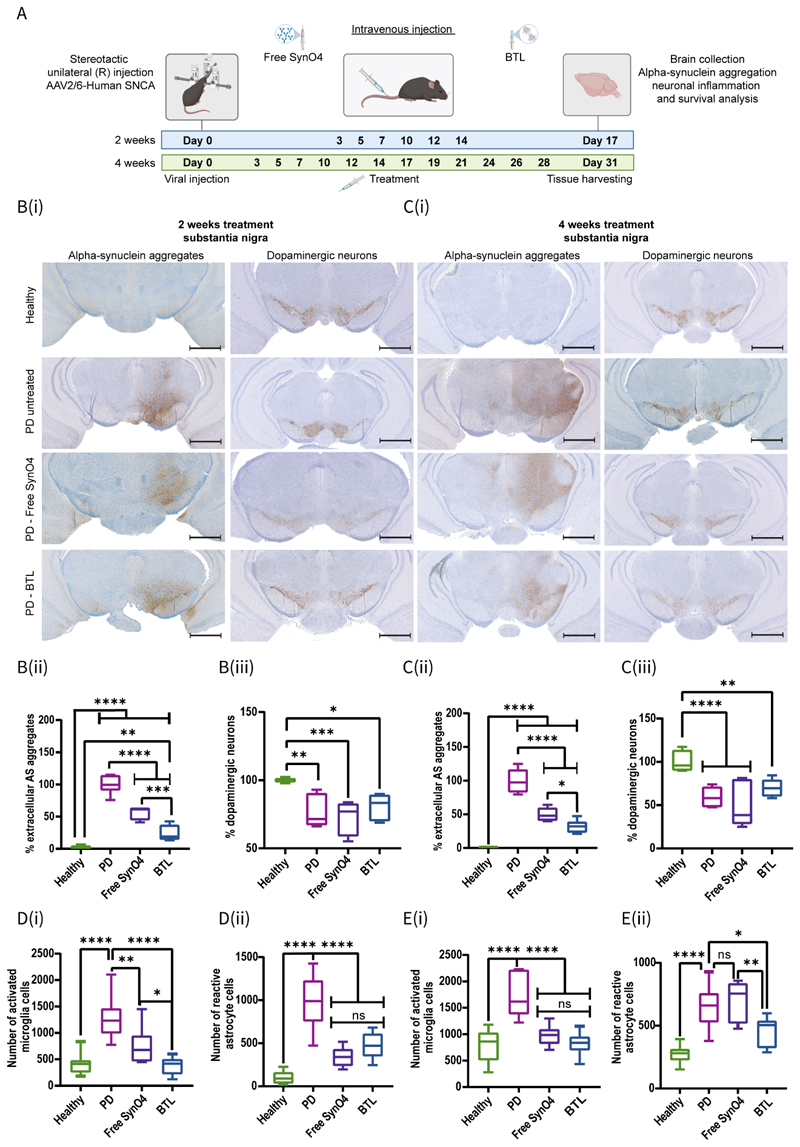
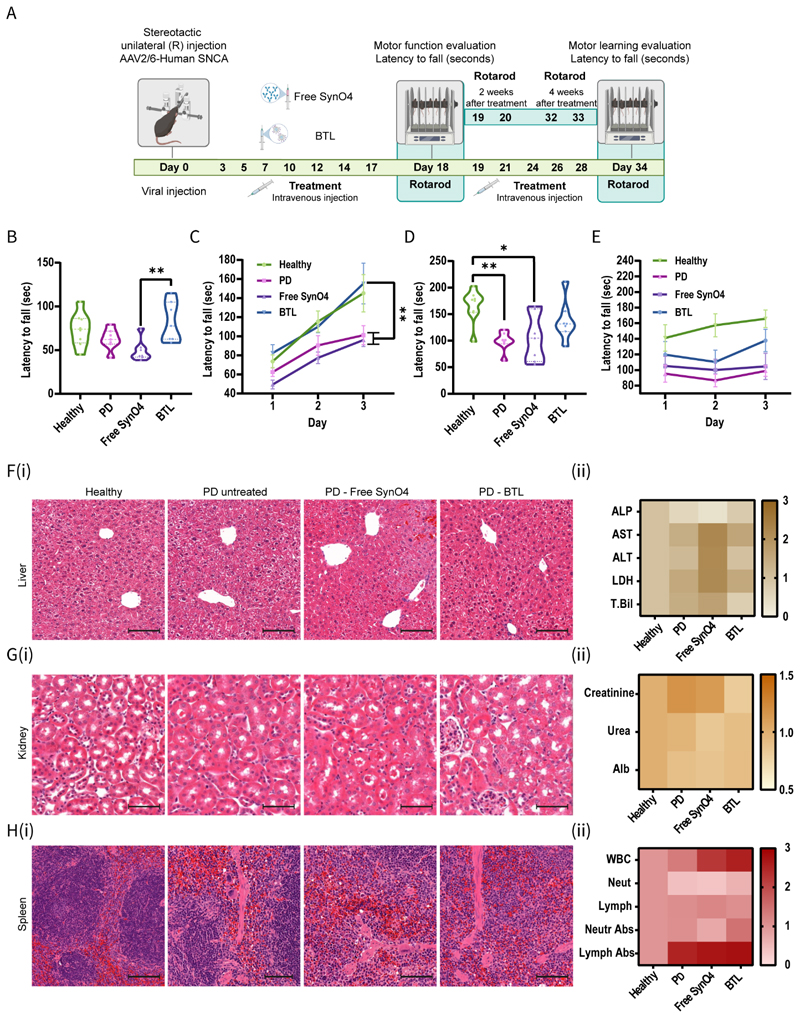
Monoclonal antibodies (mAbs) hold promise in treating Parkinson's disease (PD), although poor delivery to the brain hinders their therapeutic application. In the current study, it is demonstrated that brain-targeted liposomes (BTL) enhance the delivery of mAbs across the blood-brain-barrier (BBB) and into neurons, thereby allowing the intracellular and extracellular treatment of the PD brain. BTL are decorated with transferrin to improve brain targeting through overexpressed transferrin-receptors on the BBB during PD. BTL are loaded with SynO4, a mAb that inhibits alpha-synuclein (AS) aggregation, a pathological hallmark of PD. It is shown that 100-nm BTL cross human BBB models intact and are taken up by primary neurons. Within neurons, SynO4 is released from the nanoparticles and bound to its target, thereby reducing AS aggregation, and enhancing neuronal viability. In vivo, intravenous BTL administration results in a sevenfold increase in mAbs in brain cells, decreasing AS aggregation and neuroinflammation. Treatment with BTL also improve behavioral motor function and learning ability in mice, with a favorable safety profile. Accordingly, targeted nanotechnologies offer a valuable platform for drug delivery to treat brain neurodegeneration.

Keywords: Parkinson's disease; brain targeting; central nervous system; lipid nanoparticles; neuroinflammation.


Conflict of interest statement

Competing interests

The authors declare that they have no competing interests.

Figures

None
Synthesizing brain-targeted liposomes loaded with SynO4 mAb.
(A). Schematic illustration of the therapeutic mode of action. Through receptor-mediated transcytosis, liposomes carrying SynO4 mAbs cross the BBB and are taken up by damaged neuronal cells; the mAbs are then released and target AS aggregates, thereby preventing neuronal cell death. (B). Schematic diagram of BTL synthesis. (C). Quantification of the encapsulated SynO4 mAb concentration in BTL using ELISA. (D). Evaluation of the number of transferrin units per liposome surface using the BCA protein assay. (E). Cryogenic transmission electron microscopy (cryo-TEM) of gold nanoparticles (GNPs) linked to BTL (empty) (scale bar: 100 nm). (F). In-vitro cellular uptake of targeted PEGylated liposomes in hCMEC/D3 cells; the uptake efficiency of each liposomal formulation was assessed by FACS analysis. The results of C and D (at least 12 independent repetitions) and F (at least 4 independent repetitions performed in three replicates) are presented as mean± standard deviation (SD). Two-tailed unpaired Student's t-test was used for the statistical analysis of D, and One-way ANOVA was used for the statistical analysis of F, with multiple comparisons test adjusted p-value; *p=0.0111, ****p<0.0001. AS, alpha-synuclein; BBB, blood-brain barrier; BTL, brain-targeted liposomes; DPPC, 1,2-dipalmitoyl-sn-glycerol-3-phosphocholine; ELISA, enzyme-linked immunosorbent assay; FACS, fluorescence-activated cell sorting; mAb, monoclonal antibody; NPs, nanoparticles; PBS, phosphate-buffered saline; PEG, polyethylene glycol; TF, transferrin.
None
BTL cross the BBB.
(A). Schematic diagram illustrating the penetration of BTL (empty) across an in-vitro BBB model comprising a co-culture of BMECs atop primary neurons placed in a noncontact manner in a Transwell. (B). Liposome concentration in neurons of the BBB model over time following application of Cy5-labeled BTL (empty) to the monolayer of BMECs, as determined by fluorescent measurement. The particle concentration increases over time, reaching 47.3±3.2 µg/ml after 24 h. (C). A Cryo-TEM image showing that liposomes remain intact after crossing the BBB (scale bar: 100 nm). (D). Tissue dSTORM images showing BTL crossing the BBB: (i) short time after injection and (ii) long time after injection. The liposomes were labeled with AZDye 647 (purple), capillaries were labeled with Alexa Fluor 488 (GLUT1; red), and lysosome molecules were labeled with CF568 (LAMP1; blue) (scale bars: zoom-out images 5 µm, zoom-in images 2 µm). Representative 2pFLIM pseudo-colored images and comparison analysis of the alteration in fluorescence lifetime of (E) soma and (F) neurite processes 0, 2, and +5 h after BTL injection, respectively. The liposomes were labeled with Cy3 (lower lifetime, yellow), and cells were labeled with GFP (higher lifetime, blue) (scale bars: soma images 10 µm, neurite images 5 µm). The results of B (1 independent repetition performed in 2 replicates), E (13–29 independent repetitions performed), and F (11–26 independent repetitions performed) are presented as mean±standard deviation (SD). One-way ANOVA with an adjusted p-value in multiple comparison tests was used for the statistical analysis; **p≤0.0012, ****p<0.0001. AS, alpha-synuclein; BBB, blood-brain barrier; BMECs, brain microvascular endothelial cells; BTL, brain-targeted liposomes; mAb, monoclonal antibody; Cryo-TEM, cryogenic transmission electron microscopy; GLUT1, glucose transport protein type 1; LAMP1, lysosome-associated membrane protein 1.
None
BTL are taken up by PD neurons and induce a therapeutic effect.
(A). Schematic diagram illustrating the process of infecting PD primary neuronal cells with a viral vector overexpressing A535 alpha-synuclein, followed by treatment with BTL or free SynO4 mAbs. (B). Confocal images showing the uptake of BTL or free SynO4 mAbs in infected PD neurons after overnight incubation. Liposomes were labeled with Cy5 (pink), the antibody was labeled with Cy3 (green), and PD primary neuron cells were labeled with GFP (yellow) (scale bar: 10 µm). (C). Analysis of the cellular SynO4 mAb amount normalized to cell number by IMARIS imaging software. (D). dSTORM images of PD-infected neurons treated overnight with BTL or free SynO4 mAbs; neurons were marked with GFP (green) (scale bar: 9 µm). (E). Analysis of the number of AS aggregates using the HDCSCAN algorithm. (F). Schematic diagram illustrating PD-SH-SY5Y cells infected with a viral vector overexpressing A535 alpha-synuclein, followed by treatment with BTL or with free SynO4 mAbs and labeled with Annexin and PI dyes for a live/dead cell viability assay. (G). Quantification of the percentage of late apoptotic/necrotic cells following the five different treatments using FACS analysis. The results of C (3 independent repetitions performed; at least 6 images and at least 60 cells per image) and E and G (3 independent repetitions performed in at least 8 replicates each) are presented as mean±standard deviation (SD). One-way ANOVA with an adjusted p-value in multiple comparison tests was used for the statistical analysis; *p=0.0346, ***p=0.0003, ****p<0.0001. AAV, adeno-associated virus; AS, alpha-synuclein; BTL, brain-targeted liposomes; FACS, fluorescence-activated cell sorting; mAb, monoclonal antibody; PD, Parkinson’s disease.
None
BTL cross the BBB and significantly accumulate in PD mice brains.
(A). RT-qPCR analysis of TfR1 expression in the PD brain; TfR1 expression levels were normalized to those of the healthy group and were obtained according to the 2^(-∆∆Ct) method. (B-C). Nanoparticle biodistribution in the brains of PD-induced and healthy mice 12 h post-administration of Cy5-labeled BTL (empty) or Cy5-labeled untargeted liposomes, analyzed using an in-vivo imaging system (IVIS) (B) and quantified by IVIS software analysis (C). (D). Levels of the IgG1 isotype (SynO4 isotype) in PD brains following liposome delivery or antibody delivery, as determined using ELISA. (E). Schematic diagram illustrating the flow cytometry setup experiment. (F). The levels of BTL (empty), transferrin-SynO4 mAb, and free SynO4 mAb in PD brain cells and those of BTL in healthy brains were determined using flow cytometry. (G). Quantification of BTL cellular uptake in neurons, endothelial cells, microglia, and astrocytes in (i) PD brains and (ii) healthy brains. (H). Confocal imaging of BTL cellular uptake in human PD dopaminergic neurons. The liposomes were labeled with Cy5 (purple), and cells were stained with tyrosine hydroxylase (TH, green), b-tubulin (red), and nuclei (blue) (scale bar: 10 um). Results of A, C, and E (5 independent repetitions) and D and F (4 independent repetitions) are presented as mean±standard deviation (SD). One-way ANOVA with an adjusted p-value in multiple comparison tests was used for statistical analysis in A, C, D, and F; *p≤0.1061, **p≤0.0065, ***p≤0.0002, ****p<0.0001. BBB, blood-brain barrier; BTL, brain-targeted liposomes; PD, Parkinson’s disease. RT-qPCR, reverse transcription-quantitative PCR; TfR1, transferrin receptor.
None
BTL reduce AS aggregation and neuroinflammation in the AAV-based PD mice model.
(A). A schematic diagram illustrating the experiment to assess therapeutic efficacy: Healthy mice received unilateral AAV injection encoding human AS into the right hemisphere of the brain. Mice were injected every other day with the different treatments, i.e., free SynO4 mAbs or BTL, for two or four weeks. In the final stage, the brains were harvested, sectioned, and stained for biochemical and histological analysis and compared with the untreated PD group and healthy group (B(i), C(i)). Representative histological images of sections of the substantia nigra area after (B(i)) two weeks and (B(ii)) four weeks of treatment. Sections were stained against aggregated AS and dopaminergic neurons (scale bar: 2000 µm). (B(ii), C(ii)). The percentage of aggregated AS after (B(ii)) two weeks and (C(ii)) four weeks of different treatments. (B(iii), C(iii)). The percentage of dopaminergic neuron survival after (B(iii)) two weeks and (C(iii)) four weeks of different treatments. The healthy group values were normalized to 100%, and the values of other groups were normalized to the mean value of the healthy group. (D(i), E(i)). The number of activated microglia cells (D(i)) after two weeks and (E(i)) four weeks of different treatments; the sections were stained with an antibody against the Iba1 marker. (D(ii), E(ii)). The number of reactive astrocyte cells (D(ii)) after two weeks and (E(ii)) four weeks of different treatments; the sections were stained with an antibody against the GFAP marker. The results of B(ii), B(iii), D(i), D(ii), and E(ii) (3–4 independent repetitions in 1–3 technical replicates), C(ii) and E(i) (4–5 independent repetitions in 1–3 technical replicates) and C(iii) (3–5 independent repetitions in 1–3 technical replicates) are presented as mean±standard deviation (SD). One-way ANOVA was used for the statistical analysis in B, C, D, and E; *p≤0.0370, **p≤0.0072, ***p≤ 0.0004, ****p< 0.0001. AAV, adeno-associated virus; AS, alpha-synuclein; BTL, brain-targeted liposomes; mAbs, monoclonal antibodies; PD, Parkinson’s disease.
None
The capacity of BTL to prevent disease progression in a viral PD mice model.
(A). Schematic diagram illustrating the behavioral therapeutic efficacy experiment: Healthy mice received a unilateral AAV injection encoding human AS. Then, the mice were injected every other day with either free SynO4 or BTL for 2 or 4 weeks. At the end of the treatment period, mice were measured on three consecutive days in an accelerating speed rotarod to detect coordination and balance functions. (B). Motor functioning capacity on the first day of rotarod evaluation after treatment for two weeks. (C). Short-term motor learning capability after treatment for two weeks. (D). Motor functioning capacity on the last day (day 3) of rotarod evaluation after treatment for four weeks. (E). Long-term motor learning after treatment for four weeks. Histological organ sections (F(i)) liver, (G(i)) kidney, and (H(i)) spleen on day 40 of the experiment. Sections were stained with hematoxylin and eosin to identify the cell structure. No differences in cell structure can be observed between healthy and BTL-treated groups in all the evaluated organs (scale bar: 100 µm). (F(ii)). Hepatotoxicity test of blood on day 40 of the experiment. Hepatic enzymes, including alkaline phosphatase (ALP), aspartate transaminase (AST), alanine transaminase (ALT), lactate dehydrogenase (LDH), and total bilirubin (T.Bill), were measured. No differences can be observed between the healthy and BTL-treated groups. The presence of free Syno4 results in increased levels of hepatic enzymes and bilirubin, indicating liver damage. (G(ii)). Assessment of nephrotoxicity using blood collected on day 40 of the experiment. Creatinine, urea, and albumin levels were measured. No differences can be observed between the healthy and BTL-treated groups. (H(ii)). Assessment of white blood cell count (WBC) using blood sample collected on day 40 of the experiment. No differences can be observed between the healthy and BTL-treated groups. All values are normalized to the values of the healthy group. Neut- Neutrophils, Lymph- Lymphocytes. The results of B and D (7–8 independent repetitions) are presented as mean±standard deviation (SD). One-way ANOVA was used for statistical analysis; *p≤0.0109 **p≤0.0049. Results of C and E (7–8 independent repetitions) are presented as mean±SD. Two-way ANOVA was used for statistical analysis; *p≤0.0106 **p≤0.0075. The results of F(i), G(i) and H(i) are representative sections of three independent repetitions performed in 1–3 technical replicates. The results of F(ii), G(ii) and H(ii) (three independent repetitions performed in 5 technical replicates) are presented in heat maps. AAV, adeno-associated virus; AS, alpha-synuclein; BTL, brain-targeted liposomes; PD, Parkinson’s disease.

References

    1. Forno LS. Progress in Parkinson Research. Springer; 1988.
    1. Surmeier DJ. The Lancet Neurology. 2007;6:933. - PubMed
    1. Poewe W, Seppi K, Tanner CM, Halliday GM, Brundin P, Volkmann J, Schrag A-E, Lang AE. Nature Reviews Disease Primers. 2017;3:1. - PubMed
    1. Kam T-I, Hinkle JT, Dawson TM, Dawson VL. Neurobiology of Disease. 2020;144:105028. - PMC - PubMed
    1. De Lau LM, Breteler MM. The Lancet Neurology. 2006;5:525. - PubMed

LinkOut - more resources