Review
. 2023 Sep 1;13(9):866.
doi: 10.3390/bios13090866.

Post-Assay Chemical Enhancement for Highly Sensitive Lateral Flow Immunoassays: A Critical Review

Affiliations
Review

Post-Assay Chemical Enhancement for Highly Sensitive Lateral Flow Immunoassays: A Critical Review

Vasily G Panferov et al. Biosensors (Basel). .

Abstract

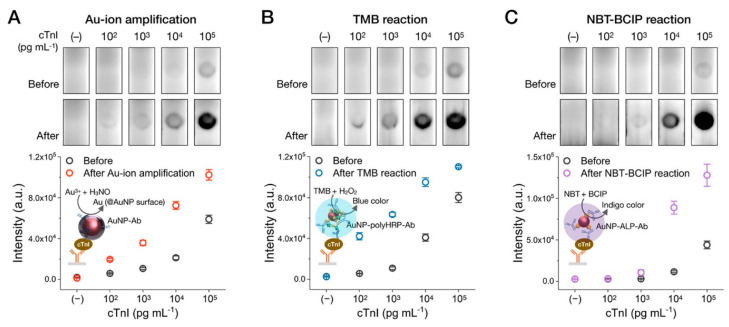
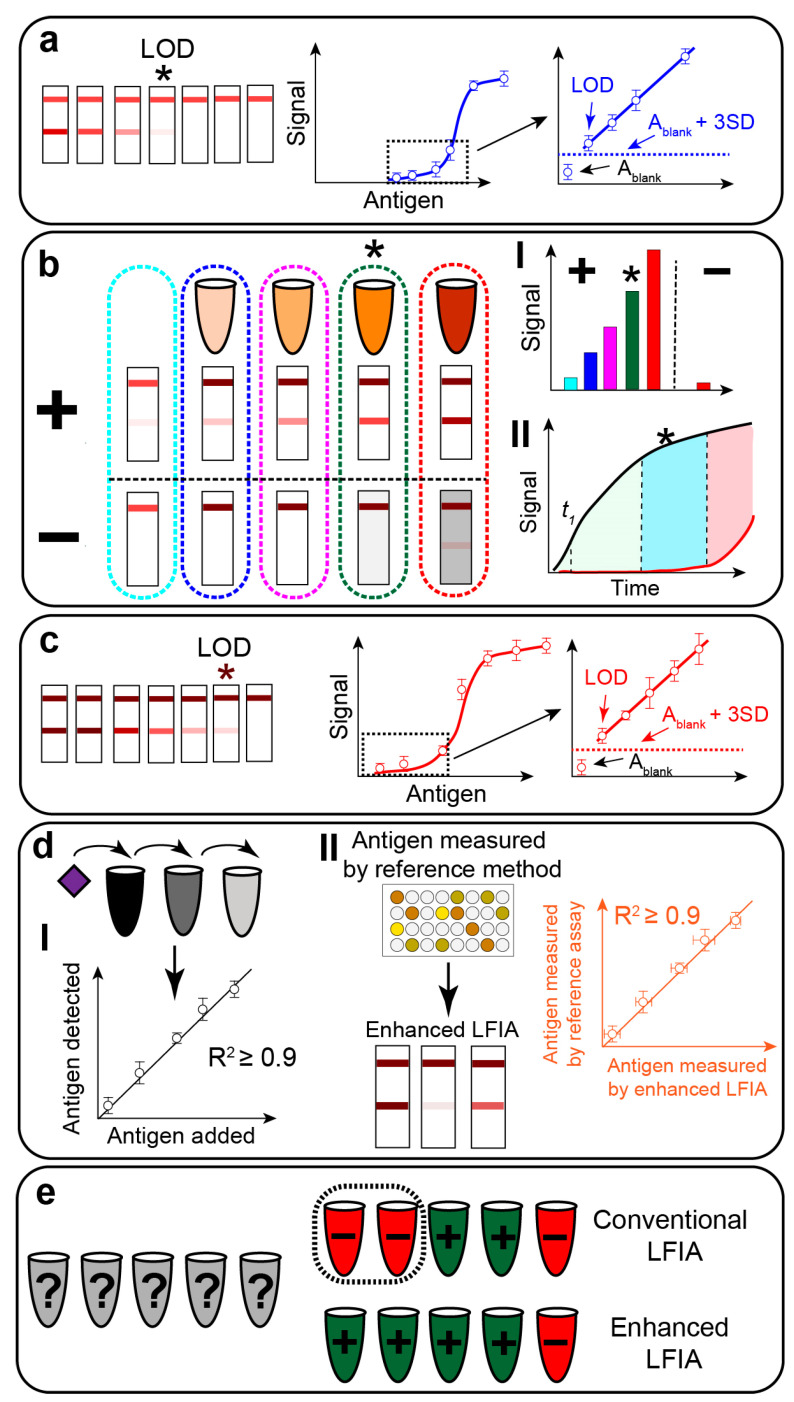
Lateral flow immunoassay (LFIA) has found a broad application for testing in point-of-care (POC) settings. LFIA is performed using test strips-fully integrated multimembrane assemblies containing all reagents for assay performance. Migration of liquid sample along the test strip initiates the formation of labeled immunocomplexes, which are detected visually or instrumentally. The tradeoff of LFIA's rapidity and user-friendliness is its relatively low sensitivity (high limit of detection), which restricts its applicability for detecting low-abundant targets. An increase in LFIA's sensitivity has attracted many efforts and is often considered one of the primary directions in developing immunochemical POC assays. Post-assay enhancements based on chemical reactions facilitate high sensitivity. In this critical review, we explain the performance of post-assay chemical enhancements, discuss their advantages, limitations, compared limit of detection (LOD) improvements, and required time for the enhancement procedures. We raise concerns about the performance of enhanced LFIA and discuss the bottlenecks in the existing experiments. Finally, we suggest the experimental workflow for step-by-step development and validation of enhanced LFIA. This review summarizes the state-of-art of LFIA with chemical enhancement, offers ways to overcome existing limitations, and discusses future outlooks for highly sensitive testing in POC conditions.

Keywords: antibodies; highly sensitive detection; immunochromatography; nanoparticles; nanozymes; point-of-care testing; signal amplification.


Conflict of interest statement

The authors declare no conflict of interest.

Figures

Figure 2
Figure 2
SEM microphotographs of test zones and corresponding test strips. (a) GNPs before enhancement. (b) Au@Ag nanoparticles after silver enhancement. (c) Au@Ag-Au nanoparticles after silver enhancement and galvanic-assisted Pt deposition. (d) Enlarged GNP after gold enhancement. The bars are equal to 500 nm [40].
Figure 1
Figure 1
The principle of LFIA in the sandwich (ad) and competitive (eh) formats. (a) Structure of the test strip for LFIA in the sandwich format. GNP-Ab stands for the conjugate of gold nanoparticles (GNP) with antibodies. TZ stands for test zone. TZ contains antibodies against antigen. CZ stands for control zone. CZ contains binders of GNP-Ab. (b) LFIA for samples with antigen. (c) LFIA for samples without antigen. The upper parts of (b,c) show the structure of immunocomplexes in TZ and CZ after completion of LFIA. The bottom parts show the appearance of test strips after completion of LFIA. (d) Post-assay enhancement of sandwich LFIA. The appearance of test strips before and after enhancement and calibration plots before (blue) and after (red) enhancement are schematically shown. (e) Structure of the test strip for LFIA in the competitive format. TZ contains immobilized antigen (Ag). (f) LFIA for samples with antigen. (g) LFIA for samples without antigen. The upper parts of (f,g) show the structure of immunocomplexes in TZ and CZ after completion of LFIA. The bottom parts show the appearance of test strips after completion of LFIA. (h) Post-assay enhancement of competitive LFIA. Schematically shown are the appearance of test strips before and after enhancement, and calibration plots before (blue) and after (red) enhancement.
Figure 3
Figure 3
Gold enhancement for LFIA amplification. (a) Effect of pH on gold enhancement. Scanning electron microscopy was performed on three zones of test strips. B zone—blank membrane containing neither GNPs nor immobilized proteins. C zone contained 1 mg/mL of BSA. T zone contained 20 pM/L of BSA-GNP conjugate. I—test strip and microphotographs of three zones before gold enhancement. Red circles show the localization of GNP in T zone. II—test strip and microphotograph of three zones after gold enhancement at pH = 2. III—test strip and microphotograph of three zones after gold enhancement at pH = 5. (b) LFIA of hepatitis B surface antigen (HBsAg), test strips before and after gold enhancement. (c) Calibration plots for LFIAs before and after gold enhancement [51].
Figure 4
Figure 4
Silver enhancement for LFIA amplification. (a) Microphotograph of nanoparticles on the test strip before silver enhancement. The arrows show the position of nanoparticles. (b) Microphotograph of nanoparticles after silver enhancement [68]. (c) Use of silver enhancement for LFIA of cardiac troponin I. Concentrations of cardiac troponin I are shown above the test strips (i) before silver enhancement and (ii) after silver enhancement [87].
Figure 5
Figure 5
Copper enhancement for LFIA amplification. (a) Elemental mapping of GNPs and nanoparticles after copper enhancement [95]. (b) Scanning electron microphotograph of nanoparticles before copper enhancement. (c) Scanning electron microphotograph of nanoparticles after enhancement. Inserts show the appearance of colored zones on the test strip [99]. Copper enhancement for LFIA of E. coli. (d) Test strips before copper enhancement. (e) Test strips after copper enhancement. Asterisks show the visual LOD values. (f) Calibration plot of LFIA before and after copper enhancement [96].
Figure 6
Figure 6
Polylayer GNP assembly for LFIA enhancement. (a) The principle of the approach. After completion of conventional LFIA (cycle 0), conjugates of GNP with CD and TCPP are manually added to the test strips, resulting in the polylayer assembly of GNPs. (b) Scanning electron microscopy microphotographs of TZ after different cycle numbers. (c) Calibration plots after different cycle numbers [113].
Figure 7
Figure 7
Enzyme-assisted signal amplification in LFIA. (a) Test strips with colorimetric and chemiluminescent signals registered after LFIA of various concentrations of human cardiac troponin I; HRP was used as the catalytic label. (b) Calibration plots for test strips shown in (a); [125]. Colorimetric signal amplification catalyzed by ALP. (c) Pairs of test strips (before and after ALP-catalyzed enhancement, respectively) after LFIA of potato virus X. (d) Calibration plots for test strips shown in (c) [132].
Figure 8
Figure 8
LFIA with nanozyme signal amplification. (a) Principle of signal amplification. After the performance of conventional LFIA, TMB substrate is added, and the nanozymes in test and control lines catalyze accumulation of colored product. (b) Test strips after nanozyme signal amplification (top) and conventional GNPs (bottom). Asterisks show the visual LOD values. (c) Calibration plots for conventional and nanozyme signal enhancement [182].
Figure 9
Figure 9
In situ restoring of Au nanozyme surface. (a) Test strips after conventional LFIA with GNP before gold enhancement (I), after gold enhancement (II), after gold enhancement and catalysis (III). Red asterisks show the visual LOD values. The numbers below test strips correspond to E. coli concentration from 2.5 × 10⁵ (1) to 50 CFU/mL (15) and negative control (16). (b) Calibration plots of three LFIAs shown in panel (a) [230].
Figure 10
Figure 10
Various approaches for post-assay integrated signal amplification. (a) The use of additional membranes maintains the migration of enhancing reagents [136]. (b) Hand-driven rotatory device for the consequent delivery of immunoreagents and enhancing reagents [241]. (c) The test strip with wax-printed barriers for consequent delivery of immunoreagents and enhancing reagents [242]. (d) The 3D system with an additional membrane that comes into contact with the test strip and initiates migration of enhancing reagents after completion of conventional LFIA [157].
Figure 11
Figure 11
Plots demonstrating the comparable performance of various post-assay enhancement approaches. (a,b) LOD reduction values. (c,d) Time of enhancement. Data for (ad) are summarized in Tables S2 and S3.
Figure 12
Figure 12
Factors causing a discrepancy in LOD reduction. (a) Non-optimized time of enhancement. Development of specific (black curve) and non-specific (red curve) coloration during time. (b) Heterogeneity of nanozyme’s catalytic activity. (c) Non-specific adsorption of nanolabels causing background.
Figure 13
Figure 13
Comparison of three enhancement approaches for LFIA of human cardiac troponin I using the same immunoreagents. (A) Gold enhancement. (B) HRP-catalyzed signal enhancement. (C) ALP-catalyzed signal enhancement [268].
Figure 14
Figure 14
Workflow for the development of enhanced LFIA. (a) Determination of LOD of conventional (before enhancement) LFIA. (b) Optimization of the enhancement stage. Various concentrations of components in enhancing solution are used for signal amplification in positive (+) and negative (−) LFIA. Optimal concentration facilitates the highest amplification for (+) while keeping the signal for (−) minimal (I). The optimal concentration is shown with an asterisk. Optimal enhancement time is selected using an optimized enhancing solution. Optimal enhancement time facilitates maximal signal amplification for (+) while keeping signal for (−) minimal (II). The optimal time is shown as the blue area and marked with an asterisk. (c) Determination of LOD of enhanced LFIA. (d) Determination of the accuracy of enhanced LFIA. Matrix is spiked with the known concentration of the antigen. Afterward, the concentration is determined by enhanced LFIA. Correlation between spiked and measured concentrations is characterized quantitatively with R2 coefficient (I). The concentration of antigen is measured in real samples with reference methods and enhanced LFIA. Correlation between concentrations measured by the reference method and enhanced LFIA is characterized quantitatively with R2 coefficient (II). (e) Detection of antigen is performed in real samples with conventional and enhanced LFIA. Qualitative and/or quantitative characterization of real samples is performed by the reference method. The number of true positive and negative, false positive and negative, and specificity and sensitivity are calculated for conventional and enhanced LFIA.

Similar articles

Cited by

References

    1. Di Nardo F., Chiarello M., Cavalera S., Baggiani C., Anfossi L. Ten Years of Lateral Flow Immunoassay Technique Applications: Trends, Challenges and Future Perspectives. Sensors. 2021;21:5185. doi: 10.3390/s21155185. - DOI - PMC - PubMed
    1. Wang Z., Zhao J., Xu X., Guo L., Xu L., Sun M., Hu S., Kuang H., Xu C., Li A. An Overview for the Nanoparticles-Based Quantitative Lateral Flow Assay. Small Methods. 2022;6:1–29. doi: 10.1002/smtd.202101143. - DOI - PubMed
    1. Huang Y., Xu T., Wang W., Wen Y., Li K., Qian L., Zhang X., Liu G. Lateral Flow Biosensors Based on the Use of Micro- and Nanomaterials: A Review on Recent Developments. Microchim. Acta. 2020;187:70. doi: 10.1007/s00604-019-3822-x. - DOI - PubMed
    1. Urusov A.E., Zherdev A.V., Dzantiev B.B. Towards Lateral Flow Quantitative Assays: Detection Approaches. Biosensors. 2019;9:89. doi: 10.3390/bios9030089. - DOI - PMC - PubMed
    1. Sena-Torralba A., Álvarez-Diduk R., Parolo C., Piper A., Merkoçi A. Toward Next Generation Lateral Flow Assays: Integration of Nanomaterials. Chem. Rev. 2022;122:14881–14910. doi: 10.1021/acs.chemrev.1c01012. - DOI - PMC - PubMed

LinkOut - more resources