

Dynamics of Cytokine, SARS-CoV-2-Specific IgG, and Neutralizing Antibody Levels in COVID-19 Patients Treated with Convalescent Plasma
- PMID: 37754308
- PMCID: PMC10527804
- DOI: 10.3390/diseases11030112
Dynamics of Cytokine, SARS-CoV-2-Specific IgG, and Neutralizing Antibody Levels in COVID-19 Patients Treated with Convalescent Plasma
Abstract
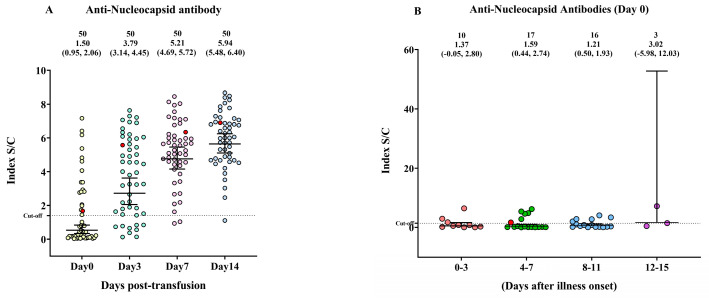
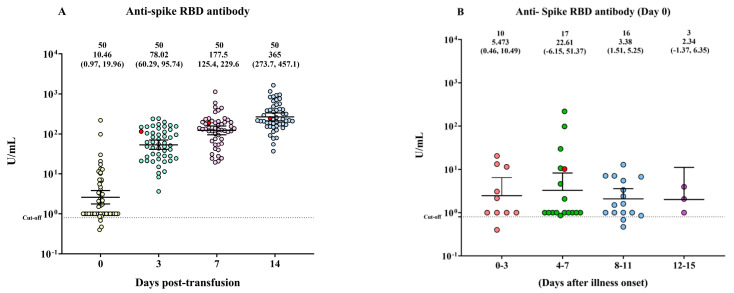
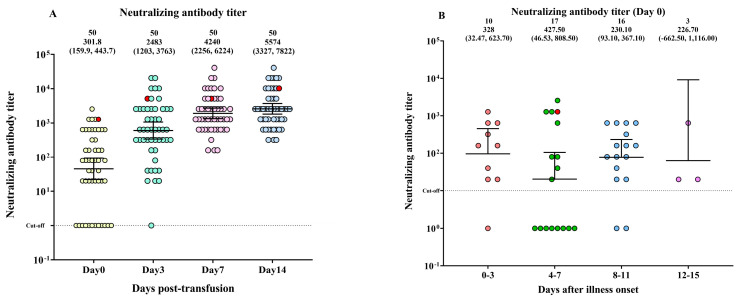
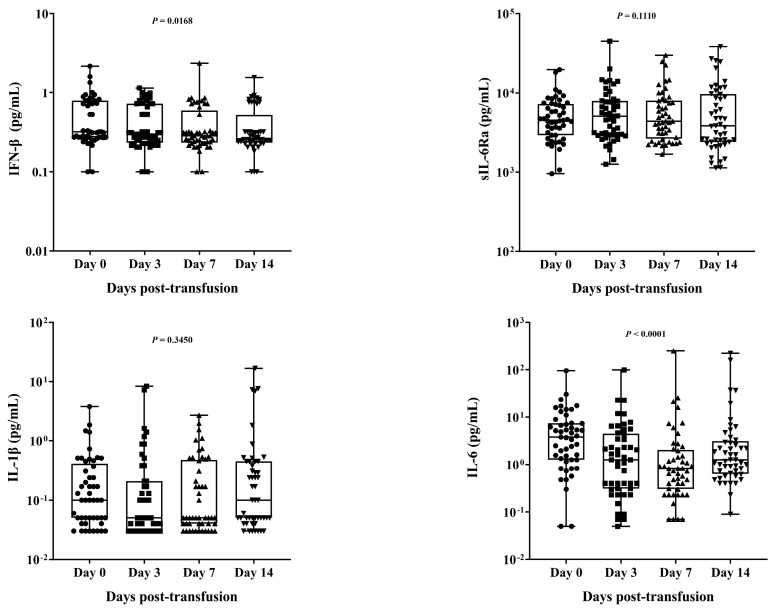
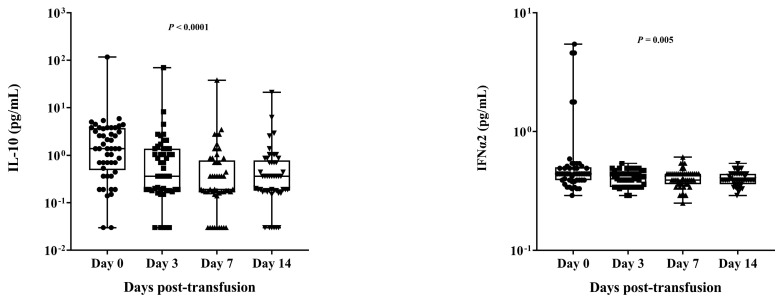
Coronavirus disease 2019 (COVID-19) is a contagious illness worldwide. While guidelines for the treatment of COVID-19 have been established, the understanding of the relationship among neutralizing antibodies, cytokines, and the combined use of antiviral medications, steroid drugs, and convalescent plasma therapy remains limited. Here, we investigated the connection between the immunological response and the efficacy of convalescent plasma therapy in COVID-19 patients with moderate-to-severe pneumonia. The study included a retrospective analysis of 49 patients aged 35 to 57. We conducted clinical assessments to determine antibody levels, biochemical markers, and cytokine levels. Among the patients, 48 (98%) were discharged, while one died. We observed significantly higher levels of anti-nucleocapsid, anti-spike, and neutralizing antibodies on days 3, 7, and 14 after the transfusion compared to before treatment. Serum CRP and D-dimer levels varied significantly across these four time points. Moreover, convalescent plasma therapy demonstrated an immunoregulatory effect on cytokine parameters, with significant differences in IFN-β, IL-6, IL-10, and IFN-α levels observed at different sampling times. Evaluating the cytokine signature, along with standard clinical and laboratory parameters, may help to identify the onset of a cytokine storm in COVID-19 patients and determine the appropriate indication for anti-cytokine treatment.
Keywords: COVID-19; antibodies; convalescent plasma treatment; cytokine; retrospective study.
Conflict of interest statement
The authors declare no conflict of interest.
Figures
Similar articles
-
Treatment of 5 Critically Ill Patients With COVID-19 With Convalescent Plasma.JAMA. 2020 Apr 28;323(16):1582-1589. doi: 10.1001/jama.2020.4783. JAMA. 2020. PMID: 32219428 Free PMC article.
-
Different Profiles of Antibodies and Cytokines Were Found Between Severe and Moderate COVID-19 Patients.Front Immunol. 2021 Aug 19;12:723585. doi: 10.3389/fimmu.2021.723585. eCollection 2021. Front Immunol. 2021. PMID: 34489974 Free PMC article.
-
Randomized clinical trial to evaluate safety and efficacy of convalescent plasma use among hospitalized patients with COVID-19 (PERUCONPLASMA): a structured summary of a study protocol for a randomized controlled trial.Trials. 2021 May 17;22(1):342. doi: 10.1186/s13063-021-05189-6. Trials. 2021. PMID: 34001174 Free PMC article.
-
Convalescent plasma or hyperimmune immunoglobulin for people with COVID-19: a rapid review.Cochrane Database Syst Rev. 2020 May 14;5(5):CD013600. doi: 10.1002/14651858.CD013600. Cochrane Database Syst Rev. 2020. Update in: Cochrane Database Syst Rev. 2020 Jul 10;7:CD013600. doi: 10.1002/14651858.CD013600.pub2. PMID: 32406927 Free PMC article. Updated.
-
Cytokine storm and leukocyte changes in mild versus severe SARS-CoV-2 infection: Review of 3939 COVID-19 patients in China and emerging pathogenesis and therapy concepts.J Leukoc Biol. 2020 Jul;108(1):17-41. doi: 10.1002/JLB.3COVR0520-272R. Epub 2020 Jun 13. J Leukoc Biol. 2020. PMID: 32534467 Free PMC article. Review.
Cited by
-
Next-generation treatments: Immunotherapy and advanced therapies for COVID-19.Heliyon. 2024 Feb 19;10(5):e26423. doi: 10.1016/j.heliyon.2024.e26423. eCollection 2024 Mar 15. Heliyon. 2024. PMID: 38434363 Free PMC article. Review.
-
Estimates of actual and potential lives saved in the United States from the use of COVID-19 convalescent plasma.Proc Natl Acad Sci U S A. 2024 Oct 8;121(41):e2414957121. doi: 10.1073/pnas.2414957121. Epub 2024 Oct 1. Proc Natl Acad Sci U S A. 2024. PMID: 39352932 Free PMC article.
References
-
- Ghayda R.A., Lee J., Lee J.Y., Kim D.K., Lee K.H., Hong S.H., Han Y.J., Kim J.S., Yang J.W., Kronbichler A., et al. Correlations of Clinical and Laboratory Characteristics of COVID-19: A Systematic Review and Meta-Analysis. Int. J. Environ. Res. Public Health. 2020;17:5026. doi: 10.3390/ijerph17145026. - DOI - PMC - PubMed
-
- Grant M.C., Geoghegan L., Arbyn M., Mohammed Z., McGuinness L., Clarke E.L., Wade R.G. The prevalence of symptoms in 24,410 adults infected by the novel coronavirus (SARS-CoV-2; COVID-19): A systematic review and meta-analysis of 148 studies from 9 countries. PLoS ONE. 2020;15:e0234765. doi: 10.1371/journal.pone.0234765. - DOI - PMC - PubMed
-
- Chen N., Zhou M., Dong X., Qu J., Gong F., Han Y., Qiu Y., Wang J., Liu Y., Wei Y., et al. Epidemiological and clinical characteristics of 99 cases of 2019 novel coronavirus pneumonia in Wuhan, China: A descriptive study. Lancet. 2020;395:507–513. doi: 10.1016/S0140-6736(20)30211-7. - DOI - PMC - PubMed
-
- Wendel Garcia P.D., Fumeaux T., Guerci P., Heuberger D.M., Montomoli J., Roche-Campo F., Schuepbach R.A., Hilty M.P. Prognostic factors associated with mortality risk and disease progression in 639 critically ill patients with COVID-19 in Europe: Initial report of the international RISC-19-ICU prospective observational cohort. EClinicalMedicine. 2020;25:100449. doi: 10.1016/j.eclinm.2020.100449. - DOI - PMC - PubMed
Grants and funding
LinkOut - more resources
Full Text Sources
Research Materials
Miscellaneous
