. 2023 Sep 11;20(18):6740.
doi: 10.3390/ijerph20186740.

Mathematical Modeling for the Assessment of Public Policies in the Cancer Health-Care System Implemented for the Colombian Case

Affiliations

Mathematical Modeling for the Assessment of Public Policies in the Cancer Health-Care System Implemented for the Colombian Case

Daniel Rojas-Díaz et al. Int J Environ Res Public Health. .

Abstract

The incidence of cancer has been constantly growing worldwide, placing pressure on health systems and increasing the costs associated with the treatment of cancer. In particular, low- and middle-income countries are expected to face serious challenges related to caring for the majority of the world's new cancer cases in the next 10 years. In this study, we propose a mathematical model that allows for the simulation of different strategies focused on public policies by combining spending and epidemiological indicators. In this way, strategies aimed at efficient spending management with better epidemiological indicators can be determined. For validation and calibration of the model, we use data from Colombia-which, according to the World Bank, is an upper-middle-income country. The results of the simulations using the proposed model, calibrated and validated for Colombia, indicate that the most effective strategy for reducing mortality and financial burden consists of a combination of early detection and greater efficiency of treatment in the early stages of cancer. This approach is found to present a 38% reduction in mortality rate and a 20% reduction in costs (% GDP) when compared to the baseline scenario. Hence, Colombia should prioritize comprehensive care models that focus on patient-centered care, prevention, and early detection.

Keywords: cancer care; discrete time; health system; identifiability analysis; mathematical modeling; parameter estimation; public health; public policies; sensitivity analyses.


Conflict of interest statement

The authors declare no conflict of interest.

Figures

Figure 2
Figure 2
Diagram of the mathematical model inferred from schema in Figure 1 with three different treatment quality levels (T1T3). The colored boxes at the top of the figure represent model components that we do not model through states. Most of the states can be grouped, as they have or have not received attention from the cancer healthcare system (diagnosed and undiagnosed ones, respectively). The natural model outputs are the patients who die at every time step, X(t), the patients who recover from the disease at every time step, R(t), and the total spending on cancer healthcare at every time step, G(t). The dotted line for G indicates that there is no inflow of individuals into G; instead, G receives an inflow in currency, induced by the number of individuals in the diagnosed states.
Figure A1
Figure A1
Distribution of the spending and number of cases for prioritized cancer types in Colombia according to cleaned data from SISPRO for the years 2015–2021.
Figure A2
Figure A2
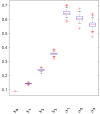
Normalized identifiability boxplots using auxiliary Model 1 (Figure 4). he boxplots display normalized estimations of parameters obtained through auxiliary model 1, with each boxplot corresponding to a different parameter. Outliers, depicted as red crosses, have been identified using the interquartile range and are shown to emphasize extreme values. Note that all the estimations are presented as narrow intervals for the parameters, which suggests their identifiability.
Figure A3
Figure A3
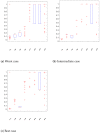
Normalized identifiability boxplots using auxiliary Model 2 (Figure 5). The boxplots display normalized estimations of parameters obtained through auxiliary model 2, with each boxplot corresponding to a different scenario. Outliers, represented by red crosses, have been identified using the interquartile range and are shown to highlight extreme values. Additionally, note that the median values for all parameters were anchored to an end of the boxplot, indicating that most of the estimations were concentrated at the same value in each case.
Figure A4
Figure A4
Model outputs for diagnosed and undiagnosed patients, as well as costs for each stage of the disease, using the baseline estimated parameters. Note that the majority of cost growth is attributed to the accumulation of diagnosed patients at stage IV. Additionally, there is a substantial number of undiagnosed patients at each stage.
Figure 1
Figure 1
Scheme of the cancer cycle before and after patients enter the Colombian cancer healthcare system. Bold letters indicate those components of the system for which sufficient data were found to model them with reliable parameters. Dotted lines represent indirect interactions.
Figure 3
Figure 3
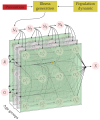
Representation of the proposed mathematical model from the perspective of meta-population modeling to take age groups into account. Every model inside a panel is a copy of the model depicted in Figure 2.
Figure 4
Figure 4
Auxiliary model for estimating parameters related to the undiagnosed states. This model represents the undiagnosed patient component in Figure 2 by explicitly including the parameters that determine the flows. Due to the prioritization of detection (δ) over progression (α), the flow from state N1 to N2 takes the form (1δ1)α1, while the loop from N1 to itself has the form (1δ1)(1α1); the flow from state N2 to N3 has the form (1δ2)α2, and the loop from N2 to itself has the form (1δ1)(1α1); and so on. We simplify the representation of the model by omitting this level of detail to enhance the interpretability of the figure. For a more comprehensive understanding, please refer to Section 3.2.1.
Figure 5
Figure 5
Auxiliary model for estimating parameters related to the diagnosis state (see Section 3.3.2). This model represents the component of diagnosed patients in Figure 2 for a single level of treatment quality, while tracing the flow of patients according to the stage of the disease at the time of diagnosis. The superindices for each state indicate the stage at the time of diagnosis. X represents the individuals who pass away at each time step. Similar to the diagram in Figure 4, the recovery process (γ) takes precedence over the transition process (α). Thus, the flow from state D11 to D21 takes the form (1γ1)α1, and the loop from state D11 to itself has the form (1γ1)(1α1). However, we omit this level of detail to enhance interpretability. The unlabeled arrows at the beginning of each chain of states with the same superindex represent the initial condition of diagnosed patients.
Figure 6
Figure 6
Validation of the baseline behavior of the proposed estimated model. (Left) Mortality rate per 100,000 population (shown in blue) compared to the non-fitted real data (shown in red). The blue line represents the model output with nominal parameter values from Table 1, Table 3 and Table 4, which serves as the baseline for further comparisons with scenarios involving different parameter values. (Right) Expenditure in Colombian currency for cancer care (shown in blue) compared to the non-fitted real data (shown in red). The blue line represents the model output with nominal parameter values from Table 1, Table 3 and Table 4, which serves as the baseline for further comparisons with scenarios involving different parameter values.
Figure 7
Figure 7
Uncertainty analysis for target model output T using intervals in Table 5 for those parameters with %SSTi greater than 1%. The remaining parameters were kept fixed at their nominal values.
Figure 8
Figure 8
Results of the MC filtering applied to UA in Figure 7. The difference between eCDF for lower (θi0) and higher (θi1) values was greater for those parameters with large %SSTi values (see Table 5). The exception to this rule was the parameter α[s1].
Figure 9
Figure 9
Simulation of the three different scenarios induced by Hypotheses 1–3. Scenario 3 is the only one that leads to a long-term reduction in cancer spending.

Similar articles

References

    1. Ward Z.J., Scott A.M., Hricak H., Atun R. Global costs, health benefits, and economic benefits of scaling up treatment and imaging modalities for survival of 11 cancers: A simulation-based analysis. Lancet Oncol. 2021;22:341–350. doi: 10.1016/S1470-2045(20)30750-6. - DOI - PMC - PubMed
    1. Homer J.B., Hirsch G.B. System Dynamics Modeling for Public Health: Background and Opportunities. Am. J. Public Health. 2006;96:452–458. doi: 10.2105/AJPH.2005.062059. - DOI - PMC - PubMed
    1. Mariotto A.B., Robin Yabroff K., Shao Y., Feuer E.J., Brown M.L. Projections of the cost of cancer care in the United States: 2010–2020. J. Natl. Cancer Inst. 2011;103:117–128. doi: 10.1093/jnci/djq495. - DOI - PMC - PubMed
    1. Laudicella M., Walsh B., Burns E., Smith P.C. Cost of care for cancer patients in England: Evidence from population-based patient-level data. Br. J. Cancer. 2016;114:1286–1292. doi: 10.1038/bjc.2016.77. - DOI - PMC - PubMed
    1. Anderson A.R.A., Quaranta V. Integrative mathematical oncology. Nat. Rev. Cancer. 2008;8:227–234. doi: 10.1038/nrc2329. - DOI - PubMed

LinkOut - more resources