. 2023 Aug 31;9(9):896.
doi: 10.3390/jof9090896.

Global Gene Expression of Post-Senescent Telomerase-Negative ter1 Δ Strain of Ustilago maydis

Affiliations

Global Gene Expression of Post-Senescent Telomerase-Negative ter1 Δ Strain of Ustilago maydis

Juan Antonio Sanpedro-Luna et al. J Fungi (Basel). .

Abstract

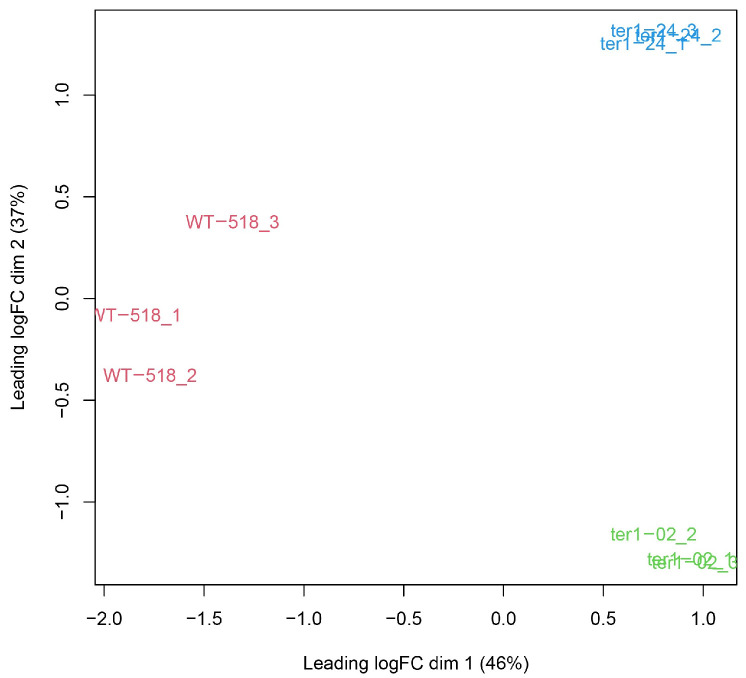
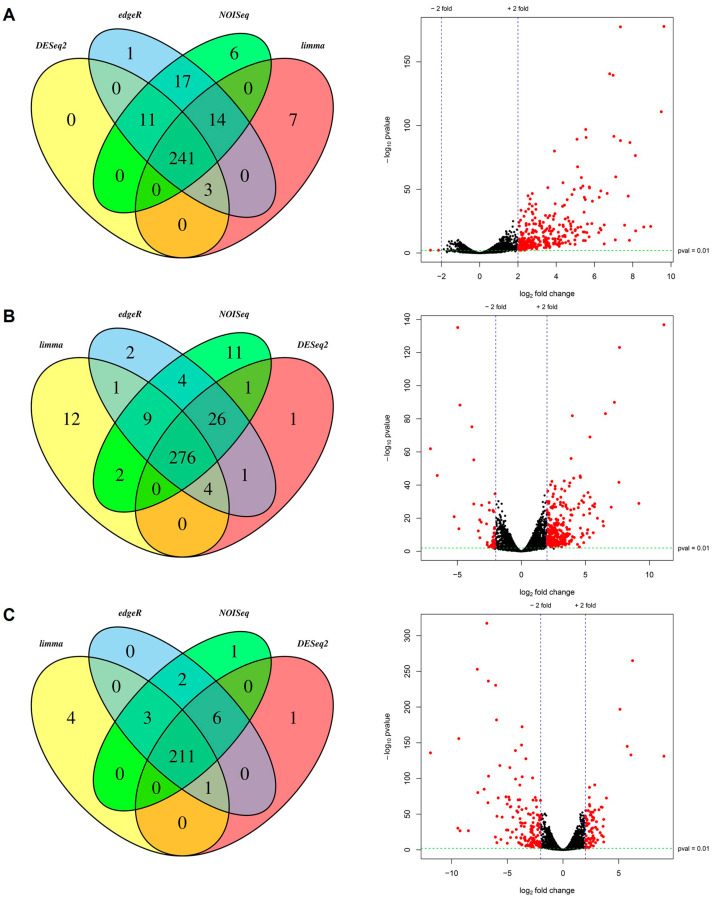
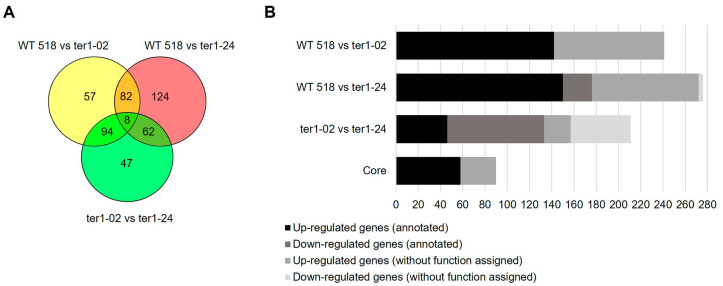
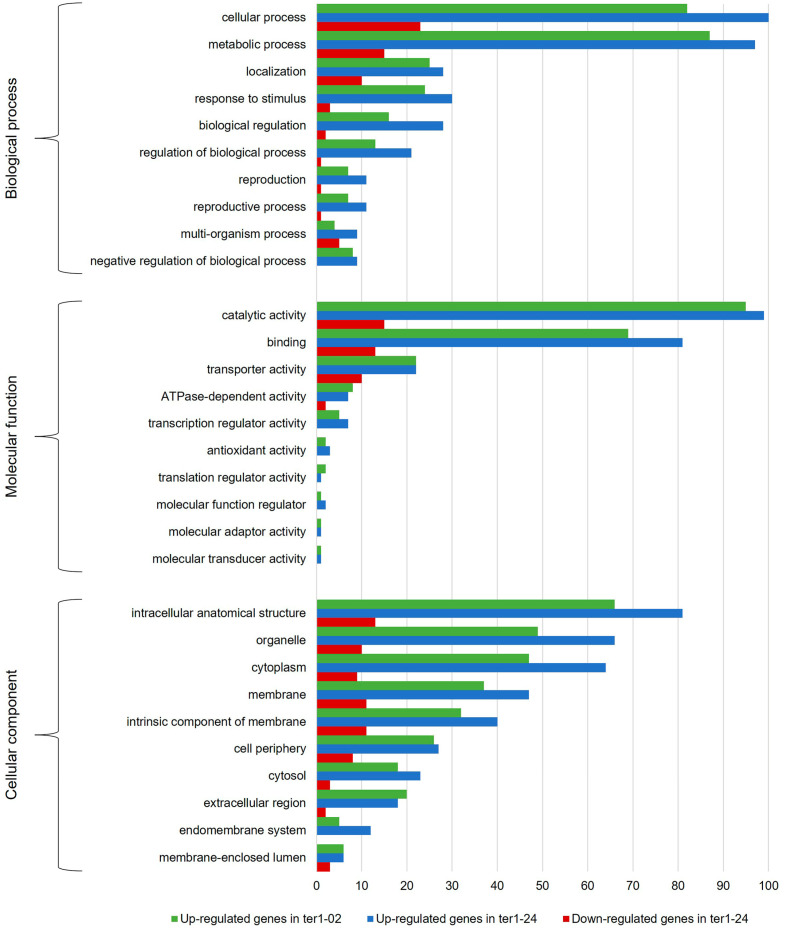
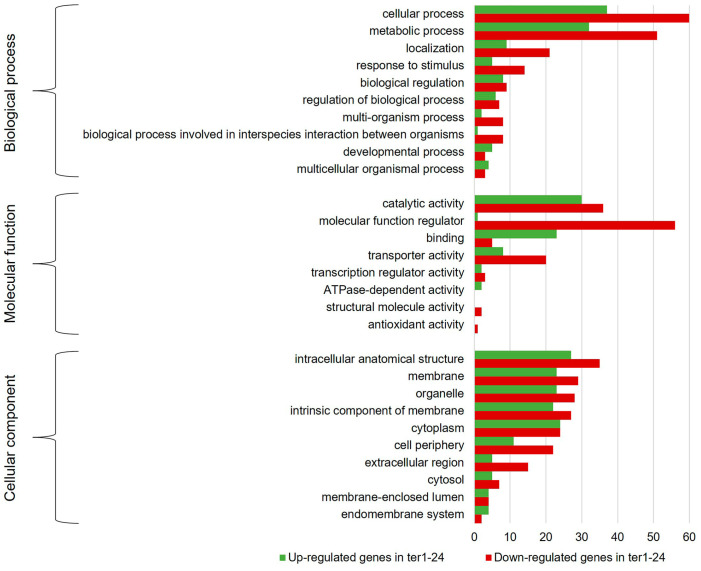
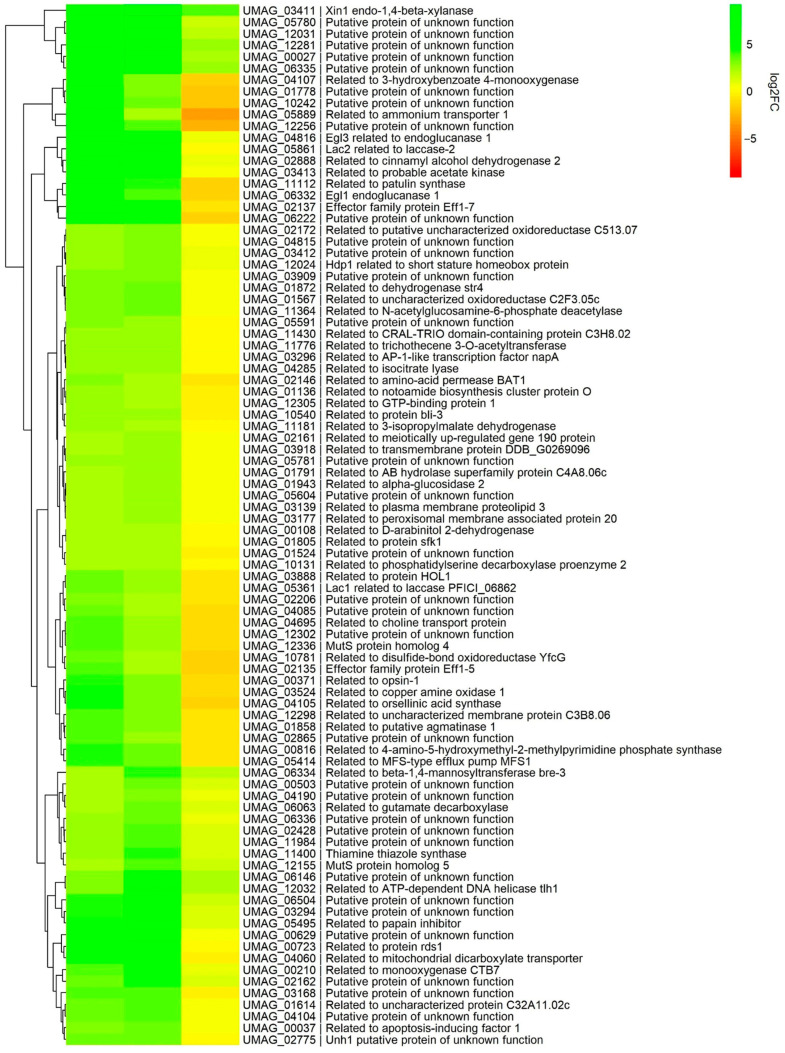
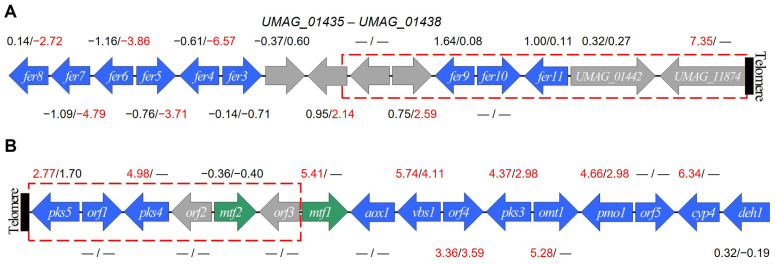
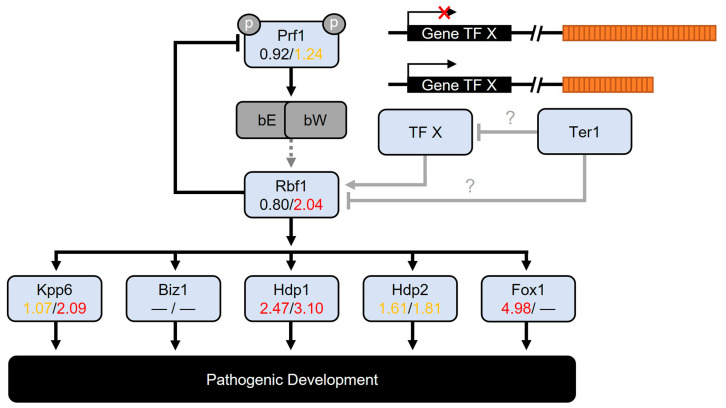
We analyzed the global expression patterns of telomerase-negative mutants from haploid cells of Ustilago maydis to identify the gene network required for cell survival in the absence of telomerase. Mutations in either of the telomerase core subunits (trt1 and ter1) of the dimorphic fungus U. maydis cause deficiencies in teliospore formation. We report the global transcriptome analysis of two ter1Δ survivor strains of U. maydis, revealing the deregulation of telomerase-deleted responses (TDR) genes, such as DNA-damage response, stress response, cell cycle, subtelomeric, and proximal telomere genes. Other differentially expressed genes (DEGs) found in the ter1Δ survivor strains were related to pathogenic lifestyle factors, plant-pathogen crosstalk, iron uptake, meiosis, and melanin synthesis. The two ter1Δ survivors were phenotypically comparable, yet DEGs were identified when comparing these strains. Our findings suggest that teliospore formation in U. maydis is controlled by key pathogenic lifestyle and meiosis genes.

Keywords: telomerase; ter1 mutants; transcriptome analysis.


Conflict of interest statement

The authors declare no conflict of interest.

Figures

Figure 1
Figure 1
MDS plot. RNA-seq samples are grouped in separate clusters reflecting variations between them.
Figure 2
Figure 2
Venn diagrams and distribution of DEGs. The Venn diagrams show the number of DEGs and intersections between each method used. The volcano plots are the distribution of DEGs (red dots) according to the selected cutoff values. (A) Differential expression analysis between strain WT 518 and mutant ter1-02. (B) Differential expression analysis between strain WT 518 and mutant ter1-24. (C) Differential expression analysis between ter1-02 and ter1-24 mutants.
Figure 3
Figure 3
Venn diagram and statistics of the DEGs annotation. (A) Representation of the unique and shared DEGs among the analyzed transcriptomes. (B) Grouping of DEGs concerning functional annotation assignment.
Figure 4
Figure 4
GO classification histogram of the DEGs identified in the ter1 mutants. The graph shows the ten most representative assignments for the categories of biological process (level 2), molecular function (level 2), and cellular component (level 3).
Figure 5
Figure 5
GO classification histogram of the DEGs identified in the differential expression analysis between ter1-02 and ter1-24 mutants. The graph shows the ten most representative assignments for the categories of biological process (level 2), molecular function (level 2), and cellular component (level 3).
Figure 6
Figure 6
Heat map of the DEGs that comprise the core of the ter1::hph mutants. The map was constructed with the logFC values obtained from the EdgeR analysis. Comparisons: WT vs. ter1-02 (first column), WT vs. ter1-24 (second column), and ter1-02 vs. ter1-24 (third column).
Figure 7
Figure 7
ter1 disruption causes the deregulation of gene clusters involved in pathogenic development. (A) Schematic representation of the iron uptake cluster [61]. (B) Schematic representation of the PKS cluster (adapted from [75]). Arrows indicate the direction of gene transcription but not gene sizes. Red rectangles represent the first 20 kb of the chromosomal end. Blue arrows represent genes that are part of the cluster. Gray arrows represent genes not belonging to the cluster’s co-regulated genes. Green arrows represent transcriptional factors. The logFC values obtained from the differential expression analysis with EdgeR are shown. Values on the left correspond to those of strain ter1-02. Values on the right correspond to those of strain ter1-24. DEGs are represented in red.
Figure 8
Figure 8
Rbf1 pathway expression is altered in ter1::hph mutants. Schematic diagram of the response cascade controlled by the master regulator Rbf1. The logFC values were obtained using the EdgeR analysis, shown below each gene. Values on the left correspond to the ter1-02 strain. Values on the right correspond to the ter1-24 strain. DEGs are represented in red. Genes with an increase in transcriptional expression greater than two-fold are in yellow. ter1-24 shows a significant increase in the expression of Rbf1, independent bWx/bEy heterodimer formation (dotted lines); an increase in mainly the expression of Rbf1-target genes is observed in ter1-02. It is tempting to suggest that due to losing TPE as the telomere shortens, an unidentified transcriptional factor (TF X) upregulated its expression. That TF X may have upregulated Rbf1 and promoted the expression of genes downstream of the regulatory cascade. Alternatively, Ter1 could be the negative regulator of Rbf1 or the unidentified TF X (gray arrows with blunted-end heads and question marks).

Similar articles

References

    1. Pfeiffer V., Lingner J. Replication of Telomeres and the Regulation of Telomerase. Cold Spring Harb. Perspect. Biol. 2013;5:a010405. doi: 10.1101/cshperspect.a010405. - DOI - PMC - PubMed
    1. Lundblad V. The End Replication Problem: More Than One Solution. Nat. Med. 1997;3:1198–1199. doi: 10.1038/nm1197-1198. - DOI - PubMed
    1. Blackburn E.H., Collins K. Telomerase: An Rnp Enzyme Synthesizes DNA. Cold Spring Harb. Perspect. Biol. 2011;3:a003558. doi: 10.1101/cshperspect.a003558. - DOI - PMC - PubMed
    1. Flores I., Benetti R., Blasco M.A. Telomerase Regulation and Stem Cell Behaviour. Curr. Opin. Cell Biol. 2006;18:254–260. doi: 10.1016/j.ceb.2006.03.003. - DOI - PubMed
    1. Flores I., Canela A., Vera E., Tejera A., Cotsarelis G., Blasco M.A. The Longest Telomeres: A General Signature of Adult Stem Cell Compartments. Genes Dev. 2008;22:654–667. doi: 10.1101/gad.451008. - DOI - PMC - PubMed