. 2023 Aug 30;21(9):479.
doi: 10.3390/md21090479.

Krill Oil's Protective Benefits against Ultraviolet B-Induced Skin Photoaging in Hairless Mice and In Vitro Experiments

Affiliations

Krill Oil's Protective Benefits against Ultraviolet B-Induced Skin Photoaging in Hairless Mice and In Vitro Experiments

Jongkyu Kim et al. Mar Drugs. .

Abstract

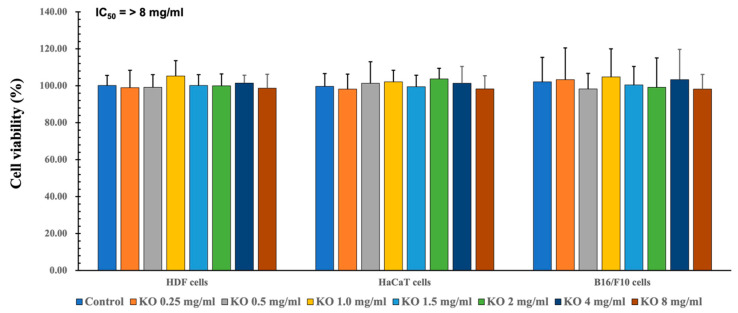
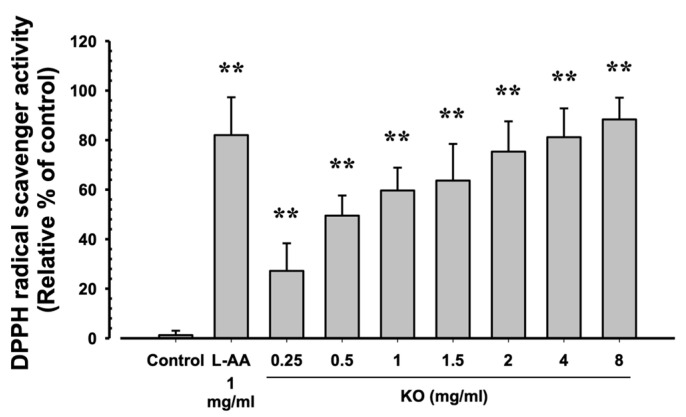
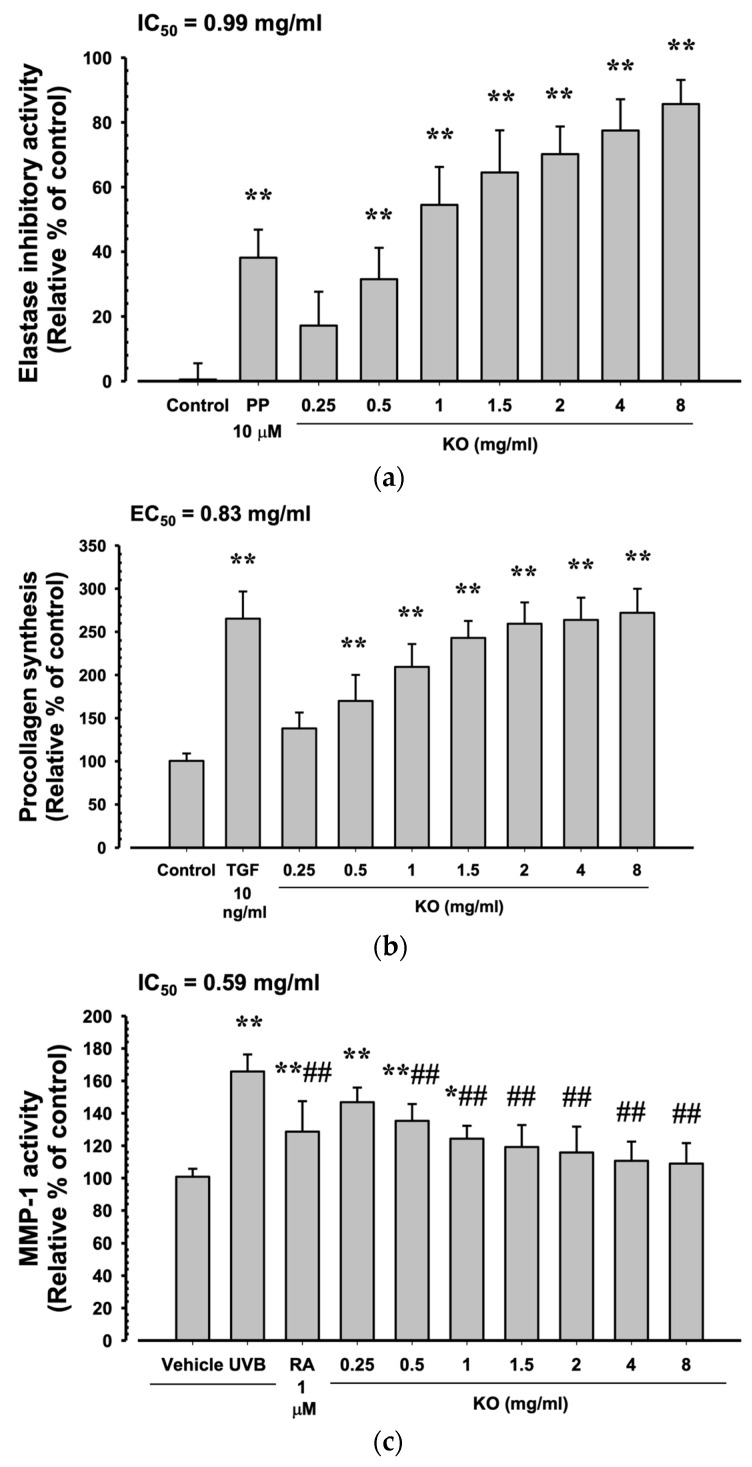
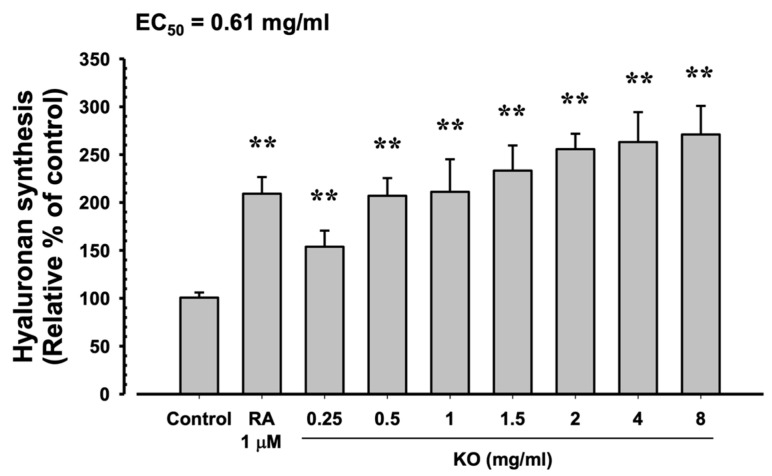
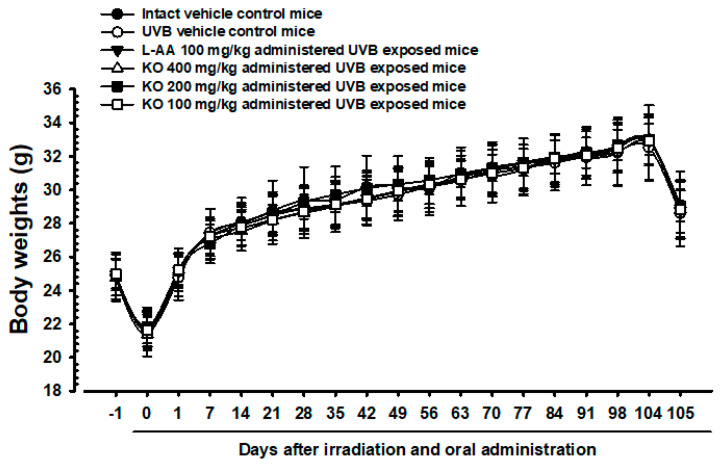
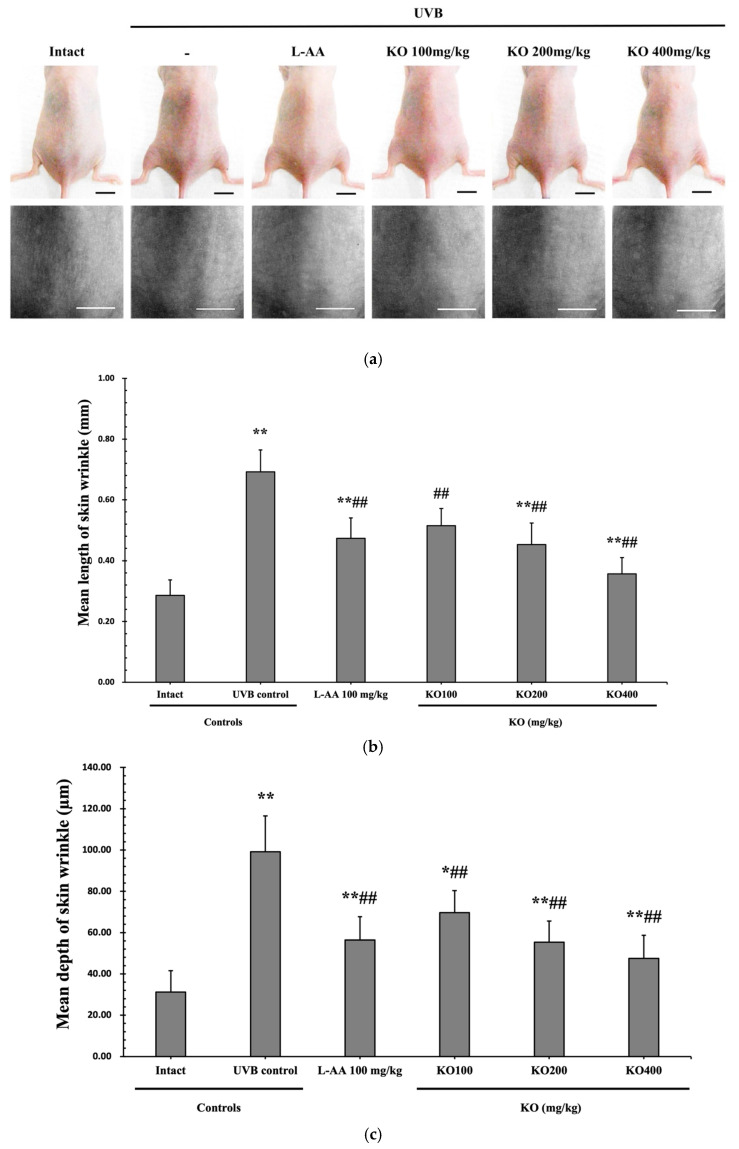
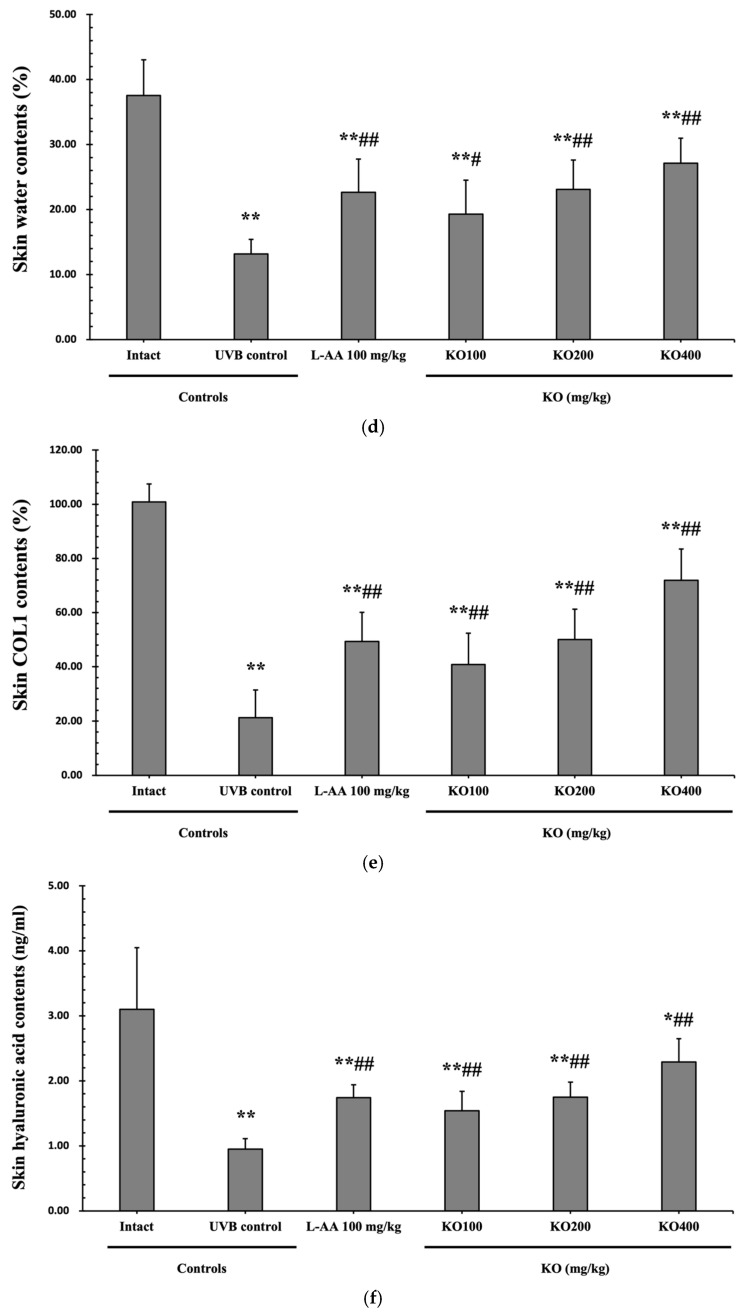
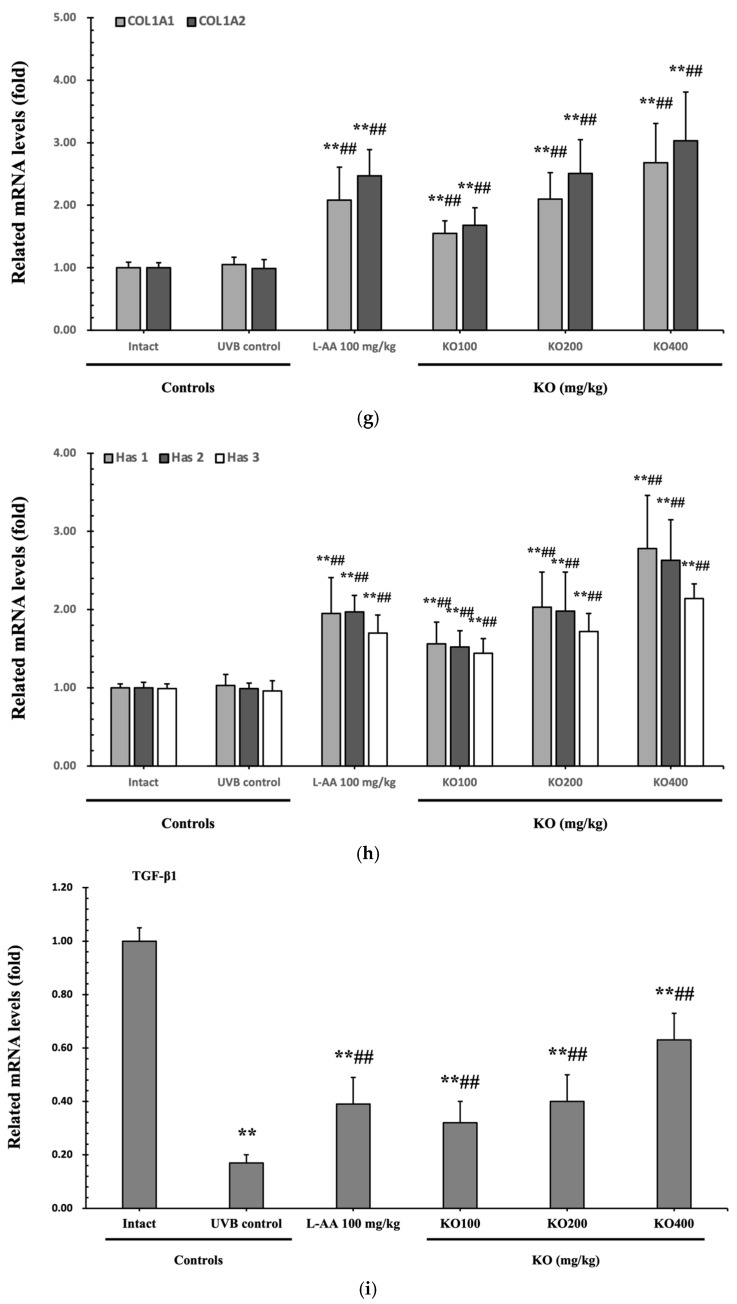
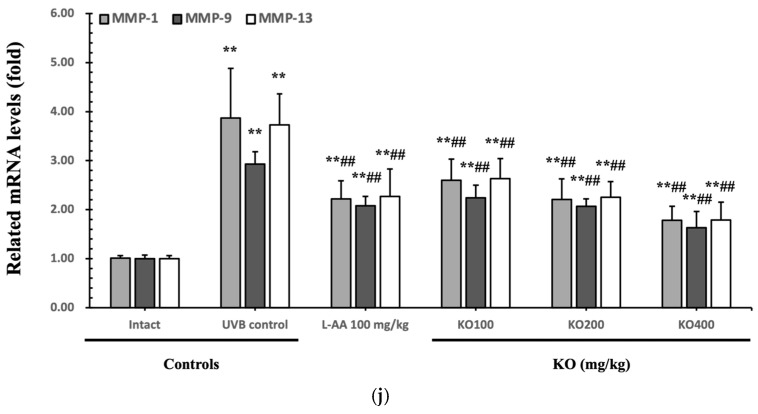
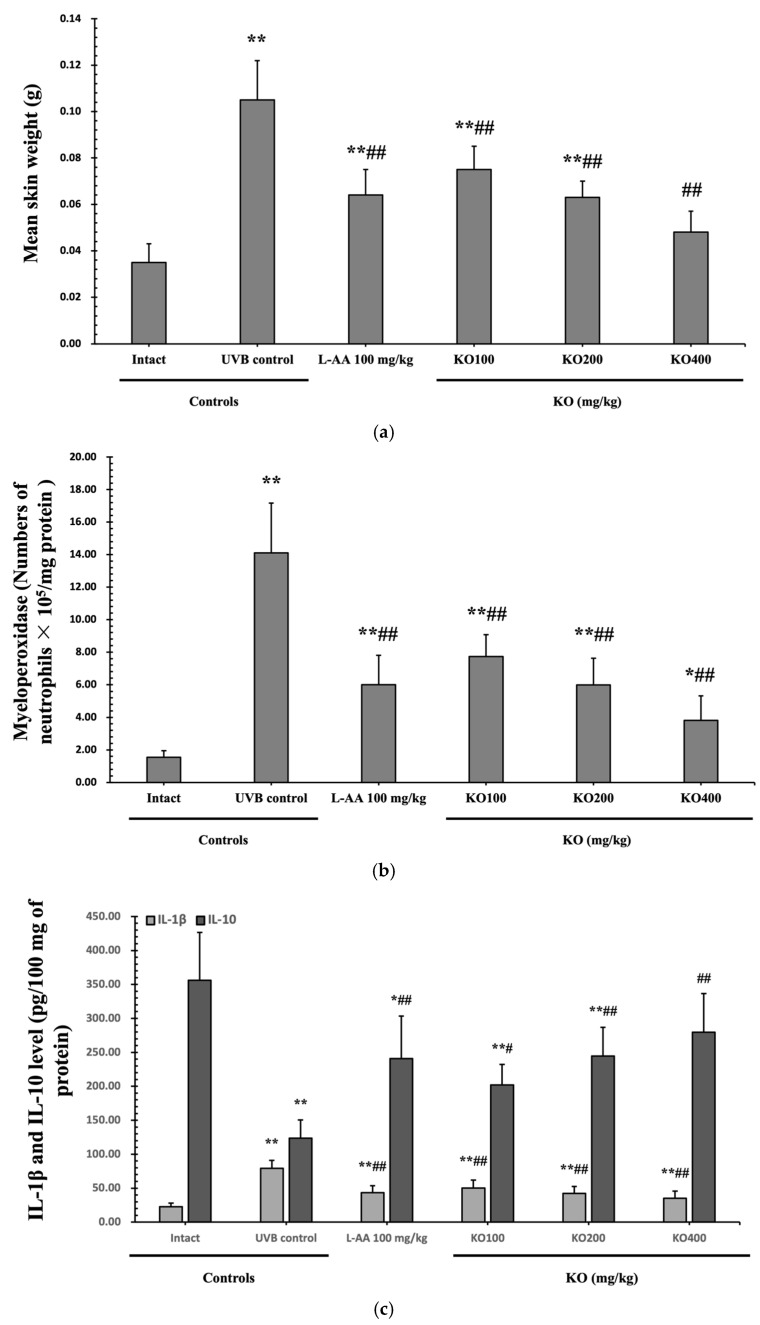
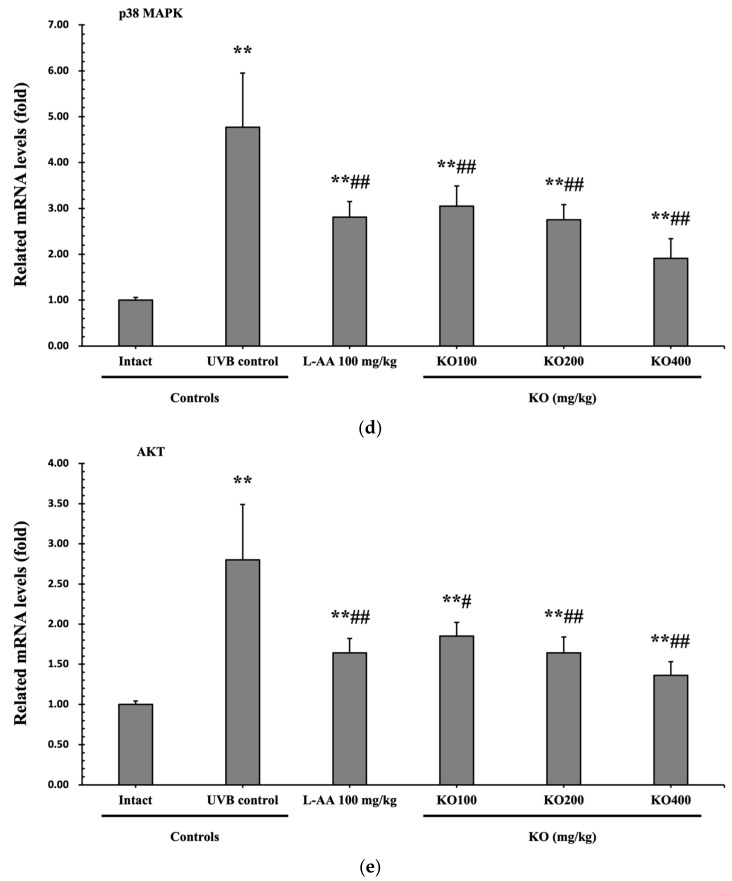
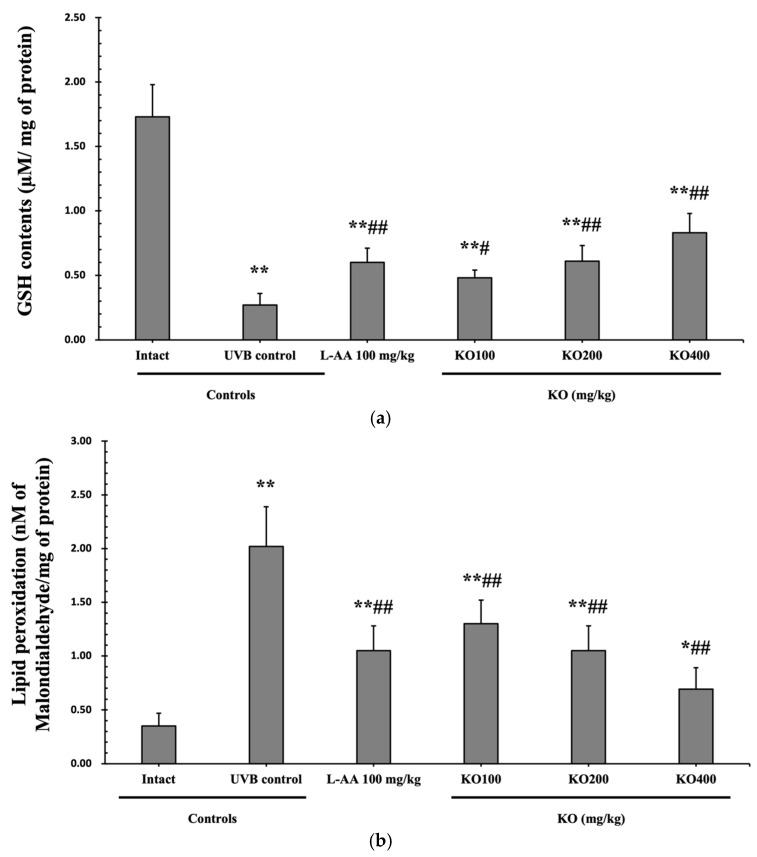
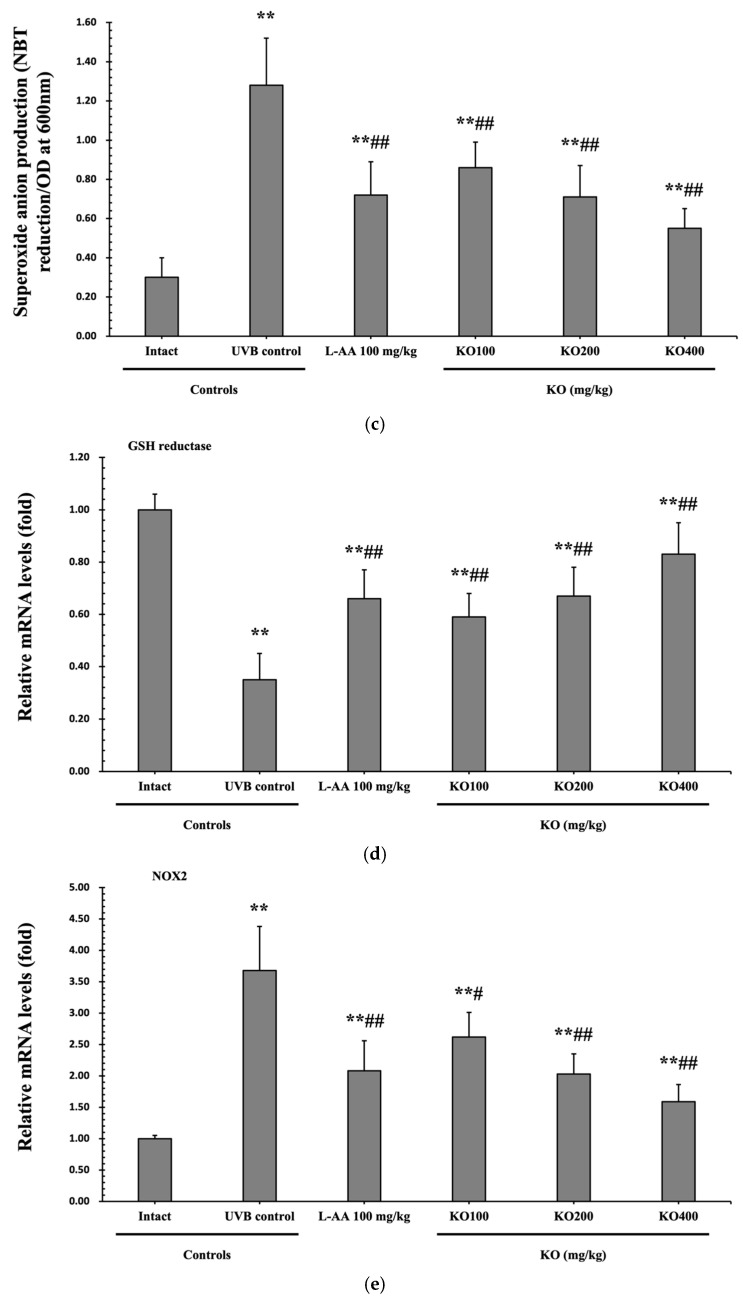
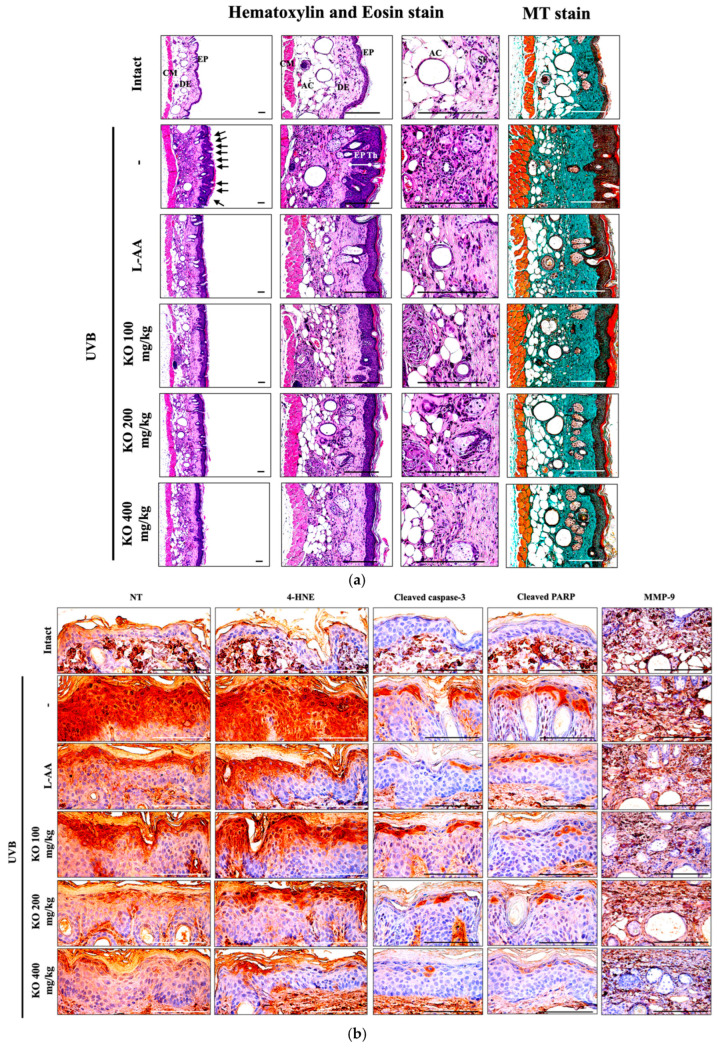
Krill oil (KO) shows promise as a natural marine-derived ingredient for improving skin health. This study investigated its antioxidant, anti-inflammatory, anti-wrinkle, and moisturizing effects on skin cells and UVB-induced skin photoaging in hairless mice. In vitro assays on HDF, HaCaT, and B16/F10 cells, as well as in vivo experiments on 60 hairless mice were conducted. A cell viability assay, diphenyl-1-picryhydrazyl (DPPH) radical scavenging activity test, elastase inhibition assay, procollagen content test, MMP-1 inhibition test, and hyaluronan production assay were used to experiment on in vitro cell models. Mice received oral KO administration (100, 200, or 400 mg/kg) once a day for 15 weeks and UVB radiation three times a week. L-Ascorbic acid (L-AA) was orally administered at 100 mg/kg once daily for 15 weeks, starting from the initial ultraviolet B (UVB) exposures. L-AA administration followed each UVB session (0.18 J/cm2) after one hour. In vitro, KO significantly countered UVB-induced oxidative stress, reduced wrinkles, and prevented skin water loss by enhancing collagen and hyaluronic synthesis. In vivo, all KO dosages showed dose-dependent inhibition of oxidative stress-induced inflammatory photoaging-related skin changes. Skin mRNA expressions for hyaluronan synthesis and collagen synthesis genes also increased dose-dependently after KO treatment. Histopathological analysis confirmed that krill oil (KO) ameliorated the damage caused by UVB-irradiated skin tissues. The results imply that KO could potentially act as a positive measure in diminishing UVB-triggered skin photoaging and address various skin issues like wrinkles and moisturization when taken as a dietary supplement.

Keywords: krill oil; marine-derived ingredients; skin photoaging; ultraviolet.


Conflict of interest statement

The authors declare no conflict of interest.

Figures

Figure 1
Figure 1
Cytotoxicity of KO on HDF cells, cytotoxicity of KO on HaCaT cells, and cytotoxicity of KO on B16/F10 cells. Data are presented as the mean ± standard deviation (SD). KO, krill oil (SuperbaTM Boost); HDF, human dermal fibroblasts (neonatal); HaCaT, human keratinocytes; B16/F10, murine melanoma cells.
Figure 2
Figure 2
The antioxidant characteristics of KO: Data are presented as the mean ± SD. KO, krill oil (SuperbaTM Boost); L-AA, L-Ascorbic acid; DPPH, 1-Diphenyl-2-picryhydrazyl radical, 2,2-Diphenyl-1-(2,4,6-trinitrophemyl) hydrazyl. ** p < 0.01 as compared with control cells.
Figure 3
Figure 3
Anti-winkle of KO: (a) elastase inhibitory activity; (b) collagen synthesis; (c) MMP-1 activity. Data are presented as the mean ± SD. KO, Krill oil (SuperbaTM Boost); PP, phosphoramidon disodium salt; TGF, transforming growth factor; MMP, matrix metalloproteinase; RA, retinoic acid; UVB, ultraviolet B; HDF, human dermal fibroblasts; * p < 0.05 and ** p < 0.01 as compared with control cells. ## p < 0.01 as compared with UVB-irradiated control cells.
Figure 4
Figure 4
The effects of KO on hyaluronan synthesis: Data are presented as the mean ± SD. KO, krill oil (SuperbaTM Boost); RA, retinoic acid; HaCaT, human keratinocytes; ** p < 0.01 as compared with control cells.
Figure 5
Figure 5
Body weight changes on the days after UVB irradiation and oral administration: KO (100, 200, and 400 mg/kg) or L-AA (100 mg/kg) was orally administrated once a day for 105 days after 1 h of UVB irradiation. The body weights were measured every week. Data are presented as the mean ± SD (n = 10, significance compared with intact control mice).
Figure 6
Figure 6
Effects of KO on UVB-induced wrinkle formation in dorsal back skin: (a) Photograph of dorsal back skin (upper), monochrome image of skin replicas (lower). Scale bars indicate 10 mm. Wrinkle shadows were generated using an optic light source by a fixed intensity at a 40° angle.; (b,c) Wrinkle length and depth; (d) Skin water content (6 mm-diameter skin); (e) Skin COL1 content (%, relative to intact); (f) Skin hyaluronic acid content; (g) COL1 synthetic (COL1A1 and COL1A2) in dorsal back skin tissue; (h) Hyaluronic acid synthesis (Has1, Has2, and Has3) in dorsal back skin tissue; (i) Transforming growth factor (TGF)-β1 gene expression in dorsal back skin tissue; (j) MMP (MMP-1, MMP-9, and MMP13) gene expression in dorsal back skin tissue. Data are presented as the mean ± SD (n = 10, significance difference vs. intact control; * p < 0.05, ** p < 0.01, vs. UVB-irradiated control mice; # p < 0.05, ## p < 0.01).
Figure 6
Figure 6
Effects of KO on UVB-induced wrinkle formation in dorsal back skin: (a) Photograph of dorsal back skin (upper), monochrome image of skin replicas (lower). Scale bars indicate 10 mm. Wrinkle shadows were generated using an optic light source by a fixed intensity at a 40° angle.; (b,c) Wrinkle length and depth; (d) Skin water content (6 mm-diameter skin); (e) Skin COL1 content (%, relative to intact); (f) Skin hyaluronic acid content; (g) COL1 synthetic (COL1A1 and COL1A2) in dorsal back skin tissue; (h) Hyaluronic acid synthesis (Has1, Has2, and Has3) in dorsal back skin tissue; (i) Transforming growth factor (TGF)-β1 gene expression in dorsal back skin tissue; (j) MMP (MMP-1, MMP-9, and MMP13) gene expression in dorsal back skin tissue. Data are presented as the mean ± SD (n = 10, significance difference vs. intact control; * p < 0.05, ** p < 0.01, vs. UVB-irradiated control mice; # p < 0.05, ## p < 0.01).
Figure 7
Figure 7
Effects of KO on UVB-induced skin inflammation: (a) Skin edema (weight of 6mm diameter skin sample); (b) Myeloperoxidase (MPO) activities for skin neutrophil content; (c) IL-1β and IL-10 levels in dorsal back skin tissue.; (d) p38 mitogen-activated protein kinase (p38 MAPK) gene expression in dorsal back skin tissue; (e) protein kinase B (AKT) gene expression. Data are presented as the mean ± SD (n = 10, significance difference vs. intact control; * p < 0.05, ** p < 0.01, vs. UVB-irradiated control mice; # p < 0.05, ## p < 0.01).
Figure 7
Figure 7
Effects of KO on UVB-induced skin inflammation: (a) Skin edema (weight of 6mm diameter skin sample); (b) Myeloperoxidase (MPO) activities for skin neutrophil content; (c) IL-1β and IL-10 levels in dorsal back skin tissue.; (d) p38 mitogen-activated protein kinase (p38 MAPK) gene expression in dorsal back skin tissue; (e) protein kinase B (AKT) gene expression. Data are presented as the mean ± SD (n = 10, significance difference vs. intact control; * p < 0.05, ** p < 0.01, vs. UVB-irradiated control mice; # p < 0.05, ## p < 0.01).
Figure 8
Figure 8
Effects of KO on UVB-induced oxidative stress: (a) GSH contents in the skin tissue; (b) MDA level in the skin tissue; (c) Superoxide anion production in the skin tissue; (d) GSH reductase mRNA expression level in the dorsal back skin tissue; (e) NOX2 mRNA expression level in the dorsal back skin tissue. Data are presented as the mean ± SD (n = 10, significance difference vs. intact control; * p < 0.05, ** p < 0.01, vs. UVB-irradiated control mice; # p < 0.05, ## p < 0.01).
Figure 8
Figure 8
Effects of KO on UVB-induced oxidative stress: (a) GSH contents in the skin tissue; (b) MDA level in the skin tissue; (c) Superoxide anion production in the skin tissue; (d) GSH reductase mRNA expression level in the dorsal back skin tissue; (e) NOX2 mRNA expression level in the dorsal back skin tissue. Data are presented as the mean ± SD (n = 10, significance difference vs. intact control; * p < 0.05, ** p < 0.01, vs. UVB-irradiated control mice; # p < 0.05, ## p < 0.01).
Figure 9
Figure 9
(a) Representative images of stained skin with tissue with hematoxylin and eosin or Masson’s trichrome (MT). Arrows indicate microfolds in skin epithelial surface. Scale bars indicate 200 µm. (b) Immuno-stained skin tissue using nitrotyrosine (NT), 4-hydroxynonenal (4-HNE), cleaved caspase-3, cleaved PARP, and MMP9 antibodies. Scale bars indicate 100 µm. EP, epithelium; DE, dermis; CM, cutaneous muscle; SE, sebaceous gland; AC, adipocyte; Th, thickness.

Similar articles

Cited by

References

    1. Kolarsick P.A., Kolarsick M.A., Goodwin C. Anatomy and physiology of the skin. JDNA. 2011;3:203–213. doi: 10.1097/JDN.0b013e3182274a98. - DOI
    1. McKnight G., Shah J., Hargest R. Physiology of the skin. Surgery. 2022;40:8–12. doi: 10.1016/j.mpsur.2021.11.005. - DOI
    1. Slominski A., Wortsman J. Neuroendocrinology of the skin. Endocr. Rev. 2000;21:457–487. doi: 10.1210/er.21.5.457. - DOI - PubMed
    1. Juzeniene A., Moan J. Beneficial effects of UV radiation other than via vitamin D production. Derm. Endocrinol. 2012;4:109–117. doi: 10.4161/derm.20013. - DOI - PMC - PubMed
    1. Narayanan D.L., Saladi R.N., Fox J.L. Ultraviolet radiation and skin cancer. Int. J. Dermatol. 2010;49:978–986. doi: 10.1111/j.1365-4632.2010.04474.x. - DOI - PubMed