

Perturbations of Glutathione and Sphingosine Metabolites in Port Wine Birthmark Patient-Derived Induced Pluripotent Stem Cells
- PMID: 37755263
- PMCID: PMC10537749
- DOI: 10.3390/metabo13090983
Perturbations of Glutathione and Sphingosine Metabolites in Port Wine Birthmark Patient-Derived Induced Pluripotent Stem Cells
Abstract
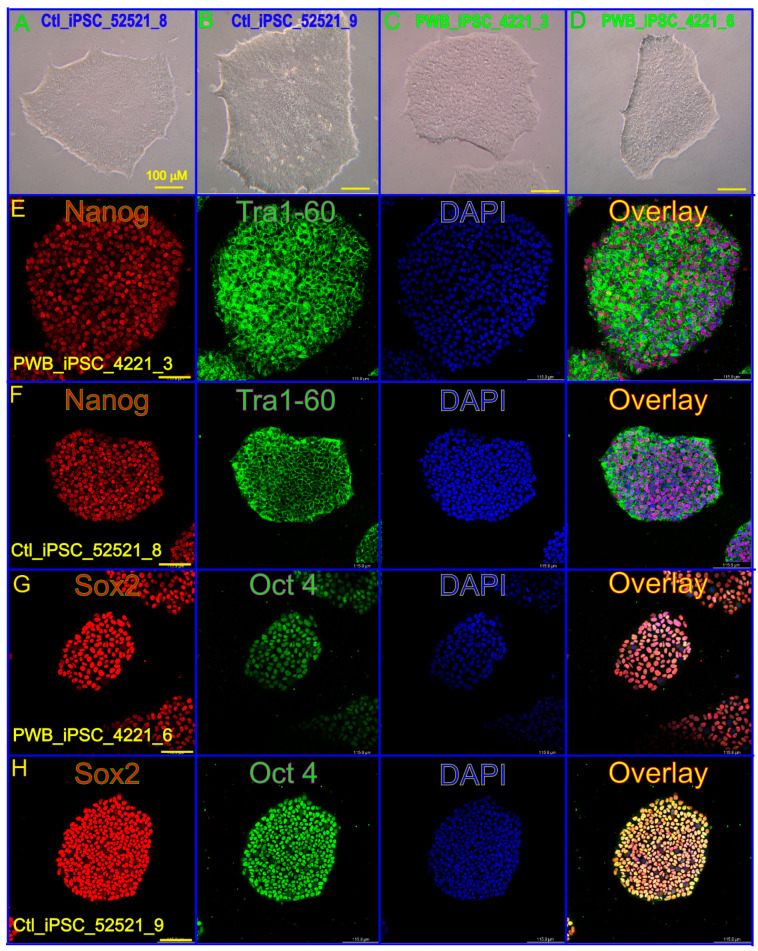
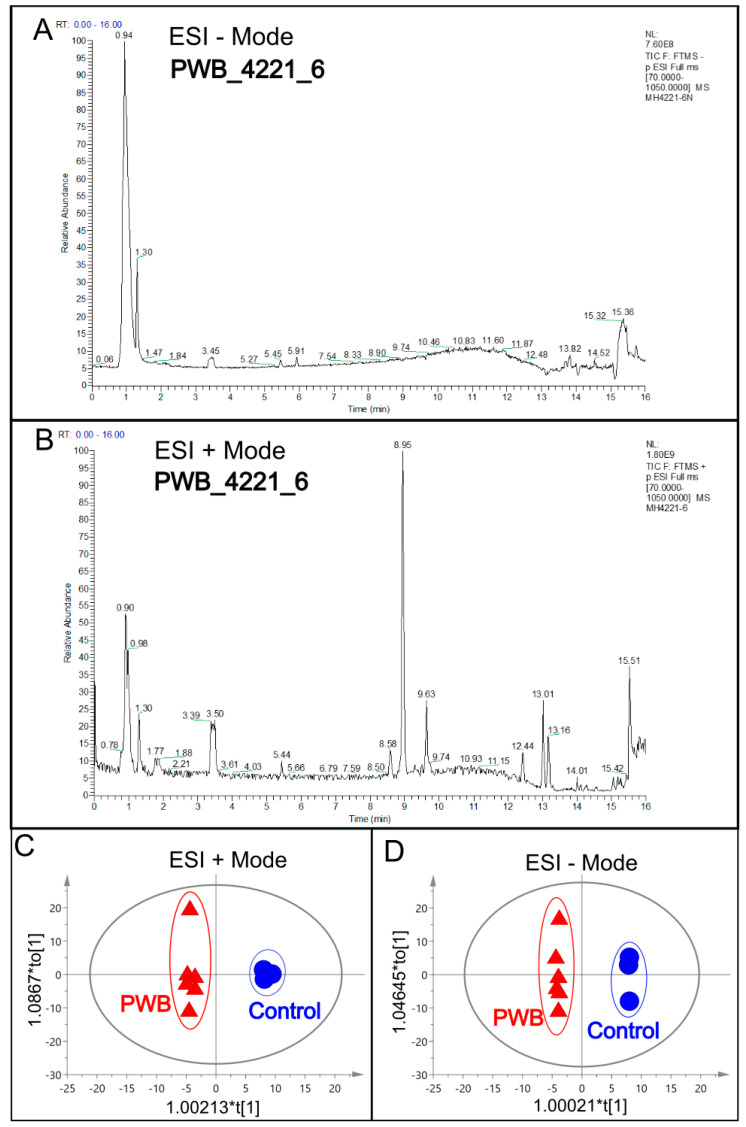
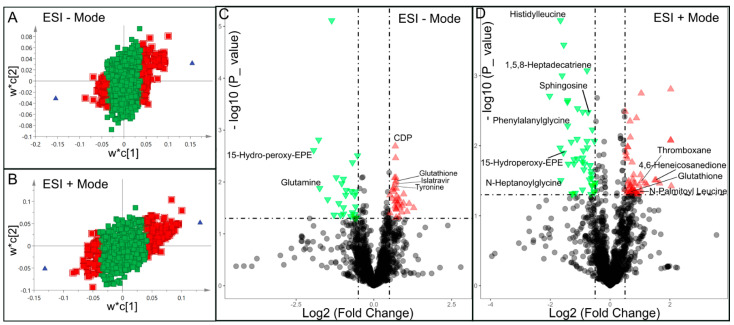
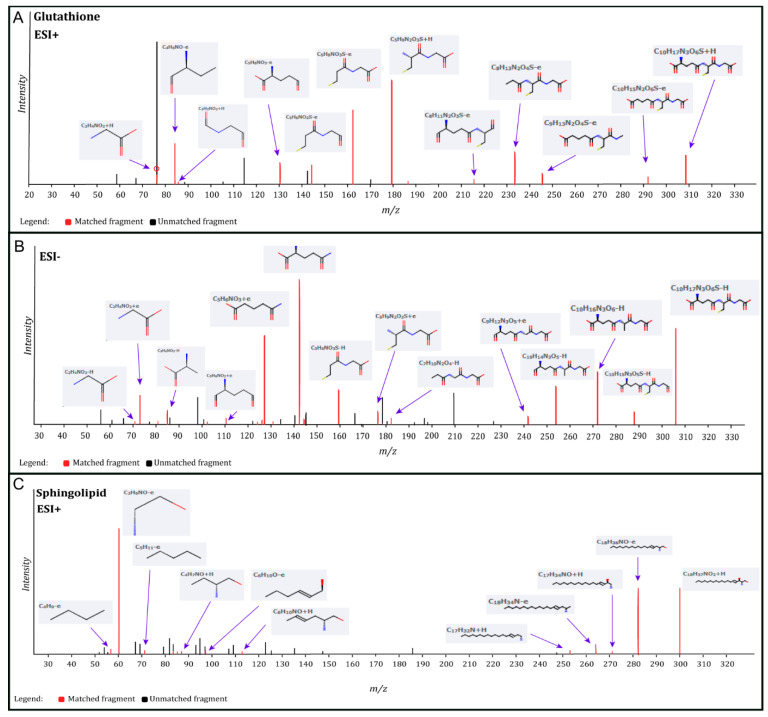
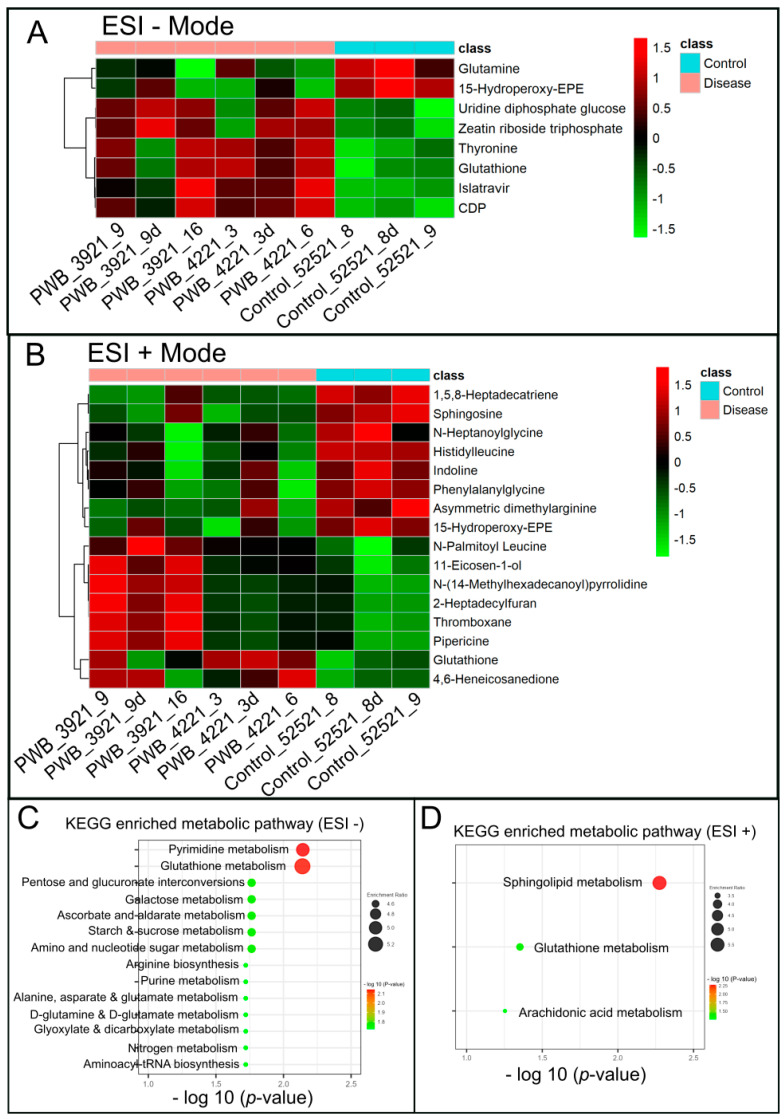
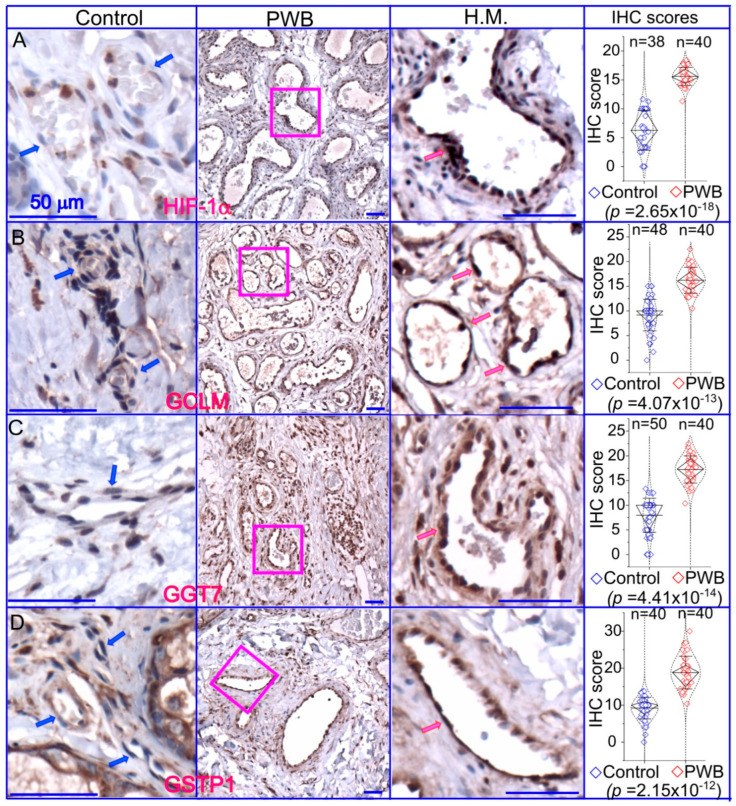
Port Wine Birthmarks (PWBs) are a congenital vascular malformation on the skin, occurring in 1-3 per 1000 live births. We have recently generated PWB-derived induced pluripotent stem cells (iPSCs) as clinically relevant disease models. The metabolites associated with the pathological phenotypes of PWB-derived iPSCs are unknown, and so we aim to explore them in this study. Metabolites were separated by ultra-performance liquid chromatography and screened with electrospray ionization mass spectrometry. Orthogonal partial least-squares discriminant, multivariate, and univariate analyses were used to identify differential metabolites (DMs). KEGG analysis was used to determine the enrichment of metabolic pathways. A total of 339 metabolites was identified. There were 22 DMs, among which nine were downregulated-including sphingosine-and 13 were upregulated, including glutathione in PWB iPSCs, as compared to controls. Pathway enrichment analysis confirmed the upregulation of glutathione and the downregulation of sphingolipid metabolism in PWB-derived iPSCs as compared to normal ones. We next examined the expression patterns of the key molecules associated with glutathione metabolism in PWB lesions. We found that hypoxia-inducible factor 1α (HIF1α), glutathione S-transferase Pi 1 (GSTP1), γ-glutamyl transferase 7 (GGT7), and glutamate cysteine ligase modulatory subunit (GCLM) were upregulated in PWB vasculatures as compared to blood vessels in normal skin. Other significantly affected metabolic pathways in PWB iPSCs included pentose and glucuronate interconversions; amino sugar and nucleotide sugars; alanine, aspartate, and glutamate; arginine, purine, D-glutamine, and D-glutamate; arachidonic acid, glyoxylate, and dicarboxylate; nitrogen, aminoacyl-tRNA biosynthesis, pyrimidine, galactose, ascorbate, and aldarate; and starch and sucrose. Our data demonstrated that there were perturbations in sphingolipid and cellular redox homeostasis in PWB vasculatures, which could facilitate cell survival and pathological progression. Our data implied that the upregulation of glutathione could contribute to laser-resistant phenotypes in some PWB vasculatures.
Keywords: Port Wine Birthmark; glutathione; hypoxia; induced pluripotent stem cells; metabolome; sphingolipid; sphingosine.
Conflict of interest statement
The authors declare no conflict of interest.
Figures
Update of
-
Perturbations of glutathione and sphingosine metabolites in Port Wine Birthmark patient-derived induced pluripotent stem cells.bioRxiv [Preprint]. 2023 Jul 19:2023.07.18.549581. doi: 10.1101/2023.07.18.549581. bioRxiv. 2023. Update in: Metabolites. 2023 Aug 31;13(9):983. doi: 10.3390/metabo13090983. PMID: 37503303 Free PMC article. Updated. Preprint.
Similar articles
-
Perturbations of glutathione and sphingosine metabolites in Port Wine Birthmark patient-derived induced pluripotent stem cells.bioRxiv [Preprint]. 2023 Jul 19:2023.07.18.549581. doi: 10.1101/2023.07.18.549581. bioRxiv. 2023. Update in: Metabolites. 2023 Aug 31;13(9):983. doi: 10.3390/metabo13090983. PMID: 37503303 Free PMC article. Updated. Preprint.
-
Supporting materials: Endothelial cells differentiated from patient dermal fibroblast-derived induced pluripotent stem cells resemble vascular malformations of Port Wine Birthmark.bioRxiv [Preprint]. 2023 Aug 24:2023.07.02.547408. doi: 10.1101/2023.07.02.547408. bioRxiv. 2023. Update in: Br J Dermatol. 2023 Nov 16;189(6):780-783. doi: 10.1093/bjd/ljad330. PMID: 37662218 Free PMC article. Updated. Preprint.
-
Analysis of port-wine birthmark vascular characteristics by location: Utility of optical coherence tomography mapping.Lasers Surg Med. 2022 Jan;54(1):98-104. doi: 10.1002/lsm.23496. Epub 2021 Dec 9. Lasers Surg Med. 2022. PMID: 34888897
-
Port-wine Birthmarks: Update on Diagnosis, Risk Assessment for Sturge-Weber Syndrome, and Management.Pediatr Rev. 2022 Sep 1;43(9):507-516. doi: 10.1542/pir.2021-005437. Pediatr Rev. 2022. PMID: 36045161 Review.
-
Metabolic remodeling during somatic cell reprogramming to induced pluripotent stem cells: involvement of hypoxia-inducible factor 1.Inflamm Regen. 2020 May 12;40:8. doi: 10.1186/s41232-020-00117-8. eCollection 2020. Inflamm Regen. 2020. PMID: 32426078 Free PMC article. Review.
Cited by
-
Establishment of a Human iPSC Line from Mucolipidosis Type II That Expresses the Key Markers of the Disease.Int J Mol Sci. 2025 Apr 19;26(8):3871. doi: 10.3390/ijms26083871. Int J Mol Sci. 2025. PMID: 40332602 Free PMC article.
References
-
- Lever W.F., Schaumburg-Lever G. Histopathology of the Skin. J.B. Lippincott Co.; Philadelphia, PA, USA: 1990.
-
- ISSVA Issva Classification of Vascular Anomalies. International Society for the Study of Vascular Anomalies. 2014. [(accessed on 21 May 2022)]. Available online: https://www.issva.org/classification.
Grants and funding
LinkOut - more resources
Full Text Sources
Research Materials
Miscellaneous
