. 2023 Sep 21;13(9):1028.
doi: 10.3390/metabo13091028.

Early Weaning Possibly Increases the Activity of Lipogenic and Adipogenic Pathways in Intramuscular Adipose Tissue of Nellore Calves

Affiliations

Early Weaning Possibly Increases the Activity of Lipogenic and Adipogenic Pathways in Intramuscular Adipose Tissue of Nellore Calves

Ariane Enara Pedro et al. Metabolites. .

Abstract

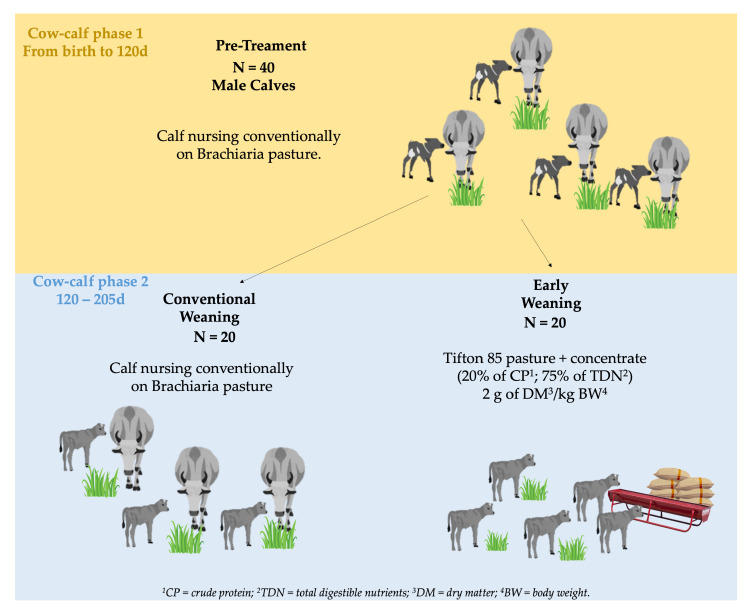
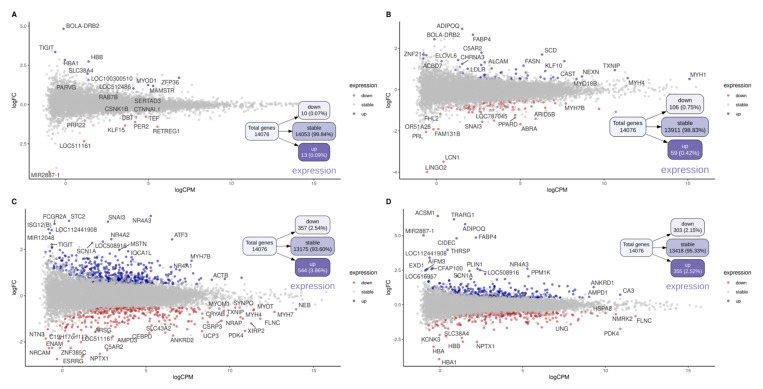
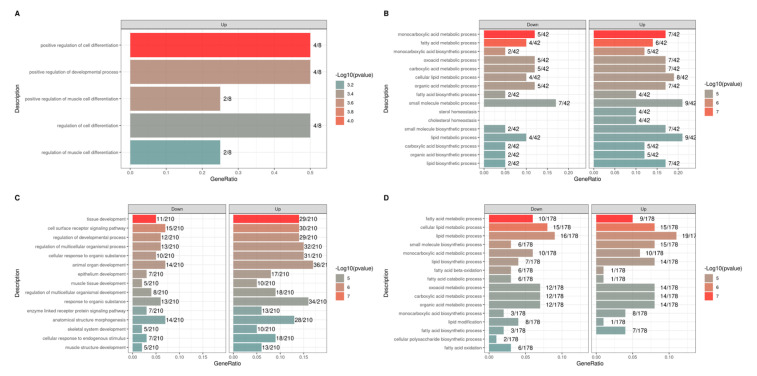
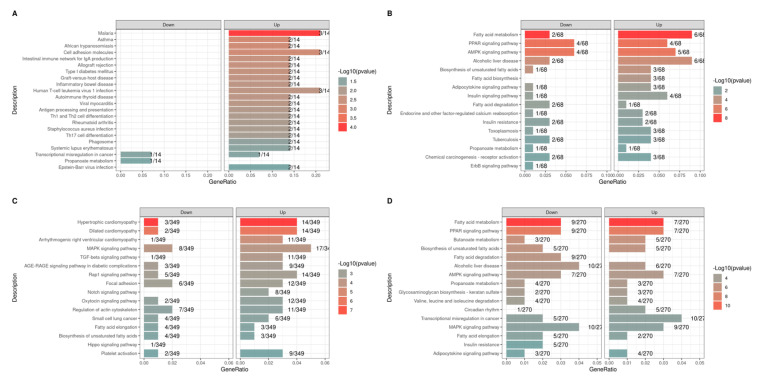
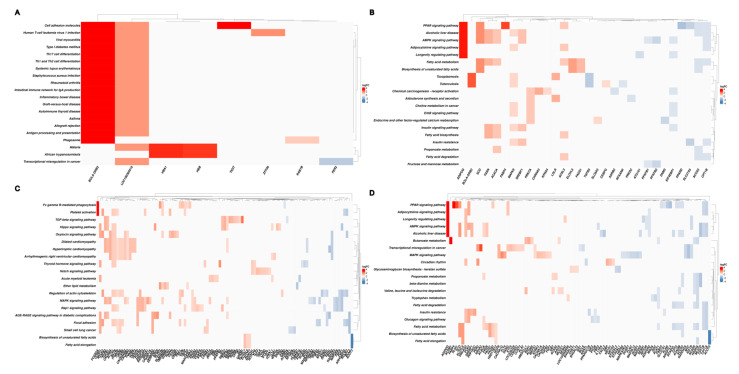
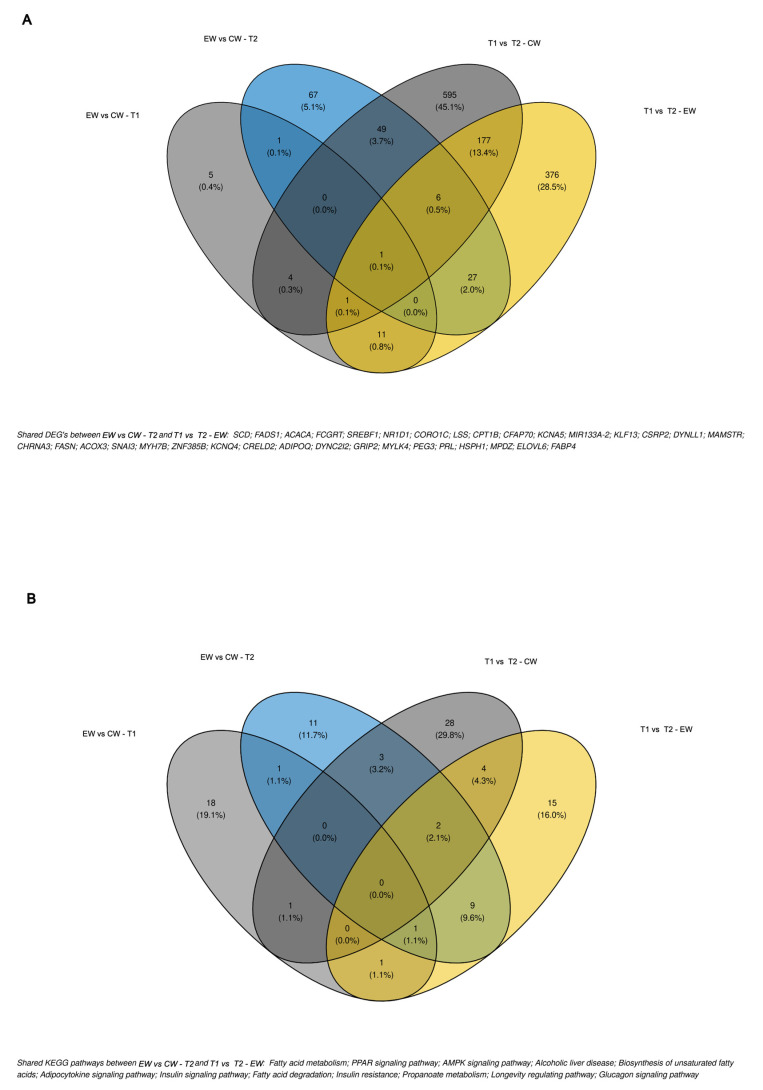
This study aimed to evaluate by wide-expression profile analysis how early weaning at 120 days can alter the skeletal muscle metabolism of calves supplemented with a concentrated diet until the growth phase. Longissimus thoracis muscle samples were obtained by biopsy from two groups of calves, early weaned (EW; n = 8) and conventionally weaned (CW; n = 8) at two different times (120 days of age-T1 [EW] and 205 days of age-T2 [CW]). Next, differential gene expression analysis and functional enrichment of metabolic pathways and biological processes were performed. The results showed respectively 658 and 165 differentially expressed genes when T1 and T2 were contrasted in the early weaning group and when early and conventionally weaned groups were compared at T2. The FABP4, SCD1, FASN, LDLR, ADIPOQ, ACACA, PPARD, and ACOX3 genes were prospected in both comparisons described above. Given the key role of these differentially expressed genes in lipid and fatty acid metabolism, the results demonstrate the effect of diet on the modulation of energy metabolism, particularly favoring postnatal adipogenesis and lipogenesis, as well as a consequent trend in obtaining better quality cuts, as long as an environment for the maintenance of these alterations until adulthood is provided.

Keywords: RNA-Seq; functional enrichment; gene expression.


Conflict of interest statement

The authors declare no conflict of interest.

Figures

Figure 1
Figure 1
Supplementation and diets consisting of natural forage, soybean meal, corn, additives, and minerals are offered to Nellore cattle at different developmental stages and subjected to different weaning protocols.
Figure 2
Figure 2
MD plot of different contrasts between the early weaning (EW), conventional weaning (CW), time 1 (T1), and time 2 (T2) groups. MDplot containing general expression normalised (logCPM) (x-axis), Fold Change (logCPM) (y-axis) and significative up- and down regulated differentially expressed genes(blue or red dots, respectivelly). The total number and percentage of genes and DEGs prospected are represented into boxes in treeplot for each contrasts: early weaning (EW) vs. conventional weaning (CW) at time 1 (T1) (A) and time 2 (T2) (B), and T1 vs. T2 within EW (C), and CW (D).
Figure 3
Figure 3
Biological process terms (BP) enriched from combined up- and downregulated DEGs in each contrast test: early weaning (EW) vs. conventional weaning (CW) at time 1 (T1) (A) and time 2 (T2) (B), and T1 vs. T2 within EW (C), and CW (D).
Figure 4
Figure 4
KEGG pathways enriched from combined up- and downregulated DEGs in each contrast test: early weaning (EW) vs. conventional weaning (CW) at time 1 (T1) (A) and time 2 (T2) (B), and T1 vs. T2 within EW (C) and CW (D).
Figure 5
Figure 5
Clustergram of enriched KEGG pathways based on log2 (fold change) of up- and downregulated DEGs of different contrasts: early weaning (EW) vs. conventional weaning (CW) at time 1 (T1) (A) and time 2 (T2) (B), and T1 vs. T2 within EW (C) and CW (D).
Figure 6
Figure 6
Venn diagram of shared DEGs (A) and KEGG pathways (B) of all contrast tests and description of DEGs and KEGG pathways shared by EW vs. CW at T2 and T1 vs. T2 in EW. Gray colors are related to contrasts in which none of the groups were affected by the treatment. The blue color indicates contrast between EW and CW treatments at time point 2 and the yellow color indicates contrast comparing EW at time point 1 and 2.

References

    1. Beatty D.T., Barnes A., Taylor E., Pethick D., McCarthy M., Maloney S.K. Physiological responses of Bos taurus and Bos indicus cattle to prolonged, continuous heat and humidity. J. Anim. Sci. 2006;84:972–985. doi: 10.2527/2006.844972x. - DOI - PubMed
    1. Burrow H.M. Importance of adaptation and genotype × environment interactions in tropical beef breeding systems. Animal. 2012;6:729–740. doi: 10.1017/S175173111200002X. - DOI - PubMed
    1. Kemper K.E., Bowman P.J., Pryce J.E., Hayes B.J., Goddard M.E. Long-term selection strategies for complex traits using high-density genetic markers. J. Dairy Sci. 2012;95:4646–4656. doi: 10.3168/jds.2011-5289. - DOI - PubMed
    1. Mrode R., Ojango J.M.K., Okeyo A.M., Mwacharo J.M. Genomic selection and use of molecular tools in breeding programs for indigenous and crossbred cattle in developing countries: Current status and future prospects. Front. Genet. 2019;9:694. doi: 10.3389/fgene.2018.00694. - DOI - PMC - PubMed
    1. Carvalho V.V., Paulino M.F., Detmann E., Valadares Filho S.C., Lopes S.A., Rennó L.N., Sampaio C.B., Silva A.G. A meta-analysis of the effects of creep-feeding supplementation on performance and nutritional characteristics by beef calves grazing on tropical pastures. Livest. Sci. 2019;227:175–182. doi: 10.1016/j.livsci.2019.07.009. - DOI