. 2024 Jan 1;130(1):117-127.
doi: 10.1002/cncr.35026. Epub 2023 Sep 27.

Annual Report to the Nation on the Status of Cancer, part 2: Early assessment of the COVID-19 pandemic's impact on cancer diagnosis

Affiliations

Annual Report to the Nation on the Status of Cancer, part 2: Early assessment of the COVID-19 pandemic's impact on cancer diagnosis

Serban Negoita et al. Cancer. .

Abstract

Background: With access to cancer care services limited because of coronavirus disease 2019 control measures, cancer diagnosis and treatment have been delayed. The authors explored changes in the counts of US incident cases by cancer type, age, sex, race, and disease stage in 2020.

Methods: Data were extracted from selected US population-based cancer registries for diagnosis years 2015-2020 using first-submission data from the North American Association of Central Cancer Registries. After a quality assessment, the monthly numbers of newly diagnosed cancer cases were extracted for six cancer types: colorectal, female breast, lung, pancreas, prostate, and thyroid. The observed numbers of incident cancer cases in 2020 were compared with the estimated numbers by calculating observed-to-expected (O/E) ratios. The expected numbers of incident cases were extrapolated using Joinpoint trend models.

Results: The authors report an O/E ratio <1.0 for major screening-eligible cancer sites, indicating fewer newly diagnosed cases than expected in 2020. The O/E ratios were lowest in April 2020. For every cancer site except pancreas, Asians/Pacific Islanders had the lowest O/E ratio of any race group. O/E ratios were lower for cases diagnosed at localized stages than for cases diagnosed at advanced stages.

Conclusions: The current analysis provides strong evidence for declines in cancer diagnoses, relative to the expected numbers, between March and May of 2020. The declines correlate with reductions in pathology reports and are greater for cases diagnosed at in situ and localized stage, triggering concerns about potential poor cancer outcomes in the coming years, especially in Asians/Pacific Islanders.

Plain language summary: To help control the spread of coronavirus disease 2019 (COVID-19), health care organizations suspended nonessential medical procedures, including preventive cancer screening, during early 2020. Many individuals canceled or postponed cancer screening, potentially delaying cancer diagnosis. This study examines the impact of the COVID-19 pandemic on the number of newly diagnosed cancer cases in 2020 using first-submission, population-based cancer registry database. The monthly numbers of newly diagnosed cancer cases in 2020 were compared with the expected numbers based on past trends for six cancer sites. April 2020 had the sharpest decrease in cases compared with previous years, most likely because of the COVID-19 pandemic.

Keywords: cancer incidence; cancer stage; cancer surveillance; coronavirus disease 2019 (COVID-19); observed-to-expected; pathology reports.


Conflict of interest statement

Conflict of Interest Statement

The other authors have no conflicts of interest to disclose.

Figures

Figure 1.
Figure 1.
Observed-to-expected ratio for newly diagnosed cancer cases, diagnosis year 2020, by month of diagnosis and cancer site The observed 2020 count was compared to the expected count by ratio (O/E ratio). The standard error for the ratio was obtained by the delta method, which was used to determine the p-value and 95% confidence interval for each O/E ratio. Data source for observed counts: SEER*Stat Database: NAACCR Incidence Data - Certification year and 12-month data, 2014–2020, for U.S. (which includes data from CDC’s National Program of Cancer Registries (NPCR), CCR’s Provincial and Territorial Registries, and NCI’s Surveillance, Epidemiology, and End Results (SEER) Program Registries), certified by the North American Association of Central Cancer Registries (NAACCR) as meeting high-quality incidence data standards for the specified time periods, submitted December 2021.
Figure 2.
Figure 2.
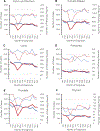
Monthly number of reportable biopsy pathology reports vs. newly diagnosed cancer cases by cancer site in 2019 and 2020 The frequency distribution of cases are compared to the frequency distribution of reportable biopsy pathology reports in 2019 and 2020 by month of diagnosis for 6 cancer sites. SEER*Stat Database: NAACCR Incidence Data - Certification year and 12-month data, 2014–2020, for U.S. (which includes data from CDC’s National Program of Cancer Registries (NPCR), CCR’s Provincial and Territorial Registries, and the NCI’s Surveillance, Epidemiology, and End Results (SEER) Program Registries), certified by the North American Association of Central Cancer Registries (NAACCR) as meeting high-quality incidence data standards for the specified time periods, submitted December 2021.
Figure 3.
Figure 3.
Sex-specific observed-to-expected ratio for newly diagnosed cancer cases by cancer site in 2020 The observed 2020 count was compared to the expected count by ratio (O/E ratio). The standard error for the ratio was obtained by the delta method, which was used to determine the p-value and 95% confidence interval for each O/E ratio. Data source for observed counts: SEER*Stat Database: NAACCR Incidence Data - Certification year and 12-month data, 2014–2020, for U.S. (which includes data from CDC’s National Program of Cancer Registries (NPCR), CCR’s Provincial and Territorial Registries, and NCI’s Surveillance, Epidemiology, and End Results (SEER) Program Registries), certified by the North American Association of Central Cancer Registries (NAACCR) as meeting high-quality incidence data standards for the specified time periods, submitted December 2021.
Figure 4.
Figure 4.
Race-specific observed-to-expected ratio for newly diagnosed cancer cases by cancer site in 2020 Abbreviations. API, Asian or Pacific Islander, AIAN, American Indian or Alaska Native The observed 2020 case count was compared to the expected count by ratio (O/E ratio). The standard error for the ratio was obtained by the delta method, which was used to determine the p-value and 95% confidence interval for each O/E ratio. Data source for observed counts: SEER*Stat Database: NAACCR Incidence Data - Certification year and 12-month data, 2014–2020, for U.S. (which includes data from CDC’s National Program of Cancer Registries (NPCR), CCR’s Provincial and Territorial Registries, and NCI’s Surveillance, Epidemiology and End Results (SEER) Program Registries), certified by the North American Association of Central Cancer Registries (NAACCR) as meeting high-quality incidence data standards for the specified time periods, submitted December 2021.
Figure 5.
Figure 5.
Observed- to- expected ratio for newly diagnosed cancer cases in 2020 by age category and cancer site Abbreviations. Yrs, Years The observed 2020 case count was compared to the expected count by ratio (O/E ratio). The standard error for the ratio was obtained by the delta method, which was used to determine the p-value and 95% confidence interval for each O/E ratio. Data source for observed counts: SEER*Stat Database: NAACCR Incidence Data - Certification year and 12-month data, 2014–2020, for U.S. (which includes data from CDC’s National Program of Cancer Registries (NPCR), CCR’s Provincial and Territorial Registries, and NCI’s Surveillance, Epidemiology and End Results (SEER) Program Registries), certified by the North American Association of Central Cancer Registries (NAACCR) as meeting high-quality incidence data standards for the specified time periods, submitted December 2021.

References

    1. CMS Releases Recommendations on Adult Elective Surgeries, Non-Essential Medical, Surgical, and Dental Procedures During COVID-19 Response. CMS. Published online 2020. https://www.cms.gov/newsroom/press-releases/cms-releases-recommendations...
    1. Delayed Cancer Screenings. Epic Res. Published online May 4, 2020. https://epicresearch.org/articles/delays-in-preventive-cancer-screenings...
    1. Mast C, Munos del Rio A. Delayed Cancer Screenings- A Second Look. Epic Res. Published online July 17, 2020. https://epicresearch.org/articles/delayed-cancer-screenings-a-second-look/
    1. COVIDSurg Collaborative. Elective surgery cancellations due to the COVID-19 pandemic: global predictive modelling to inform surgical recovery plans: Elective surgery during the SARS-CoV-2 pandemic. Br J Surg. Published online June 13, 2020. doi:10.1002/bjs.11746 - DOI - PMC - PubMed
    1. Uimonen M, Kuitunen I, Paloneva J, Launonen AP, Ponkilainen V, Mattila VM. The impact of the COVID-19 pandemic on waiting times for elective surgery patients: A multicenter study. den Uil C, ed. PLOS ONE. 2021;16(7):e0253875. doi:10.1371/journal.pone.0253875 - DOI - PMC - PubMed

Publication types