. 2023 Sep 13;11(9):778.
doi: 10.3390/toxics11090778.

Differential Susceptibility to Benzo[a]pyrene Exposure during Gestation and Lactation in Mice with Genetic Variations in the Aryl Hydrocarbon Receptor and Cyp1 Genes

Affiliations

Differential Susceptibility to Benzo[a]pyrene Exposure during Gestation and Lactation in Mice with Genetic Variations in the Aryl Hydrocarbon Receptor and Cyp1 Genes

Mackenzie Feltner et al. Toxics. .

Abstract

Polycyclic aromatic hydrocarbons are ubiquitous air pollutants, with additional widespread exposure in the diet. PAH exposure has been linked to adverse birth outcomes and long-term neurological consequences. To understand genetic differences that could affect susceptibility following developmental exposure to polycyclic aromatic hydrocarbons, we exposed mice with variations in the aryl hydrocarbon receptor and the three CYP1 enzymes from gestational day 10 (G10) to weaning at postnatal day 25 (P25). We found unexpectedly high neonatal lethality in high-affinity AhrbCyp1b1(-/-) knockout mice compared with all other genotypes. Over 60% of BaP-exposed pups died within their first 5 days of life. There was a significant effect of BaP on growth rates in surviving pups, with lower weights observed from P7 to P21. Again, AhrbCyp1b1(-/-) knockout mice were the most susceptible to growth retardation. Independent of treatment, this line of mice also had impaired development of the surface righting reflex. We used high-resolution mass spectrometry to measure BaP and metabolites in tissues from both dams and pups. We found the highest BaP levels in adipose from poor-affinity AhrdCyp1a2(-/-) dams and identified three major BaP metabolites (BaP-7-OH, BaP-9-OH, and BaP-4,5-diol), but our measurements were limited to a single time point. Future work is needed to understand BaP pharmacokinetics in the contexts of gestation and lactation and how differential metabolism leads to adverse developmental outcomes.

Keywords: CYP1A1; CYP1A2; CYP1B1; aryl hydrocarbon receptor; benzo[a]pyrene; neonatal lethality; polycyclic aromatic hydrocarbons.


Conflict of interest statement

The authors have no conflict to declare.

Figures

Figure 1
Figure 1
Dam weights at the beginning and end of BaP treatment. There was a significant effect of genotype at baseline (G10) for poor-affinity AhrdCyp1a2(-/-) dams and at weaning for high-affinity AhrbCyp1a1(-/-) and AhrbCyp1b1(-/-) mice. N = 10–15 litters per group; a = significantly different from C57BL/6J controls; b = significantly different from C57BL/6J; p < 0.05.
Figure 2
Figure 2
Neonatal lethality in BaP-treated wild type and knockout lines. Gestational and lactational treatment with BaP resulted in high litter losses for the AhrbCyp1b1(-/-) line. N = 10–15 litters per group; a = significantly different from C57BL/6J controls; p < 0.01.
Figure 3
Figure 3
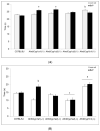
(A) Weight gain in offspring of the control and BaP-exposed offspring. There was a significant main effect of BaP treatment on weight in pups and a slightly slower growth rate in BaP treatment groups. All genotypes are pooled into one treatment group. N = 10–15 litters per genotype; *** p < 0.001. (B) Susceptible genotypes: there was a significant gene x treatment interaction for weight gain. AhrbCyp1a1(-/-), poor-affinity AhrdCyp1a2(-/-) and AhrbCyp1b1(-/-) knockout mice all weighed less than the controls at P7. At P14 and P21, the effects persisted in the AhrbCyp1a1(-/-) and AhrbCyp1b1(-/-) knockout mice. N = 10–15 litters per group; a = significantly different from controls at P7; b = significantly different from controls at P14; c = significantly different from controls at P21; p < 0.001 for all time points.
Figure 3
Figure 3
(A) Weight gain in offspring of the control and BaP-exposed offspring. There was a significant main effect of BaP treatment on weight in pups and a slightly slower growth rate in BaP treatment groups. All genotypes are pooled into one treatment group. N = 10–15 litters per genotype; *** p < 0.001. (B) Susceptible genotypes: there was a significant gene x treatment interaction for weight gain. AhrbCyp1a1(-/-), poor-affinity AhrdCyp1a2(-/-) and AhrbCyp1b1(-/-) knockout mice all weighed less than the controls at P7. At P14 and P21, the effects persisted in the AhrbCyp1a1(-/-) and AhrbCyp1b1(-/-) knockout mice. N = 10–15 litters per group; a = significantly different from controls at P7; b = significantly different from controls at P14; c = significantly different from controls at P21; p < 0.001 for all time points.
Figure 4
Figure 4
Spleen weights at P25. There was a significant gene x treatment interaction, with BaP-exposed C57BL/6J offspring having lower spleen weights, whereas all other genotypes showed no evidence of immune suppression. N = 10–15 litters per group; a = significantly different from corn oil-treated controls; p < 0.05.
Figure 5
Figure 5
(A) Surface righting reflex at P5: impairments were seen in BaP-exposed high-affinity AhrbCyp1a1(-/-), AhrbCyp1a2(-/-), and corn-oil treated AhrbCyp1b1(-/-) mice. N = 10–15 litters per group; a = significantly slower than BaP-treated C57BL/6J mice, p < 0.05; b = significantly slower than corn oil-treated C57BL/6J, p < 0.01. (B) Surface righting reflex at P7: impairments were seen in BaP-exposed high-affinity AhrbCyp1a1(-/-) and all AhrbCyp1b1(-/-) mice. Both groups of AhrdCyp1a2(-/-) mice were faster than the controls. N = 10–15 litters per group; a = significantly slower than all other genotypes, p < 0.001; b = significantly slower than BaP-treated C57BL/6J, p < 0.001; c = significantly faster than BaP-treated C57BL/6J, p < 0.001. (C) Surface righting reflex at P10: impairments were seen in BaP-exposed high-affinity AhrbCyp1a1(-/-) and corn-oil treated AhrbCyp1b1(-/-) mice. In contrast, BaP-exposed AhrbCyp1a2(-/-) mice outperformed controls. N = 10–15 litters per group; a = significantly slower than all other genotypes, p < 0.001; b = significantly faster than BaP-treated C57BL/6J, p < 0.001; c = significantly slower than corn oil-treated AhrbCyp1a1(-/-), p < 0.01.
Figure 5
Figure 5
(A) Surface righting reflex at P5: impairments were seen in BaP-exposed high-affinity AhrbCyp1a1(-/-), AhrbCyp1a2(-/-), and corn-oil treated AhrbCyp1b1(-/-) mice. N = 10–15 litters per group; a = significantly slower than BaP-treated C57BL/6J mice, p < 0.05; b = significantly slower than corn oil-treated C57BL/6J, p < 0.01. (B) Surface righting reflex at P7: impairments were seen in BaP-exposed high-affinity AhrbCyp1a1(-/-) and all AhrbCyp1b1(-/-) mice. Both groups of AhrdCyp1a2(-/-) mice were faster than the controls. N = 10–15 litters per group; a = significantly slower than all other genotypes, p < 0.001; b = significantly slower than BaP-treated C57BL/6J, p < 0.001; c = significantly faster than BaP-treated C57BL/6J, p < 0.001. (C) Surface righting reflex at P10: impairments were seen in BaP-exposed high-affinity AhrbCyp1a1(-/-) and corn-oil treated AhrbCyp1b1(-/-) mice. In contrast, BaP-exposed AhrbCyp1a2(-/-) mice outperformed controls. N = 10–15 litters per group; a = significantly slower than all other genotypes, p < 0.001; b = significantly faster than BaP-treated C57BL/6J, p < 0.001; c = significantly slower than corn oil-treated AhrbCyp1a1(-/-), p < 0.01.
Figure 6
Figure 6
(A) Negative geotaxis at P7: high-affinity AhrbCyp1a1(-/-) and AhrbCyp1a2(-/-) knockouts had the shortest latencies to complete the 180° turn. N = 10–15 litters per group; a = significantly different from all other genotypes, p < 0.001. (B) Negative geotaxis at P10: high-affinity AhrbCyp1a1(-/-) and AhrbCyp1a2(-/-) knockouts had the shortest latencies to complete the 180° turn. N = 10–15 litters per group; a = significantly different from all other genotypes, p < 0.001. (C) Negative geotaxis at P14: high-affinity AhrbCyp1a1(-/-) and AhrbCyp1a2(-/-) knockouts had the shortest latencies to complete the 180° turn. N = 10–15 litters per group; a = significantly different from all other genotypes, p < 0.001.
Figure 6
Figure 6
(A) Negative geotaxis at P7: high-affinity AhrbCyp1a1(-/-) and AhrbCyp1a2(-/-) knockouts had the shortest latencies to complete the 180° turn. N = 10–15 litters per group; a = significantly different from all other genotypes, p < 0.001. (B) Negative geotaxis at P10: high-affinity AhrbCyp1a1(-/-) and AhrbCyp1a2(-/-) knockouts had the shortest latencies to complete the 180° turn. N = 10–15 litters per group; a = significantly different from all other genotypes, p < 0.001. (C) Negative geotaxis at P14: high-affinity AhrbCyp1a1(-/-) and AhrbCyp1a2(-/-) knockouts had the shortest latencies to complete the 180° turn. N = 10–15 litters per group; a = significantly different from all other genotypes, p < 0.001.
Figure 7
Figure 7
(A,B) Sample chromatograms for benzo[a]pyrene. (A) Chromatograms from the BaP mass channel (252.097 m/z) for all studied genotypes. All samples are from adipose tissue. (B) Chromatograms from the BaP mass channel (252.097 m/z) from a BaP in acetonitrile standard (purple) and samples from all four tissue types (adipose in black, liver in green, cerebellum in red, and cortex in blue) from the same AhrdCyp1a2(-/-) pup.
Figure 8
Figure 8
(A) Example chromatograms showing the probable detection of BaP metabolites in AhrdCyp1a2(-/-) liver (red) and adipose (orange) samples. Standards for BaP-7-OH (blue) and BaP-9-OH (black) are shown. (B) Example chromatograms showing the probable detection of the BaP-4,5-diol metabolite in a C57B/6J cerebellum (CB) sample (red) and the standards for the metabolite (black).

Similar articles

References

    1. ATSDR Polycyclic Aromatic Hydrocarbons (PAHs)|ToxFAQsTM|ATSDR. [(accessed on 12 July 2023)]; Available online: https://wwwn.cdc.gov/TSP/ToxFAQs/ToxFAQsDetails.aspx?faqid=121&toxid=25.
    1. ATSDR Substance Priority List|ATSDR. [(accessed on 1 August 2023)]; Available online: https://www.atsdr.cdc.gov/spl/index.html.
    1. Augusto S., Pereira M.J., Máguas C., Soares A., Branquinho C. Assessing Human Exposure to Polycyclic Aromatic Hydrocarbons (PAH) in a Petrochemical Region Utilizing Data from Environmental Biomonitors. J. Toxicol. Environ. Health A. 2012;75:819–830. doi: 10.1080/15287394.2012.690685. - DOI - PubMed
    1. Yang L., Zhang H., Zhang X., Xing W., Wang Y., Bai P., Zhang L., Hayakawa K., Toriba A., Tang N. Exposure to Atmospheric Particulate Matter-Bound Polycyclic Aromatic Hydrocarbons and Their Health Effects: A Review. Int. J. Environ. Res. Public Health. 2021;18:2177. doi: 10.3390/ijerph18042177. - DOI - PMC - PubMed
    1. EPA Climate Change Indicators: Wildfires. [(accessed on 13 July 2023)]; Available online: https://www.epa.gov/climate-indicators/climate-change-indicators-wildfires.

LinkOut - more resources