. 2023 Sep 20;15(9):581.
doi: 10.3390/toxins15090581.

Patulin Stimulates Progenitor Leydig Cell Proliferation but Delays Its Differentiation in Male Rats during Prepuberty

Affiliations

Patulin Stimulates Progenitor Leydig Cell Proliferation but Delays Its Differentiation in Male Rats during Prepuberty

Huitao Li et al. Toxins (Basel). .

Abstract

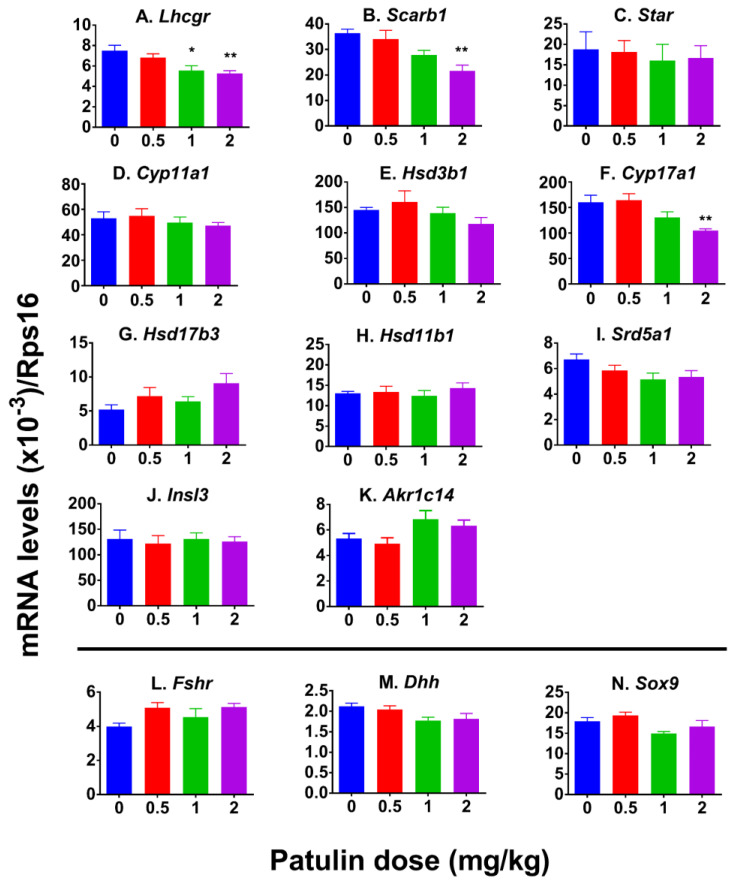
Patulin is a mycotoxin with potential reproductive toxicity. We explored the impact of patulin on Leydig cell (LC) development in male rats. Male Sprague Dawley rats (21 days postpartum) were gavaged patulin at doses of 0.5, 1, and 2 mg/kg/day for 7 days. Patulin markedly lowered serum testosterone at ≥0.5 mg/kg and progesterone at 1 and 2 mg/kg, while increasing LH levels at 2 mg/kg. Patulin increased the CYP11A1+ (cholesterol side-chain cleavage, a progenitor LC biomarker) cell number and their proliferation at 1 and 2 mg/kg. Additionally, patulin downregulated Lhcgr (luteinizing hormone receptor), Scarb1 (high-density lipoprotein receptor), and Cyp17a1 (17α-hydroxylase/17,20-lyase) at 1 and 2 mg/kg. It increased the activation of pAKT1 (protein kinase B), pERK1/2 (extracellular signal-related kinases 1 and 2), pCREB (cyclic AMP response binding protein), and CCND1 (cyclin D1), associated with cell cycle regulation, in vivo. Patulin increased EdU incorporation into R2C LC and stimulated cell cycle progression in vitro. Furthermore, patulin showed a direct inhibitory effect on 11β-HSD2 (11β-hydroxysteroid dehydrogenase 2) activity, which eliminates the adverse effects of glucocorticoids. This study provides insights into the potential mechanisms via which patulin affects progenitor LC development in young male rats.

Keywords: cell cycle; mycotoxin; progesterone; steroidogenesis; testosterone.


Conflict of interest statement

The authors declare no conflict of interest.

Figures

Figure 2
Figure 2
The effect of LC and Sertoli cell numbers after in vivo patulin exposure. (AD): CYP11A1+ LCs; (EH): HSD11B1+ LCs; (IL): SOX9+ Sertoli cells. (A,E,I): control; (B,F,J): 0.5 mg/kg/day patulin; (C,G,K): 1 mg/kg/day patulin; (D,H,L): 2 mg/kg/day patulin; (M,N,O): quantitative results. Means ± SEM; n = 6 (randomly selected). * p < 0.05 and ** p < 0.01 show significant differences from the vehicle control. Black arrows designate LCs. Green arrowheads designate Sertoli cells. Scale bar = 50 μm.
Figure 3
Figure 3
Immunofluorescence staining of LC proliferation biomarker from rat testis after in vivo patulin exposure. (AD): Immunofluorescence images of sections from rat testis after exposure to different doses of patulin (0, 0.5, 1, and 2 mg/kg/day). Each panel represents a different patulin concentration. (EH): Enlarged images of specific regions within (AD), indicated by yellow squares, highlighting the staining of PCNA (red—nucleus, proliferation biomarker) and CYP11A1 (green—cytoplasm, LC biomarker) and DAPI (blue—nucleus, counterstain). (I): Quantitative data for PCNA labeling (white arrow) of LCs. Means ± SEM; n = 6. * p < 0.05 shows a significant difference from the vehicle control. Scale bar = 20 μm.
Figure 4
Figure 4
Effects of patulin on mRNA expression in rat testis after in vivo patulin exposure. The testicular mRNA levels were measured using qPCR and adjusted to CYP11A1+ LC number for LC genes. (AK): LC genes (Lhcgr, Scarb1, Star, Cyp11a1, Hsd3b1, Cyp17a1, Hsd17b3, Hsd11b1, Srd5a1, Insl3, and Akr1c14); (LN): Sertoli cell genes (Fshr, Dhh, and Sox9). Means ± SEM; n = 6. * p < 0.05 and ** p < 0.01 show significant differences from vehicle control.
Figure 5
Figure 5
Levels of LC proteins in the testis after in vivo patulin exposure. (A): Western blot image; (BD): Quantification of protein levels of LHCGR, SCARB1, CYP17A1 after normalized to ACTB (internal control). Mean ± SEM, n = 3–7 (randomly selected samples). * p < 0.05, ** p < 0.01, and *** p < 0.001 show significant differences from vehicle control.
Figure 6
Figure 6
Levels of signal proteins in the testis after in vivo patulin exposure. (A): Western blot image; (BG): quantitative results. Protein levels were adjusted to ACTB (internal control). Means ± SEM; n = 4–9 (randomly selected testis samples). * p < 0.05, ** p < 0.01, and *** p < 0.001 show significant differences from vehicle control.
Figure 1
Figure 1
Structure of patulin, regimen, and hormonal levels. Chemical structure of patulin (A); regimen of patulin (B) (in vivo, including Figure 1, Figure 2, Figure 3, Figure 4, Figure 5 and Figure 6); and serum testosterone (T) (C), progesterone (P4) (D), LH (E), T/LH ratio (F), P4/LH ratio (G), FSH (H), estradiol (E2) (I), and T/E2 ratio (J) levels. Means ± SEM; n = 6. * p < 0.05, ** p < 0.01, and *** p < 0.001 show significant differences from the vehicle control.
Figure 7
Figure 7
Patulin in vitro treatment regimen and cell viability, testosterone levels, and cell cycle analysis of R2C cells after patulin treatment for 24 h. (A): regimen; (B): cell viability (CCK8); (C): medium testosterone; (D): flow cytometry analysis of cell cycle; (EH): quantification for G0/G1, S, G2/M, and S + G2/M phase populations, respectively. Means ± SEM; n = 3. * p < 0.05 and ** p < 0.01 show significant differences from the control.
Figure 8
Figure 8
EdU incorporation into proliferative R2C cells after patulin in vitro treatment. (A): EdU (green nucleus), CYP11A1 (red cytoplasm), and DAPI (blue counterstain) in R2C cells after patulin treatment; (B): quantification of EdU labeling in R2C cells. Means ± SEM; n = 3. ** p < 0.01 shows a significant difference from the control.
Figure 9
Figure 9
Patulin’s inhibition, IC50, dithiothreitol (DTT) effect, and docking analysis of rat and human 11β-HSD2 enzymes. (A,F): Inhibition by patulin of rat and human 11β-HSD2, respectively; (B,G): IC50 values for patulin for rat 11β-HSD2 and human 11β-HSD2, respectively; (C,H): effects of DTT on patulin-induced inhibition of rat and human 11β-HSD2, respectively. (D,I): Superimposed images of rat or human 11β-HSD2 with patulin and substrate cortisol, respectively. Red = patulin; blue = substrate cortisol. (E,J): Superimposed images of rat or human 11β-HSD2 with patulin and substrate cortisol, respectively. Purple = patulin, cyan = substrate cortisol, red circle = common contacting residues, and green dash line = hydrogen bonds. The Ki and ΔG values obtained through docking analysis are displayed beneath the panels of the figure, respectively, which contain the 3D/2D superimposed images. Means ± SEM; n = 4. * p < 0.05, ** p < 0.01, and *** p < 0.001 show significant differences from the control.
Figure 10
Figure 10
The mechanism of patulin action on main proteins in this study.

Similar articles

References

    1. Bacha S.A.S., Li Y., Nie J., Xu G., Han L., Farooq S. Comprehensive review on patulin and Alternaria toxins in fruit and derived products. Front. Plant Sci. 2023;14:1139757. doi: 10.3389/fpls.2023.1139757. - DOI - PMC - PubMed
    1. Saleh I., Goktepe I. The characteristics, occurrence, and toxicological effects of patulin. Food Chem. Toxicol. 2019;129:301–311. doi: 10.1016/j.fct.2019.04.036. - DOI - PubMed
    1. Zhong L., Carere J., Lu Z., Lu F., Zhou T. Patulin in Apples and Apple-Based Food Products: The Burdens and the Mitigation Strategies. Toxins. 2018;10:475. doi: 10.3390/toxins10110475. - DOI - PMC - PubMed
    1. Guerra-Moreno A., Hanna J. Induction of proteotoxic stress by the mycotoxin patulin. Toxicol. Lett. 2017;276:85–91. doi: 10.1016/j.toxlet.2017.05.015. - DOI - PMC - PubMed
    1. Zhang T., Yan M., Hou X., Chang M., Song W., Yue T. Identification of mouse metabolic variations related to patulin-induced acute and subacute hepatotoxicity by ultra-high-performance liquid chromatography high-resolution mass spectrometry. Food Res. Int. 2023;166:112546. doi: 10.1016/j.foodres.2023.112546. - DOI - PubMed

Publication types

Substances