Morphological Evaluation of Transscleral Laser Retinopexy in Rabbits: Comparison of Optical Coherence Tomography and Histologic Examinations
- PMID: 37756056
- PMCID: PMC10534503
- DOI: 10.3390/vetsci10090535
Morphological Evaluation of Transscleral Laser Retinopexy in Rabbits: Comparison of Optical Coherence Tomography and Histologic Examinations
Abstract
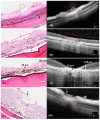
Transscleral retinopexy is a preventive technique used against retinal detachment. Fundus examination can allow the monitoring of morphological retinal changes in the progression of photocoagulation lesions, without offering details on the morphological changes by the retinal lesion. The aim of the study was to assess the progression of photocoagulation lesions induced by transscleral retinopexy (840 nm diode laser), by comparing the optical coherence tomography (OCT) and histological images over a period of six weeks on eight pigmented New Zealand healthy rabbits (four males and four females; n = 16 eyes). All rabbits underwent transscleral retinopexy on their left eye on day 0 (D0). Measurements of the photocoagulation lesions were obtained in vivo on D0, D7, D15, D21, and D42 by acquiring OCT images of both eyes from all rabbits. On D1, D7, D21, and D42, two rabbits were euthanized, and their eyes were enucleated. A significant effect by time on the decrease in the central retinal thickness of the photocoagulation lesion was observed from D1 to D7 (p = 0.001); however, no such effect was observed on the horizontal length ((HL) p = 0.584) of the lesion surface. The reliability between the OCT and histological measurements, which were evaluated using intraclass correlation coefficients, was excellent for measuring the retinal thickness at the center (ICC = 0.91, p < 0.001), moderate for the right side of the retinal lesions (ICC = 0.72, p = 0.006), and not significant for the left side and HL (p = 0.055 and 0.500, respectively). The morphological changes observed in the OCT and histopathological images of the photocoagulation lesions were qualitatively described over time. OCT is an effective tool for monitoring changes in photocoagulation lesions. Some measurements and qualitative changes showed an adequate correlation between the OCT and histological findings.
Keywords: diode laser; histology; optical coherence tomography; photocoagulation; rabbits; transscleral retinopexy.
Conflict of interest statement
The authors declare no conflict of interest.
Figures


Similar articles
-
Correlation with OCT and histology of photocoagulation lesions in patients and rabbits.Acta Ophthalmol. 2013 Dec;91(8):e603-11. doi: 10.1111/aos.12188. Epub 2013 May 29. Acta Ophthalmol. 2013. PMID: 23718709
-
[Postoperative proliferative vitreoretinopathy in rhegmatogenous retinal detachment associated with stage B preoperative proliferative vitreoretinopathy: comparative results of trans-scleral retinopexy with diode laser or trans-pupillary retinopexy with argon laser].J Fr Ophtalmol. 1998 Oct;21(8):555-9. J Fr Ophtalmol. 1998. PMID: 9833220 French.
-
Photocoagulation in rabbits: optical coherence tomographic lesion classification, wound healing reaction, and retinal temperatures.Lasers Surg Med. 2013 Sep;45(7):427-36. doi: 10.1002/lsm.22163. Lasers Surg Med. 2013. PMID: 24037823
-
[Pathophysiology of macular diseases--morphology and function].Nippon Ganka Gakkai Zasshi. 2011 Mar;115(3):238-74; discussion 275. Nippon Ganka Gakkai Zasshi. 2011. PMID: 21476310 Review. Japanese.
-
[A challenge to primary open-angle glaucoma including normal-pressure. Clinical problems and their scientific solution].Nippon Ganka Gakkai Zasshi. 2012 Mar;116(3):233-67; discussion 268. Nippon Ganka Gakkai Zasshi. 2012. PMID: 22568103 Review. Japanese.
References
-
- Mouries O., Vitrey D., Germain P., Bonnet M. [Use of diode laser in transcleral retinal photocoagulation] J. Fr. Ophtalmol. 1993;16:108–113. - PubMed
Grants and funding
LinkOut - more resources
Full Text Sources

