. 2023 Sep 19;10(9):581.
doi: 10.3390/vetsci10090581.

Lymphoma in Border Collies: Genome-Wide Association and Pedigree Analysis

Affiliations

Lymphoma in Border Collies: Genome-Wide Association and Pedigree Analysis

Pamela Xing Yi Soh et al. Vet Sci. .

Abstract

There has been considerable interest in studying cancer in dogs and its potential as a model system for humans. One area of research has been the search for genetic risk variants in canine lymphoma, which is amongst the most common canine cancers. Previous studies have focused on a limited number of breeds, but none have included Border Collies. The aims of this study were to identify relationships between Border Collie lymphoma cases through an extensive pedigree investigation and to utilise relationship information to conduct genome-wide association study (GWAS) analyses to identify risk regions associated with lymphoma. The expanded pedigree analysis included 83,000 Border Collies, with 71 identified lymphoma cases. The analysis identified affected close relatives, and a common ancestor was identified for 54 cases. For the genomic study, a GWAS was designed to incorporate lymphoma cases, putative "carriers", and controls. A case-control GWAS was also conducted as a comparison. Both analyses showed significant SNPs in regions on chromosomes 18 and 27. Putative top candidate genes from these regions included DLA-79, WNT10B, LMBR1L, KMT2D, and CCNT1.

Keywords: Border Collie; GWAS; breed; cancer; canine; dogs; lymphoma.


Conflict of interest statement

The authors declare no conflict of interest.

Figures

Figure 1
Figure 1
Distribution of age at first diagnosis for 71 lymphoma cases.
Figure 2
Figure 2
Pedigree of 54 lymphoma cases descending from dog_811. The most direct pathway for each lymphoma-affected dog to dog_811 is shown; some individuals may be related through other pedigree pathways but these pathways are not shown. Dotted lines connect instances where an individual is repeated in the pedigree. The year of birth and genotype ID, if available or relevant, is indicated below the dog ID for each dog.
Figure 3
Figure 3
NetView relationship network of 215 dogs based on a pedigree kinship matrix. Clustered based on a k-value of 10. A total of 54 lymphoma cases (22 genotyped), 114 normal (12 genotyped) dogs, and 40 other genotyped dogs with unknown health status are shown.
Figure 4
Figure 4
Genome-wide association analysis results for the quantitative phenotype (31 lymphoma cases, 27 carriers, and 119 controls). (A) Manhattan plot of −log10 p-values from mixed linear model association analysis. (B) QQ-plot of expected and observed −log10 p-values; shaded area indicates 95% confidence interval.
Figure 5
Figure 5
Regional Manhattan plots for the quantitative phenotype results on (A) chromosome 18 and (B) chromosome 27. The blue line indicates a chromosome q-value cut-off of 0.05 and the red line indicates a q-value cut-off of 0.1.
Figure 6
Figure 6
Regional association plot for the most significant region on chromosome 18. The top of the plot indicates −log10 p-values for each SNP from the mixed linear model association analysis. Red and blue lines indicate q-value cut-offs of 0.05 and 0.1, respectively. The top associated SNP for this chromosome, 18:38704682, is highlighted in purple. The protein-coding genes (CanFam3.1, assembly GCF_000002285.3) in the region, fetched from NCBI, are shown in the middle box. Linkage disequilibrium (r2) in the region is shown in the bottom triangle.
Figure 7
Figure 7
Regional association plot for a region of interest on chromosome 18. The top of the plot indicates −log10 p-values for each SNP from the mixed linear model association analysis. Red and blue lines indicate q-value cut offs of 0.05 and 0.1, respectively. The top associated SNP in this region is highlighted (purple dot). The protein-coding genes (CanFam3.1, assembly GCF_000002285.3) in the region, fetched from the NCBI, are shown in the middle box, with viral infection or cancer-associated genes identified through KEGG pathways highlighted in red. Linkage disequilibrium (r2) in the region is shown in the bottom triangle.
Figure 8
Figure 8
Regional association plot for the region of interest on chromosome 27. The top of the plot indicates −log10 p-values for each SNP from the mixed linear model association analysis. Red and blue lines indicate q-value cut offs of 0.05 and 0.1, respectively. The top associated SNP in this region is highlighted (purple dot). The protein-coding genes (CanFam3.1, assembly GCF_000002285.3) in the region, fetched from the NCBI, are shown in the middle box, with viral infection or cancer-associated genes identified through KEGG pathways highlighted in red. Linkage disequilibrium (r2) in the region is shown in the bottom triangle.
Figure 9
Figure 9
Regional association plot for the most significant region on chromosome 27. The top of the plot indicates −log10 p-values for each SNP from the mixed linear model association analysis. Red and blue lines indicate q-value cut offs of 0.05 and 0.1, respectively. The top associated SNP in this region is highlighted (purple dot). The protein-coding genes (CanFam3.1, assembly GCF_000002285.3) in the region, fetched from the NCBI, are shown in the middle box, with viral infection or cancer-associated genes identified through KEGG pathways highlighted in red. Linkage disequilibrium (r2) in the region is shown in the bottom triangle.
Figure 10
Figure 10
NetView relationship network of genotyped lymphoma cases (N = 31), carriers (N = 27), and controls (N = 119) based on a distance matrix. Clustered based on a k-value of 10.
Figure 11
Figure 11
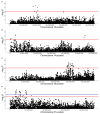
Genome-wide association results for the binary phenotype (31 lymphoma cases, 119 controls). (A) Manhattan plot of −log10 p-values from mixed linear model association analysis. (B) QQplot of expected and observed −log10 p-values; shaded area indicates 95% confidence interval.
Figure 12
Figure 12
Regional Manhattan plots for the GWAS results using a binary phenotype on (A) chromosome 13, (B) chromosome 14, (C) chromosome 18, and (D) chromosome 27. The blue line indicates a chromosome q-value cut-off of 0.05 and the red line indicates a q-value cut-off of 0.1.

References

    1. Dobson J.M., Samuel S., Milstein H., Rogers K., Wood J.L. Canine neoplasia in the UK: Estimates of incidence rates from a population of insured dogs. J. Small Anim. Pract. 2002;43:240–246. doi: 10.1111/j.1748-5827.2002.tb00066.x. - DOI - PubMed
    1. Edwards D.S., Henley W.E., Harding E.F., Dobson J.M., Wood J.L. Breed incidence of lymphoma in a UK population of insured dogs. Vet. Comp. Oncol. 2003;1:200–206. doi: 10.1111/j.1476-5810.2003.00025.x. - DOI - PubMed
    1. Comazzi S., Marelli S., Cozzi M., Rizzi R., Finotello R., Henriques J., Pastor J., Ponce F., Rohrer-Bley C., Rutgen B.C., et al. Breed-associated risks for developing canine lymphoma differ among countries: An European canine lymphoma network study. BMC Vet. Res. 2018;14:232. doi: 10.1186/s12917-018-1557-2. - DOI - PMC - PubMed
    1. Pinello K.C., Niza-Ribeiro J., Fonseca L., de Matos A.J. Incidence, characteristics and geographical distributions of canine and human non-Hodgkin’s lymphoma in the Porto region (North West Portugal) Vet. J. 2019;245:70–76. doi: 10.1016/j.tvjl.2019.01.003. - DOI - PubMed
    1. Modiano J.F., Breen M., Burnett R.C., Parker H.G., Inusah S., Thomas R., Avery P.R., Lindblad-Toh K., Ostrander E.A., Cutter G.C., et al. Distinct B-cell and T-cell lymphoproliferative disease prevalence among dog breeds indicates heritable risk. Cancer Res. 2005;65:5654–5661. doi: 10.1158/0008-5472.CAN-04-4613. - DOI - PubMed

LinkOut - more resources