. 2023 Sep 27;15(715):eade2966.
doi: 10.1126/scitranslmed.ade2966. Epub 2023 Sep 27.

Secreted folate receptor γ drives fibrogenesis in metabolic dysfunction-associated steatohepatitis by amplifying TGFβ signaling in hepatic stellate cells

Affiliations

Secreted folate receptor γ drives fibrogenesis in metabolic dysfunction-associated steatohepatitis by amplifying TGFβ signaling in hepatic stellate cells

Connor Quinn et al. Sci Transl Med. .

Abstract

Hepatic fibrosis is the primary determinant of mortality in patients with metabolic dysfunction-associated steatohepatitis (MASH). Transforming growth factor-β (TGFβ), a master profibrogenic cytokine, is a promising therapeutic target that has not yet been translated into an effective therapy in part because of liabilities associated with systemic TGFβ antagonism. We have identified that soluble folate receptor γ (FOLR3), which is expressed in humans but not in rodents, is a secreted protein that is elevated in the livers of patients with MASH but not in those with metabolic dysfunction-associated steatotic liver disease, those with type II diabetes, or healthy individuals. Global proteomics showed that FOLR3 was the most highly significant MASH-specific protein and was positively correlated with increasing fibrosis stage, consistent with stimulation of activated hepatic stellate cells (HSCs), which are the key fibrogenic cells in the liver. Exposure of HSCs to exogenous FOLR3 led to elevated extracellular matrix (ECM) protein production, an effect synergistically potentiated by TGFβ1. We found that FOLR3 interacts with the serine protease HTRA1, a known regulator of TGFBR, and activates TGFβ signaling. Administration of human FOLR3 to mice induced severe bridging fibrosis and an ECM pattern resembling human MASH. Our study thus uncovers a role of FOLR3 in enhancing fibrosis.


Conflict of interest statement

Competing interests: The authors declare that they have no competing interests.

Figures

Fig. 1.
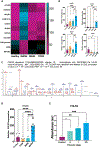
Fig. 1.. Folate receptor γ is increased in MASH liver.
(A and B) Heatmap (A) of differentially expressed proteins among cohorts with (B) quantitation for selected proteins. (C) Peptide spectrum match for FOLR3. (D) Individual FOLR3 abundance from the global proteomic analysis (n = 6 to 10; *P < 0.05, **P < 0.01, and ****P < 0.0001 by two-way ANOVA). (E) Correlation between FOLR3 abundance and fibrosis stage. (n = 3 to 6; **P < 0.01 and ***P < 0.001 by one-way ANOVA). au, arbitrary units; ns, not significant; m/z, mass/charge ratio.
Fig. 2.
Fig. 2.. FOLR3 quantitation using targeted mass spectrometry.
(A) Amino acid sequence comparison of FOLR1, FOLR2, and FOLR3 showing the selected tryptic peptide used for FOLR3 quantitation. (B) Standard curve developed for FOLR3 quantitation. (C) Skyline interface showing the fragmentation of the precursor ion and a representative chromatogram, the peak area response to concentration standards, and the quantitation of FOLR3 in human liver samples (n = 5; **P < 0.01 by one-way ANOVA).
Fig. 3.
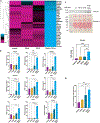
Fig. 3.. FOLR3 enhances TGFβ1-mediated HSC activation.
(A and B) Heatmap showing the expression of ECM proteins in the supernatant of cells treated with vehicle, FOLR3, TGFβ1, or FOLR3 + TGFβ1 (A) and individual quantitation of MASH-associated proteins (n = 4; *P < 0.05, **P < 0.01, ***P < 0.001, and ****P < 0.0001 by one-way ANOVA) (B). (C) Western blot analysis and quantitation of COL1A1 (n = 3; **P < 0.01 and ***P < 0.001 by one-way ANOVA). (D) α-SMA quantitation from global proteome analysis (n = 4; *P < 0.05, **P < 0.01, and ***P < 0.001 by one-way ANOVA). MW, molecular weight.
Fig. 4.
Fig. 4.. Folate receptor γ interacts with HTRA1.
(A) Anti-FLAG–coated magnetic beads were used to pull down FOLR3 and interacting proteins within HSC lysate. Samples without FOLR3 were processed simultaneously. All pull-downs were analyzed by LC-MS/MS. (B) MS/MS spectrum match for HTRA1 peptide in pull-down samples. (C) Quantitation results from the pull-down with FOLR3 and HTRA1. (D) AlphaFold2 model of HTRA1-FOLR3 interaction. The trimeric arrangement of HTRA1 in the model (blue) is essentially identical to the previously reported crystal structure of the HTRA1 catalytic domain (silver). Three copies of FOLR3 (cyan) are symmetrically arranged relative to HTRA1 in the model, close to the active site (gold). As shown in the inset, this model of FOLR3 (cyan) does not include direct contacts with the residues comprising the catalytic triad (gold); rather, it occludes the region that would otherwise be occupied by substrate (green). (E) Sensorgram showing the wavelength shift (in nanometers) generated by the simple kinetic assays. Adding 1.5 μM FOLR3 to the preloaded protein A biosensor with a specific monoclonal antibody (green). HTRA1 binding to the FOLR3-loaded biosensor (red). Bovine serum albumin binding to the FOLR3-loaded biosensor (dark blue) and blank (orange) was used as controls. (F) Wavelength shift (in nanometers) generated by the advanced kinetic assays. The 1.0 μM HTRA1 binding to the streptavidin biosensor preloaded with a specific polyclonal antibody against HTRA1 was acquired for 120 s after the 30-s baseline (indicated by arrow). The 1 μM loaded biosensor FOLR3 binding to the HTRA1 loaded biosensor was acquired for 120 s after a second baseline (indicated by arrow). Blank run control is shown in orange. Assays were performed in duplicate. The lighter outlines represent the SEM.
Fig. 5.
Fig. 5.. FOLR3 regulates TGFβ signaling through interaction with HTRA1.
(A) Immunofluorescence of TGFBR2 (green) in LX-2 cells treated with HTRA1 and FOLR3. Nuclei and cell bodies are stained in blue and red, respectively. (B) Quantitation of TGFBR2 (n = 300; **P < 0.01and ***P < 0.001 by one-way ANOVA). DAPI, 4′,6-diamidino-2-phenylindole.
Fig. 6.
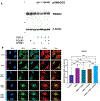
Fig. 6.. FOLR3 triggers SMAD2/3 phosphorylation and enhances SMAD2 translocation to nuclei.
(A) Western blot of pSMAD2/3, SMAD2, and β-actin from LX-2 cells with and without TGFβ1 treatment in the presence of HTRA1, FOLR3, or HTRA1 + FOLR3. (B) Immunofluorescence of total SMAD2 (green) in LX-2 cells treated with HTRA1, FOLR3, or HTRA1 + FOLR3 after 30 min of TGFβ1 activation. Nuclei and cell body stained in blue and red, respectively. Quantitation of SMAD2 located at nuclei is shown in the bar graph (n = 500; *P < 0.05 and ****P < 0.0001 by one-way ANOVA).
Fig. 7.
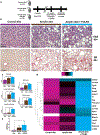
Fig. 7.. FOLR3 exacerbates fibrosis in a diet-induced mouse model of MASH.
(A) Experimental design. FFD, fast food diet. (B) Mouse liver histology with Sirius red (SR) staining. Images were taken at 10×, 20×, and 40× with scale bars of 500, 200, and 75 μm, respectively. (C) NAFLD activity score and fibrosis score quantitation. (D) Heatmap displaying ECM protein abundance from proteomic analysis. (E) α-SMA quantitation (n = 6 to 9; *P < 0.05, **P < 0.01, ***P < 0.001, and ****P < 0.0001 by one-way ANOVA).

References

    1. Hossain P, Kawar B, El Nahas M, Obesity and diabetes in the developing world — A growing challenge. N. Engl. J. Med. 356, 213–215 (2007). - PubMed
    1. Younossi Z, Anstee QM, Marietti M, Hardy T, Henry L, Eslam M, George J, Bugianesi E, Global burden of NAFLD and NASH: Trends, predictions, risk factors and prevention. Nat. Rev. Gastroenterol. Hepatol. 15, 11–20 (2018). - PubMed
    1. Younossi ZM, Henry L, The impact of obesity and type 2 diabetes on chronic liver disease. Am. J. Gastroenterol. 114, 1714–1715 (2019). - PubMed
    1. Younossi ZM, Marchesini G, Pinto-Cortez H, Petta S, Epidemiology of nonalcoholic fatty liver disease and nonalcoholic steatohepatitis: Implications for liver transplantation. Transplantation 103, 22–27 (2019). - PubMed
    1. Hagström H, Nasr P, Ekstedt M, Hammar U, Stål P, Hultcrantz R, Kechagias S, Fibrosis stage but not NASH predicts mortality and time to development of severe liver disease in biopsy-proven NAFLD. J. Hepatol. 67, 1265–1273 (2017). - PubMed

Publication types