. 2023 Sep 27;15(715):eade3157.
doi: 10.1126/scitranslmed.ade3157. Epub 2023 Sep 27.

Hepatocyte CYR61 polarizes profibrotic macrophages to orchestrate NASH fibrosis

Affiliations

Hepatocyte CYR61 polarizes profibrotic macrophages to orchestrate NASH fibrosis

Meghan Mooring et al. Sci Transl Med. .

Abstract

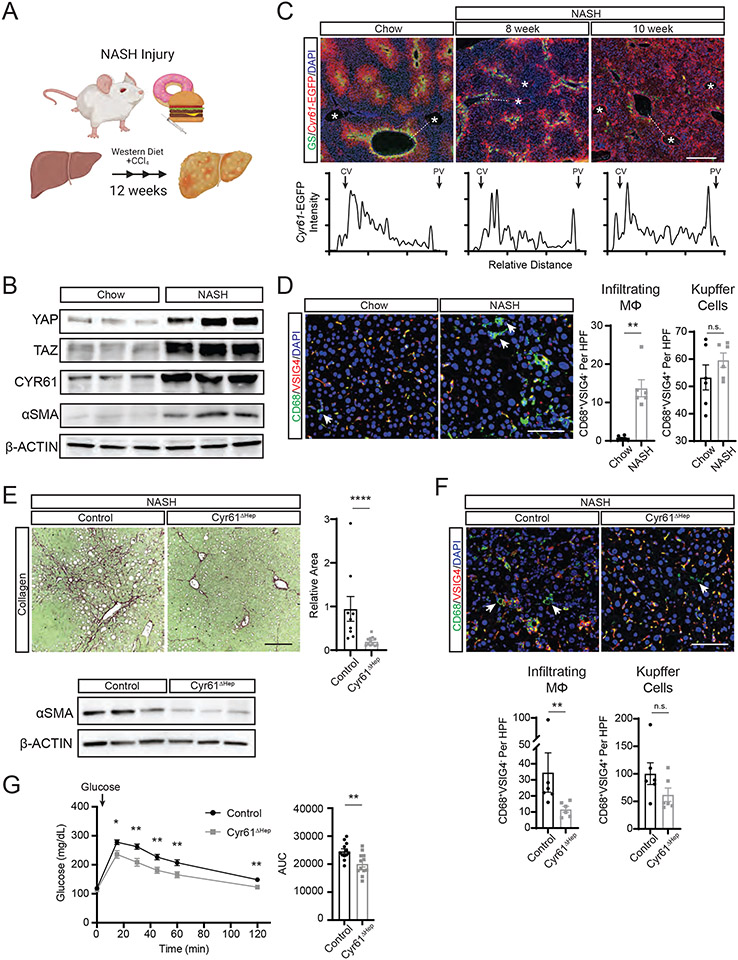
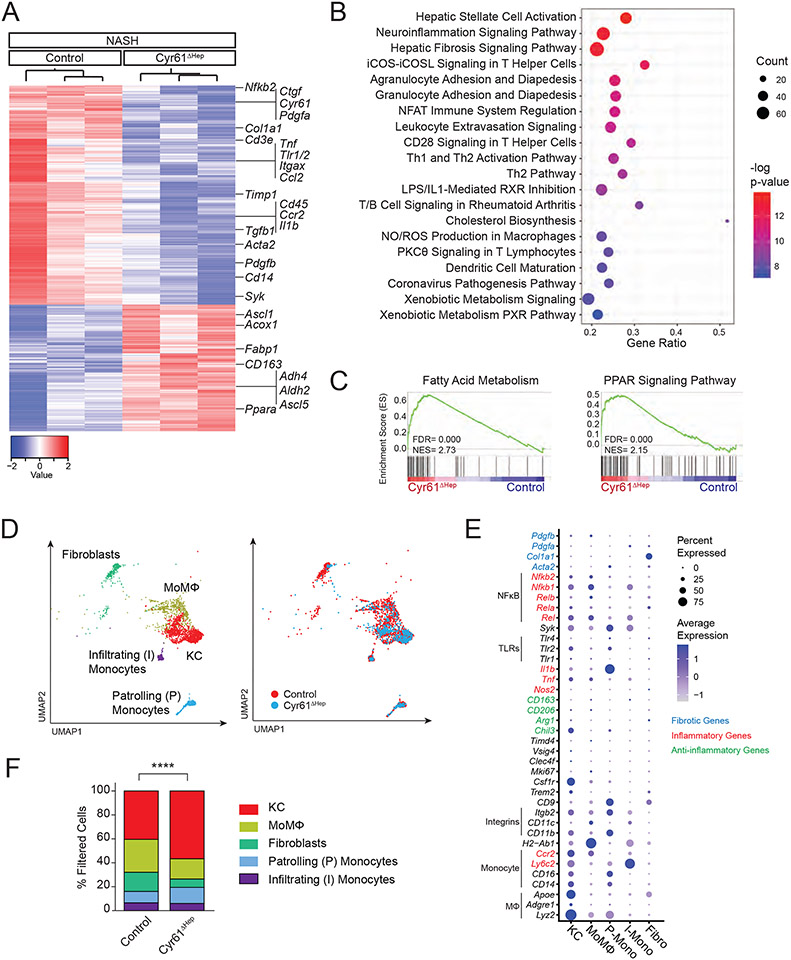
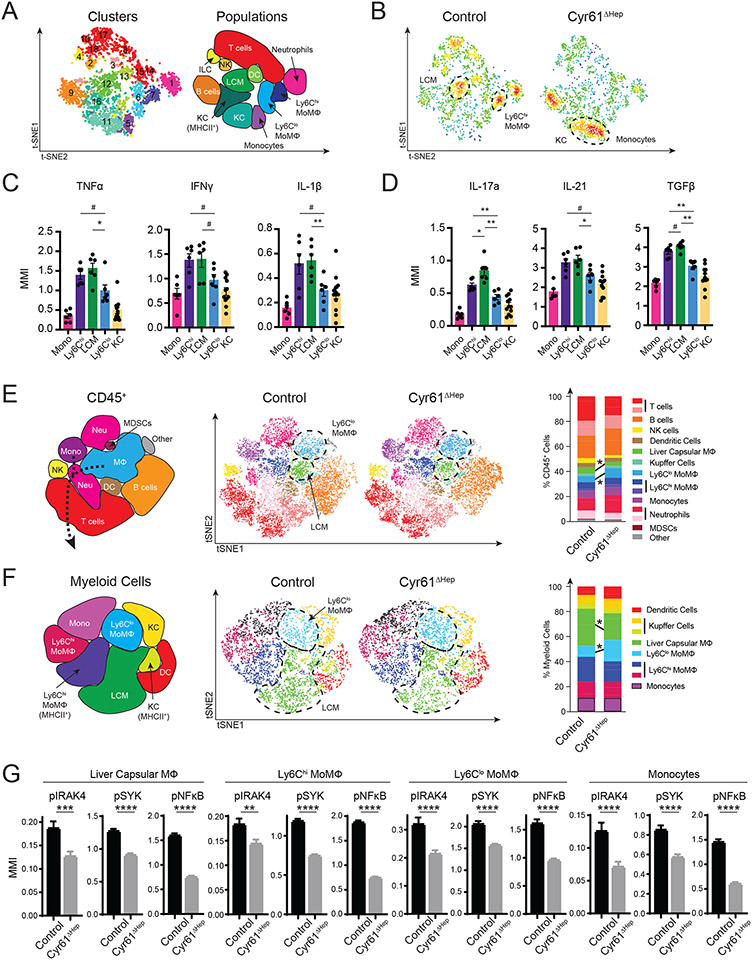
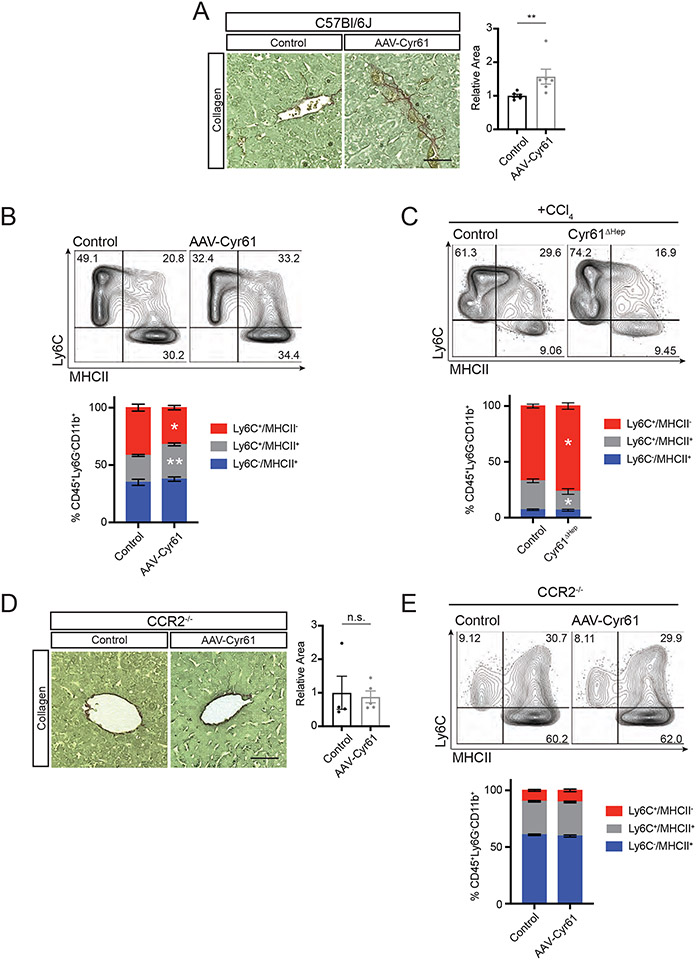
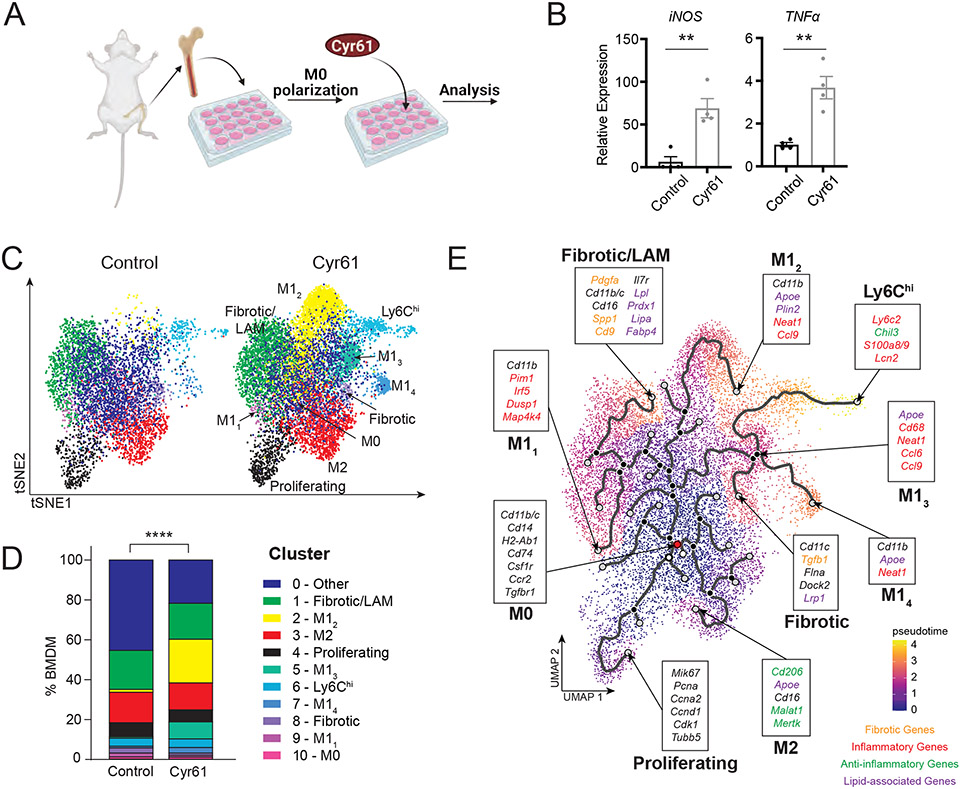
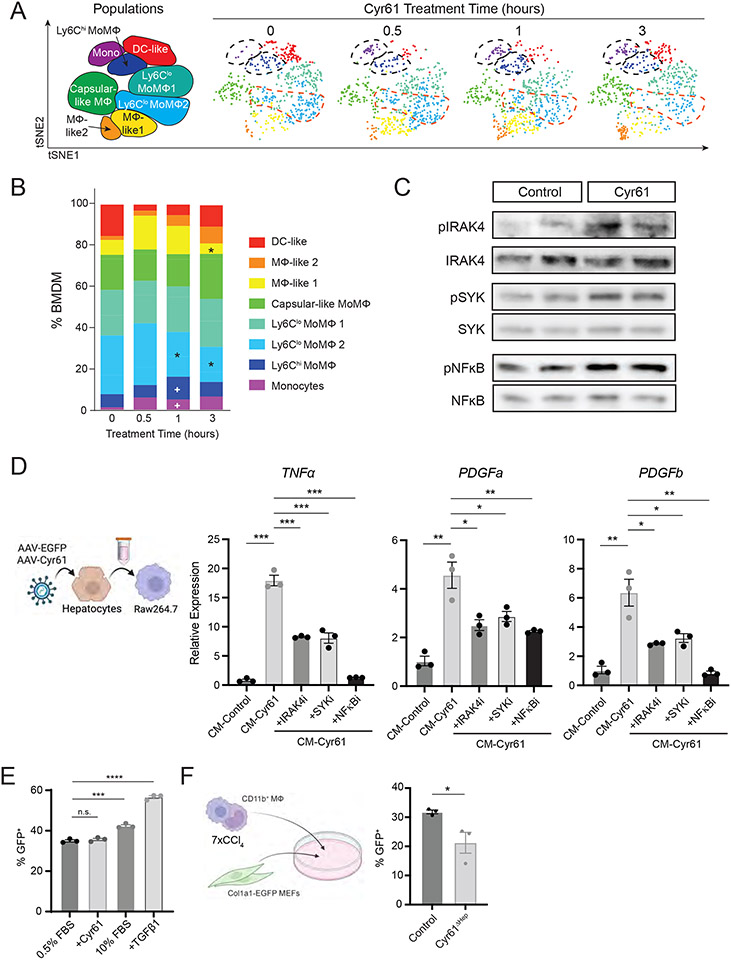
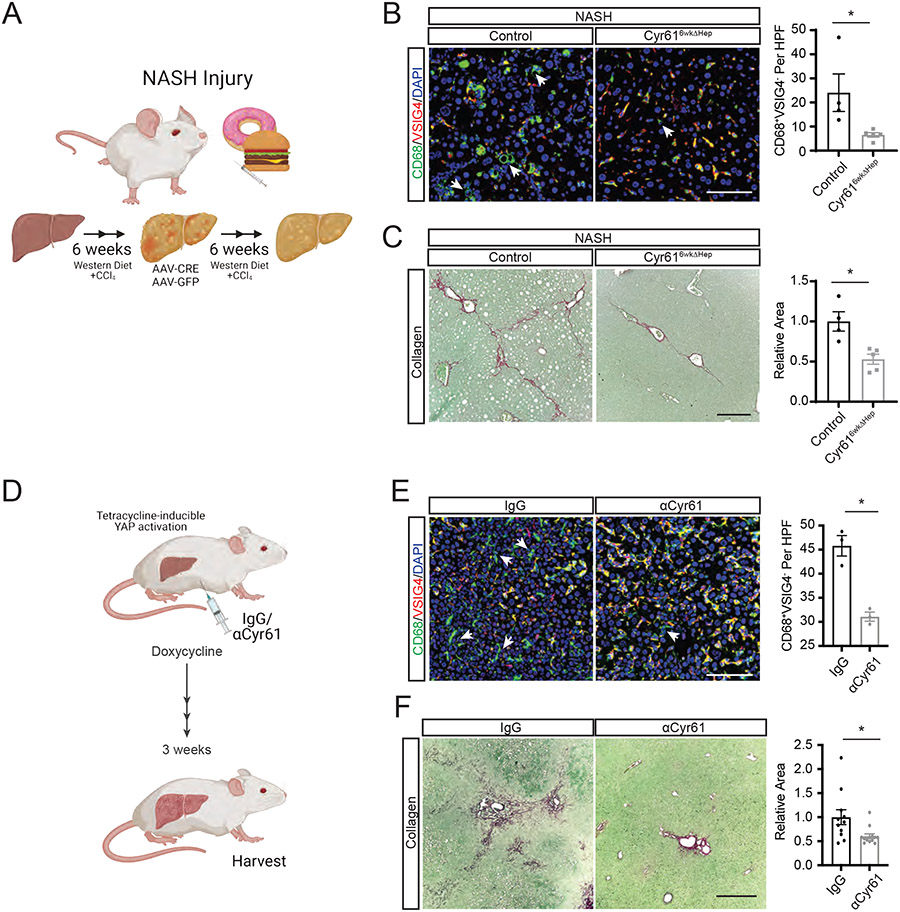
Obesity is increasing worldwide and leads to a multitude of metabolic diseases, including cardiovascular disease, type 2 diabetes, nonalcoholic fatty liver disease, and nonalcoholic steatohepatitis (NASH). Cysteine-rich angiogenic inducer 61 (CYR61) is associated with the progression of NASH, but it has been described to have anti- and proinflammatory properties. We sought to examine the role of liver CYR61 in NASH progression. CYR61 liver-specific knockout mice on a NASH diet showed improved glucose tolerance, decreased liver inflammation, and reduced fibrosis. CYR61 polarized infiltrating monocytes promoting a proinflammatory/profibrotic phenotype through an IRAK4/SYK/NF-κB signaling cascade. In vitro, CYR61 activated a profibrotic program, including PDGFa/PDGFb expression in macrophages, in an IRAK4/SYK/NF-κB-dependent manner. Furthermore, targeted-antibody blockade reduced CYR61-driven signaling in macrophages in vitro and in vivo, reducing fibrotic development. This study demonstrates that CYR61 is a key driver of liver inflammation and fibrosis in NASH.


Conflict of interest statement

Competing interests: XY, RM and MVP are full-time employees of Kadmon Corporation, LLC. The work was supported in part by funding from Kadmon Corporation, LLC. GIS serves on the following Scientific Advisory Boards: Merck, NovoNordisk, AstraZeneca, Aegerion, iMBP, 89bio, Janssen Research and Development, Ionis, Maze Therapeutics, Levels, Equator Therapeutics, Generian, Bayer, Kriya, Ionis, OrosoBio; GIS receives Investigator-Initiated Support from: Gilead Sciences, Astra Zeneca, Merck, Maze Therapeutics, Ionis, Regeneron. GIS is an inventor on Yale patents for liver-targeted mitochondrial uncoupling agents for the treatment of NAFLD, NASH, T2D and related metabolic disorders which are licensed by OrsoBio. All other authors declare no relevant conflicts of interest.

Figures

Figure 1.
Figure 1.. Cyr61 drives fibrotic injury in NASH.
(A) Cartoon of 12-week NASH injury in mice and associated biological analyses. (B) Immunoblot of indicated protein expression in whole livers of mice on chow diet or 12 weeks NASH diet. (C) Representative immunofluorescence imaging of GS (green) and Cyr61-EGFP (red) in livers from Cyr61-EGFP reporter mice on chow diet or on 8 or 10 weeks of NASH diet. Asterisks (*) indicate portal regions. Scale bar=400μm. Below: intensity of Cyr61-EGFP staining across dotted line from central vein (CV) to portal vein (PV). (D) Representative immunofluorescence imaging of specified proteins in livers from mice on chow diet (n=6) or 12 weeks of NASH diet (n=6). Scale bar=100μm. Quantification of infiltrating MΦs (CD68+VSIG4) and Kupffer cells (CD68+VSIG4+) to the right. HPF=high power field. Arrows indicate CD68+VSIG4 cells. (E) Representative picrosirius red staining of livers from Cyr61 fl/fl mice treated with AAV8-TBG-GFP (control, n=9) or AAV8-TBG-CRE (Cyr61ΔHep, n=12) on NASH diet for 12 weeks. Scale bar=200μm. Quantification to the right. Below: Immunoblot of αSMA expression in whole livers of control or Cyr61ΔHep mice on 12 weeks of NASH diet. (F) Representative immunofluorescence imaging of specified proteins in livers from control (n=6) or Cyr61ΔHep (n=6) NASH mice. Arrows indicate CD68+VSIG4 cells. Scale bar=100μm. Quantification of infiltrating MΦs (CD68+VSIG4) and Kupffer cells (CD68+VSIG4+) below. (G) Serum glucose measured in control (n=12) or Cyr61ΔHep (n=12) mice at indicated time points after glucose challenge (indicated by arrow). Fasting glucose was measured at 0 minutes. Area under the curve (AUC) calculation plotted to the right. Mean and SEM plotted; p value calculated with Mann-Whitney U test. *p<0.05, **p<0.01, ****p<0.0001
Figure 2.
Figure 2.. Loss of Cyr61 improves fibrotic, inflammatory, and metabolic signaling in NASH.
(A) Heatmap of 2198 differentially expressed genes between male control and Cyr61ΔHep NASH livers (FDR<0.05, Fold change > 1.5). (B) Top significantly enriched pathways called by differentially expressed genes comparing control and Cyr61ΔHep NASH livers. (C) Gene set enrichment analysis of indicated metabolic KEGG Pathway gene sets (NES= normalized enrichment score). (D) Uniform Manifold Approximation and Projection (UMAP) plots of filtered cells in control (n=2; 1,755 cells) and Cyr61ΔHep (n=2; 697 cells) NASH livers. Left: cell type identification labeled; Right: UMAP colored by condition. (E) Dot plot of selected genes expressed in each cluster. (F) Quantification of filtered populations in control and Cyr61ΔHep NASH livers as a percent of total cells. P value calculated with Fisher’s Exact test (****p<0.0001).
Figure 3.
Figure 3.. Loss of Cyr61 reduces inflammatory signaling in macrophages.
(A) T-distributed stochastic neighbor embedding (tSNE) plots of CD45+ populations in control (n=3) and Cyr61ΔHep (n=3) NASH livers using cytokine CyTOF panel. Right, identification of populations. (B) t-SNE plot showing density of cells in each condition. (C to D) Mean metal intensity (MMI) for indicated inflammatory (C) and fibrotic (D) cytokines in monocyte and macrophage populations. (E) Representative t-SNE plots of control (n=4) and Cyr61ΔHep (n=4) NASH livers using phosphorylation CyTOF panel. Significantly changed (p<0.05) populations circled. Right: plot of indicated populations as a percent of CD45+ cells. (F) Representative t-SNE plots of Ly6G myeloid cells (CD45+CD3CD19NKp45Ly6GF4/80+ and/or CD11b+) in control (n=3) and Cyr61ΔHep (n=3) NASH livers. Significantly changed populations circled. Right: plot of indicated populations as a percent of Ly6G myeloid cells. Mean and SEM plotted; p value calculated with Mann-Whitney U test. #p<0.1, *p<0.05, **p<0.01. (G) MMI of phosphorylated proteins in cells of indicated populations. Liver capsular MΦs: control n=1334 cells, Cyr61ΔHep n=1901; Ly6Chi MoMΦs: control n=1512, Cyr61ΔHep n=2636, Ly6Clo MoMΦs: control n=396, Cyr61ΔHep n=1522; and monocytes: control n=474, Cyr61ΔHep n=960. Mean and SEM plotted; p value calculated with Student’s T test. ***p<0.001, ****p<0.0001.
Figure 4.
Figure 4.. Cyr61 drives monocyte-to-macrophage differentiation.
(A) Representative picrosirius red staining of livers from C57Bl/6J mice treated with AAV8-TBG-Null (control, n=6) or AAV8-TBG-CYR61 (CYR61, n=6). Quantification to the right. (B) Representative flow cytometry plots of CD11b+ cells, excluding Ly6C/MHCII, of control (n=6) and CYR61 (n=6) treated livers with percentage of parent population labeled. Quantification below. (C) Representative flow cytometry plots of CD11b+ cells, excluding Ly6C/MHCII, of control (n=5) and Cyr61ΔHep (n=5) acute CCl4-treated livers with percentage of parent population labeled. Quantification below. (D) Representative picrosirius red staining of livers from CCR2−/− mice treated with AAV8-TBG-Null (control, n=4) or AAV8-TBG-CYR61 (CYR61, n=5). Quantification to the right. (E) Representative flow cytometry plots of CD11b+ cells, excluding Ly6C/MHCII, of control (n=4) and CYR61 (n=5) treated CCR2−/− livers with percentage of parent population labeled. Quantification below. Scale bars=50μm. Mean and SEM plotted; p value calculated with Mann-Whitney U test. *p<0.05, **p<0.01.
Figure 5.
Figure 5.. Stimulation with Cyr61 induces inflammatory and fibrotic phenotypes in bone marrow-derived macrophages.
(A) Cartoon of bone marrow-derived macrophage (BMDM) workflow. (B) Quantitative PCR analysis of indicated gene expression in control BMDMs (n=4) or BMDMs treated with Cyr61 protein (n=4). Mean and SEM plotted; p value calculated with Student’s T-test. *p<0.05, **p<0.01. (C) UMAP plots of macrophages in control (n=4) and CYR61 treated (n=4) BMDM. Cell type identification labeled. (D) Quantification of populations in control (n=4) and Cyr61-treated (n=4) BMDMs as a percent of total cells. P value calculated with Fisher’s Exact test (****p<0.0001). (E) Trajectory plot using Monocle3. Populations and key genes labeled. Starting node labeled in red.
Figure 6.
Figure 6.. Cyr61 activates transcription of fibrotic cytokines through NFκB.
(A) t-SNE plot of CD45+ Ly6G F4/80+ and/or CD11b+ BMDMs over the course of Cyr61 treatment. Populations labeled to the left. (B) Plot of indicated populations as a percent of CD45+/Ly6G BMDMs. p value calculated with Mann-Whitney U test: +p<0.05, change from 0 hours; *p<0.05, change from 0.5 hours. (C) Immunoblot of indicated phosphorylated signaling proteins in control (Ad-GFP) and Ad-Cyr61-treated J774A.1 cells. (D) Cartoon indicating process of treating Raw264.7 cells. Right - Quantitative PCR analysis of indicated gene expression in conditioned media control (CM-control), conditioned media Cyr61 (CM-Cyr61) or CM-Cyr61 plus inhibitors to IRAK4 (zimlovisertib), SYK (lanraplenib) or NFkB (JSH-23). (E) Percent GFP+ as assessed by flow cytometry of Col1a1-EGFP MEFs with indicated treatments. (F) Cartoon indicating co-culture of CD11b+ FACS-sorted liver monocytes with Col1a1-EGFP MEFS. Mean and SEM plotted; p value calculated with Students T-test. *p<0.05, **p<0.01, ***p<0.001, ****p<0.0001.
Figure 7.
Figure 7.. Blocking Cyr61 in YAP-induced Fibrosis Blunts Macrophage Recruitment and Fibrosis.
(A) Cartoon of Cyr616wkΔHep intervention after 6 weeks of NASH diet. (B) Representative immunofluorescence imaging of specified proteins in control (n=6) or Cyr616wkΔHep-intervened (n=6) NASH livers. Scale bar=100μm. Quantification of CD68+VSIG4 macrophages to the right. HPF=high power field. Arrows indicate CD68+VSIG4 cells. (D) Cartoon of tetracycline-inducible YAP liver fibrosis (YAP-Tg) with αCyr61 treatment. (D) Representative immunofluorescence imaging of specified proteins in YAP-Tg livers treated with IgG (n=3) or αCyr61 (n=3). Scale bar=100μm. Quantification of CD68+VSIG4 macrophages to the right. HPF=high power field. Arrows indicate CD68+VSIG4 cells. (F) Representative picrosirius red staining of livers from YAP-Tg mice treated with IgG (n=11) or αCyr61 (n=13) antibody. Scale bar=500μm. Quantification to the right. Mean and SEM plotted; p values calculated with Mann-Whitney U test. *p<0.05, **p<0.01, ***p<0.001.

References

    1. Arroyo-Johnson C, Mincey KD, Obesity Epidemiology Worldwide. Gastroenterol Clin North Am 45, 571–579 (2016). - PMC - PubMed
    1. Emerenziani S, Guarino MPL, Trillo Asensio LM, Altomare A, Ribolsi M, Balestrieri P, Cicala M, Role of Overweight and Obesity in Gastrointestinal Disease. Nutrients 12, (2019). - PMC - PubMed
    1. Sarwar R, Pierce N, Koppe S, Obesity and nonalcoholic fatty liver disease: current perspectives. Diabetes Metab Syndr Obes 11, 533–542 (2018). - PMC - PubMed
    1. Mavrogiannaki AN, Migdalis IN, Nonalcoholic fatty liver disease, diabetes mellitus and cardiovascular disease: Newer data. International Journal of Endocrinology 2013, 8 pages (2013). - PMC - PubMed
    1. El Hadi H, Di Vincenzo A, Vettor R, Rossato M, Cardio-Metabolic Disorders in Non-Alcoholic Fatty Liver Disease. International Journal of Molecular Sciences 20, 2215 (2019). - PMC - PubMed

Substances