. 2023 Sep 29;9(39):eadh4119.
doi: 10.1126/sciadv.adh4119. Epub 2023 Sep 27.

Cell state transition analysis identifies interventions that improve control of Mycobacterium tuberculosis infection by susceptible macrophages

Affiliations

Cell state transition analysis identifies interventions that improve control of Mycobacterium tuberculosis infection by susceptible macrophages

Shivraj M Yabaji et al. Sci Adv. .

Abstract

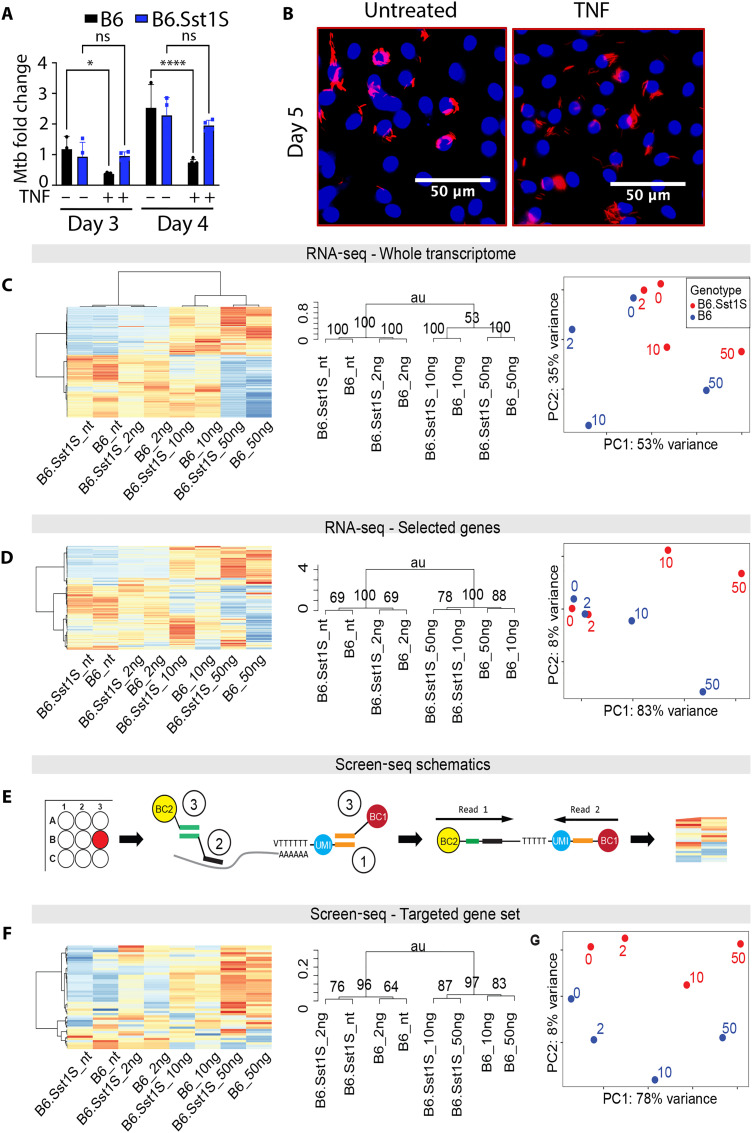
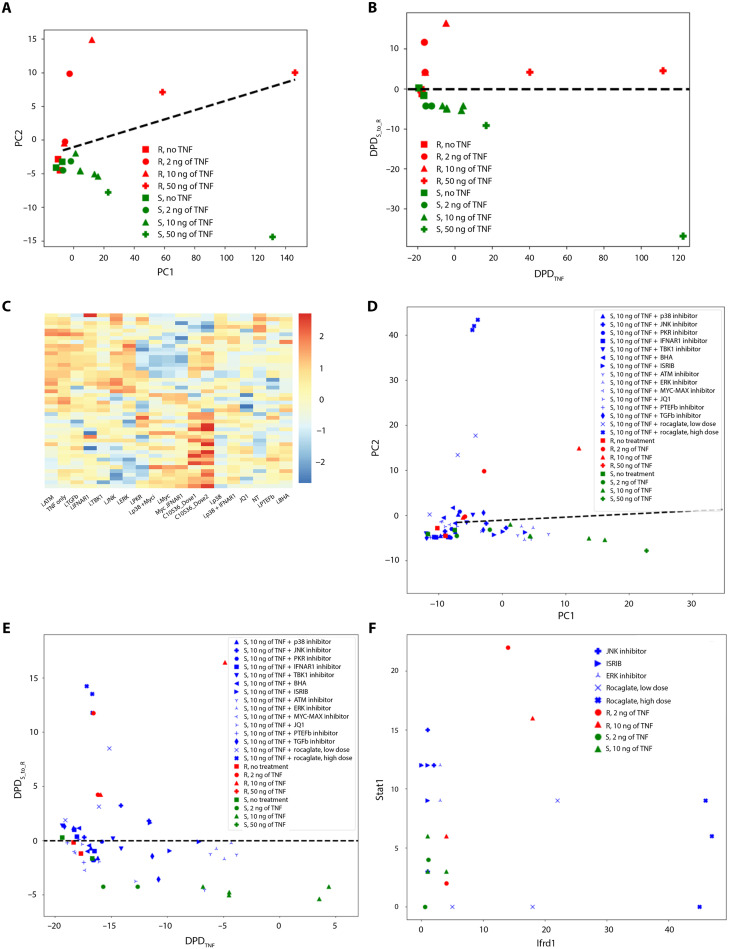
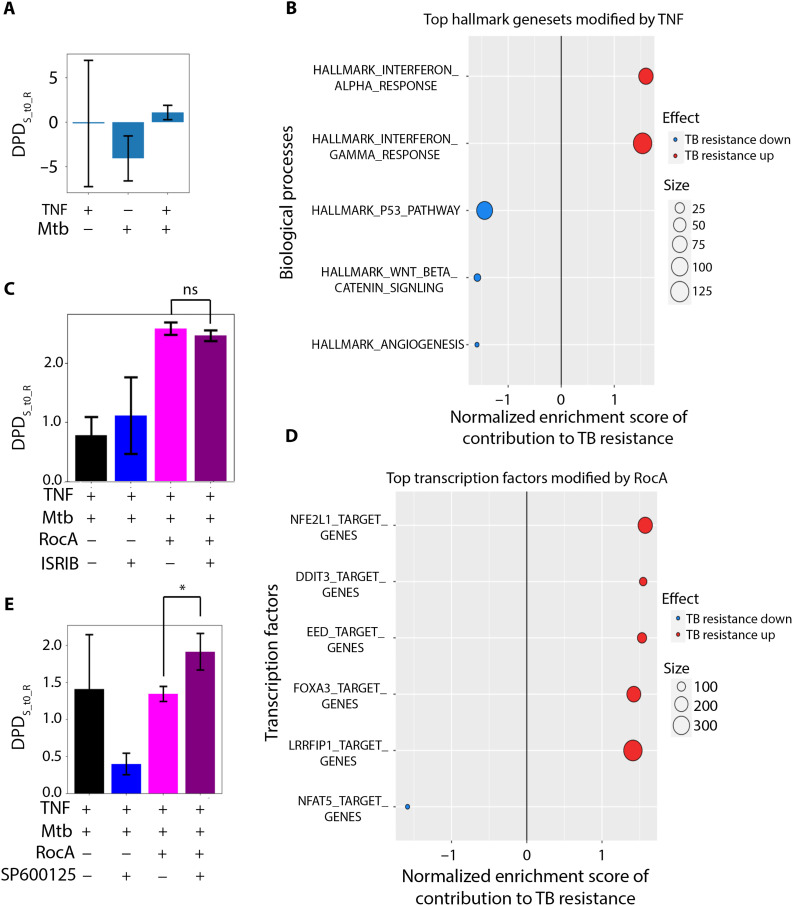
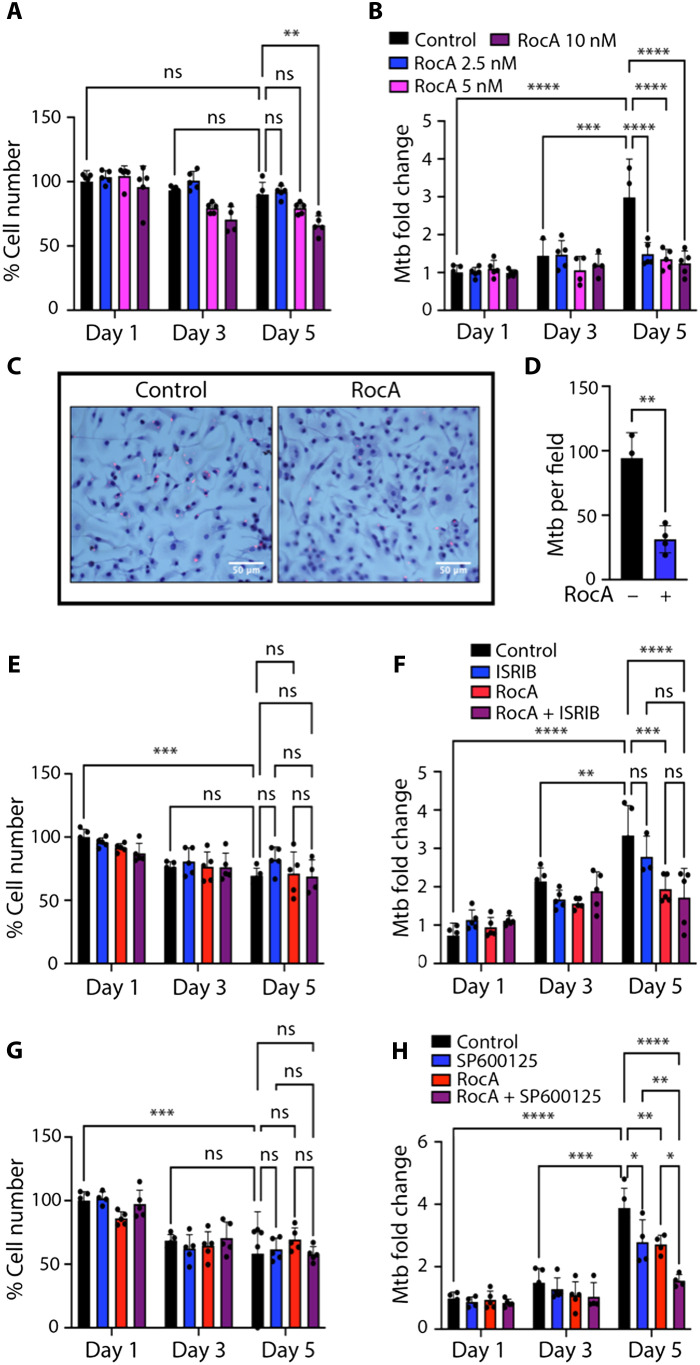
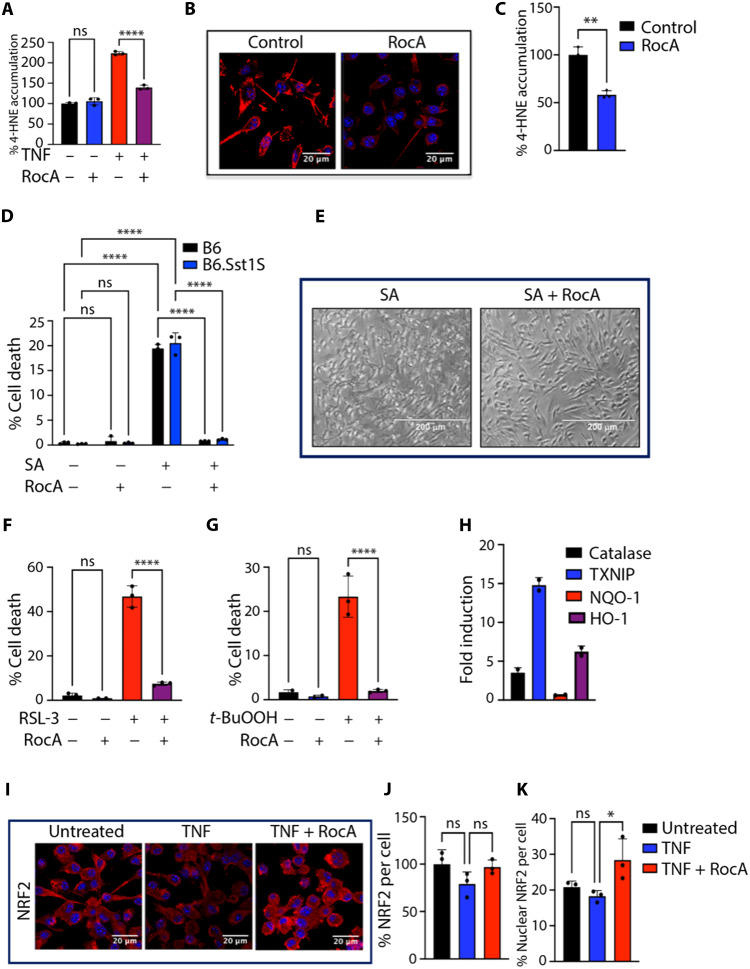
Understanding cell state transitions and purposefully controlling them to improve therapies is a longstanding challenge in biological research and medicine. Here, we identify a transcriptional signature that distinguishes activated macrophages from the tuberculosis (TB) susceptible and resistant mice. We then apply the cSTAR (cell state transition assessment and regulation) approach to data from screening-by-RNA sequencing to identify chemical perturbations that shift the transcriptional state of tumor necrosis factor (TNF)-activated TB-susceptible macrophages toward that of TB-resistant cells, i.e., prevents their aberrant activation without suppressing beneficial TNF responses. Last, we demonstrate that the compounds identified with this approach enhance the resistance of the TB-susceptible mouse macrophages to virulent Mycobacterium tuberculosis.


Figures

Fig. 1.
Fig. 1.. Screen-seq defines Mtb-susceptible macrophages abnormal TNF response.
(A) B6 and B6.Sst1S BMDMs were exposed to TNF (10 ng/ml), followed by Mtb infection. Mtb loads were determined by qualitative polymerase chain reaction (qPCR) on days 3 and 4 post-infection (p.i.). (B) Intracellular Mtb in TNF-treated BMDMs compared to untreated controls. B6.Sst1S BMDMs were infected with a reporter Mtb strain [SSB–green fluorescent protein (GFP), smyc’::mCherry] and imaged using confocal microscopy 5 days p.i.. ​ (C) RNA-seq analysis of the B6 and B6.Sst1S macrophage transcriptome exposed to TNF (0, 2, 10, and 50 ng/ml) for 18 hours. Polyadenylate RNA-seq libraries were prepared from two biological replicates per condition. Hierarchical clustering analysis of expression variation: heatmap (left) and dendrogram (middle). Right: PCA. P values in the dendrogram computed by multiscale bootstrap resampling. (D) sst1 genotype–specific response to TNF can be detected in the RNA-seq data from (C) using a subset of top 300 genes differentially expressed between B6 and B6.Sst1S BMDMs stimulated with TNF (10 ng/ml). Blue, B6; red, B6.Sst1S. (E) Screen-seq workflow: in-well cell lysis and RNA isolation; (1) Reverse transcription using oligo(dT) primers with unique molecular identifiers (UMIs; blue) and common adapter (orange). (2) Multiplex PCR using 46 gene-specific primers (black) and a common reverse primer that targets the oligo(dT) common adapter (orange) . (3) Well-encoding using primers targeting common adapters with unique barcode combinations (BC1 and BC2) for each well. All PCR products are pooled, Illumina sequencing adapters are added, and the pooled library is sequenced. Read 1 shows gene identity, read 2 contains UMI for counting individual cDNA molecules, and the barcodes BC1 and BC2 identify the original well. (F) RNA samples from RNA-seq in (C) were subjected to Screen-seq with 46 targeted genes (see table S1). Same order of panels as in (C) and (D). ns, not significant; au, arbitrary unit.
Fig. 2.
Fig. 2.. cSTAR analysis of targeted transcriptomics data.
(A) PCA representation of Screen-seq data from B6 (red) and B6.Sst1S susceptible (green) BMDMs stimulated with different doses of TNF for 24 hours: 2 ng/ml (circles), 10 ng/ml (triangles), 50 ng/ml (pluses), or unstimulated controls (squares). Black line represents the SVM-generated separating hyperplane in the PCA space. (B) Data in (A) are represented in the dynamic phenotype descriptors (DPDs) space. DPDTNF quantifies the separation of TNF responses, and DPDS_to_R quantifies the separation of resistant and susceptible phenotypes. Colors and symbols as in (A). Black dashed line represents projection of the SVM-generated separating hyperplane to DPD space. (C) Heatmap of targeted gene expression profiles (Screen-seq) of B6.Sst1S BMDMs after treatment with drugs for 24 hours in the presence of TNF (10 ng/ml). Drugs listed on the x axis and in table S2. (D) PCA representation of perturbation Screen-seq data of B6 (red) and B6.Sst1S susceptible mutant (green) BMDMs stimulated with different doses of TNF for 24 hours: Same colors and symbols as in (A). Black line represents the SVM-generated maximum margin hyperplane in the PCA space. Blue labels denote B6.Sst1S BMDMs treated with TNF (10 ng/ml) and selected drugs (table S2). (E) DPD space representation of perturbation Screen-seq data. B6 (red) and B6.Sst1S (green) macrophages were treated with TNF [2 ng/ml (circles) and 10 ng/ml (triangles)] for 24 hours or untreated (squares). Blue labels denote B6.Sst1S BMDMs treated with TNF (10 ng/ml) and selected drugs (table S2). Black dashed line represents projection of SVM-generated separating hyperplane to DPD space. (F) Fold changes of the Stat1 and Ifrd1 gene expression in B6 (red) and B6.Sst1S BMDMs (green) treated with TNF [2 ng/ml (circles) or 10 ng/ml (triangles)]. Blue labels denote B6.Sst1S BMDMs treated with TNF (10 ng/ml) and selected compounds: rocaglate, integrated stress response inhibitor (ISRIB), c-Jun N-terminal kinase, or extracellular signal–regulated kinase (ERK) inhibitors, as denoted.
Fig. 3.
Fig. 3.. Transcriptome responses of B6.Sst1S BMDMs to TNF and Mtb infection.
B6.Sst1S BMDMs were stimulated with TNF (10 ng/ml), infected with Mtb, and, after phagocytosis, treated with candidate compounds for 3 days. The whole transcriptome analysis was performed using RNA-seq. (A) DPDS_to_R scores for B6.Sst1S BMDMs naïve or stimulated with 10 ng of TNF and infected with Mtb for 3 days. The separating hyperplane corresponds to the DPDS_to_R = 0. (B) Top GSEA Hallmark gene sets driving DPD score in response to TNF. The projections of the log fold gene expression changes into the STVS_to_R have been used as the GSEA input for the GSEA hallmark gene set. Positive normalized enrichment score (red) reflects improved Mtb resistance, and negative normalized enrichment score (blue) reflects impaired Mtb resistance. (C) DPDS_to_R scores of B6.Sst1S BMDMs stimulated with TNF (10 ng/ml) and infected with Mtb [same as in (A)] and, after phagocytosis, treated with RocA, ISRIB, and their combinations. The separating hyperplane corresponds to the DPDS_to_R = 0. Positive DPDS_to_R scores reflect the normalization of the B6.Sst1S BMDM transcriptome. (D) Top GSEA predicted transcription factors driving DPD changes by RocA. The GTRD gene set (predicted transcription factor binding sites) was used for GSEA. Normalized enrichment score reflects improved (red) or impaired (blue) Mtb resistance. (E) DPDS_to_R scores of B6.Sst1S BMDMs stimulated with 10 ng of TNF, infected with Mtb, and treated with RocA, JNKi SP600125, or their combination. The test compounds were added to the infected BMDMs after phagocytosis of Mtb. The separating hyperplane corresponds to the DPDS_to_R = 0, and positive DPDS_to_R scores demonstrate the normalization of the infected B6.Sst1S BMDM transcriptome.
Fig. 4.
Fig. 4.. Effects of Rocaglates, ISRIB, and JNKi on BMDM survival and Mtb load.
B6.Sst1S BMDMs were treated with TNF (10 ng/ml) for 16 hours and subsequently infected with Mtb at multiplicity of infection = 1 for 5 days. (A and B) Cell survival (A) and Mtb load (B) after BMDMs were treated with different concentrations of RocA after phagocytosis. Cell numbers were determined using Celigo automated cytometer. Mtb loads were calculated as fold change by using quantitative genomic PCR (see Materials and Methods) at indicated time points. (C and D) Intracellular MTB loads in cells treated with 3 nM RocA for 5 days. The cells were permeabilized with 0.05% Triton X-100, and Mtb were stained using auramine-rhodamine and imaged by confocal microscopy. Scale bars, 50 μm. (D) Quantification of Mtb loads using ImageJ. (E and F) Cell survival (E) and Mtb load (F) after BMDMs were treated with RocA (1 nM), ISRIB (10 μM), or their combinations. Cell numbers were determined using Celigo automated cytometer. Mtb loads were calculated as fold change by using quantitative genomic PCR at indicated time points. (G and H) Cell survival (G) and Mtb loads (H) after BMDMs were treated with RocA (1 nM), SP600125 (0.3 μM), or their combination. Cell numbers were determined using Celigo automated cytometer. Mtb loads were calculated as fold change by using quantitative genomic PCR at indicated time points. The data represent the means ± SEM of four to five samples per experiment, representative of three independent experiments. The statistical significance was performed by two-way analysis of variance (ANOVA) using Bonferroni’s multiple comparison test (A and B and E to H) and two-tailed unpaired t test (C and D). Significant differences are indicated with asterisks (*P < 0.05, **P < 0.01, ***P < 0.001, and ****P < 0.0001).​
Fig. 5.
Fig. 5.. Rocaglate increases oxidative stress resilience of macrophages.
(A) RocA treatment (3 nM) reduces 4-HNE accumulation in TNF-stimulated B6.Sst1S BMDMs. 4-HNE was quantified using specific antibody and automated microscopy (Operetta CLS High Content Analysis System). Untreated samples considered 100%. (B and C) RocA treatment (3 nM) reduced the 4-HNE accumulation in Mtb-infected B6.Sst1S BMDMs (4-HNE staining 5 days p.i.) Scale bars, 20 μm. Analysis using ImageJ. (D and E) RocA prevents cell death induced by SA in B6 and B6.Sst1S BMDMs. (D) BMDMs were pretreated with RocA (10 nM) for 4 hours and treated with SA (9 μM for 16 hours). Cell death was quantified by automated microscopy using Live-or-Dye staining. (E) Brightfield images of B6.Sst1.S BMDMs (×20 magnification). Scale bar, 200 μm. (F and G) Pretreatment of B6.Sst1S BMDMs with RocA (30 nM for 4 hours) prevents their death induced by GPX4 inhibitor RSL-3 added at 30 nM for 16 hours (F) and LPO inducer tert-butyl hydroperoxide (t-BuOOH) added at 30 μM for 16 hours (G). (H) Rocaglate treatment of B6.Sst1S BMDMs up-regulates the expression of NRF2 target genes. The data are representative of two biological replicas measured in triplicates using qRT-PCR. (I to K) RocA (3 nM) increases nuclear translocation of NRF2 in B6.Sst1S BMDMs stimulated with TNF (10 ng/ml, for 30 hours). Total and nuclear NRF2 levels were quantified using confocal microscopy (scale bars, 20 μm) and ImageJ analysis. The data represent the means ± SEM of four to five samples per experiment, representative of three independent experiments. For statistical tests, (B and C) one-way ANOVA with Dunnett’s multiple comparison test, (E and J and K) one-way ANOVA with Bonferroni correction, (G) two-tailed unpaired t test, and (H) two-way ANOVA with Bonferroni correction were used. Significant differences are indicated with asterisks (*P < 0.05, **P < 0.01, ***P < 0.001, and ****P < 0.0001).

Update of

Similar articles

Cited by

References

    1. D. Fey, M. Halasz, D. Dreidax, S. P. Kennedy, J. F. Hastings, N. Rauch, A. G. Munoz, R. Pilkington, M. Fischer, F. Westermann, W. Kolch, B. N. Kholodenko, D. R. Croucher, Signaling pathway models as biomarkers: Patient-specific simulations of JNK activity predict the survival of neuroblastoma patients. Sci. Signal. 8, ra130 (2015). - PubMed
    1. H. Ryu, M. Chung, M. Dobrzynski, D. Fey, Y. Blum, S. S. Lee, M. Peter, B. N. Kholodenko, N. L. Jeon, O. Pertz, Frequency modulation of ERK activation dynamics rewires cell fate. Mol. Syst. Biol. 11, 838 (2015). - PMC - PubMed
    1. Y. Su, M. E. Ko, H. Cheng, R. Zhu, M. Xue, J. Wang, J. W. Lee, L. Frankiw, A. Xu, S. Wong, L. Robert, K. Takata, D. Yuan, Y. Lu, S. Huang, A. Ribas, R. Levine, G. P. Nolan, W. Wei, S. K. Plevritis, G. Li, D. Baltimore, J. R. Heath, Multi-omic single-cell snapshots reveal multiple independent trajectories to drug tolerance in a melanoma cell line. Nat. Commun. 11, 2345 (2020). - PMC - PubMed
    1. X. Qiu, Y. Zhang, J. D. Martin-Rufino, C. Weng, S. Hosseinzadeh, D. Yang, A. N. Pogson, M. Y. Hein, K. Hoi Min, L. Wang, E. I. Grody, M. J. Shurtleff, R. Yuan, S. Xu, Y. Ma, J. M. Replogle, E. S. Lander, S. Darmanis, I. Bahar, V. G. Sankaran, J. Xing, J. S. Weissman, Mapping transcriptomic vector fields of single cells. Cell 185, 690–711.e45 (2022). - PMC - PubMed
    1. A. R. DiNardo, T. Gandhi, J. Heyckendorf, S. L. Grimm, K. Rajapakshe, T. Nishiguchi, M. Reimann, H. L. Kirchner, J. Kahari, Q. Dlamini, C. Lange, T. Goldmann, S. Marwitz; DZIF-TB cohort study group, A. Abhimanyu, J. D. Cirillo, S. H. E. Kaufmann, M. G. Netea, R. V. Crevel, A. M. Mandalakas, C. Coarfa, Gene expression signatures identify biologically and clinically distinct tuberculosis endotypes. European Respir. J. 60, 2102263 (2022). - PMC - PubMed

Substances