. 2023 Sep 29;9(39):eadd9668.
doi: 10.1126/sciadv.add9668. Epub 2023 Sep 27.

Intertumoral lineage diversity and immunosuppressive transcriptional programs in well-differentiated gastroenteropancreatic neuroendocrine tumors

Affiliations

Intertumoral lineage diversity and immunosuppressive transcriptional programs in well-differentiated gastroenteropancreatic neuroendocrine tumors

Samantha E Hoffman et al. Sci Adv. .

Abstract

Neuroendocrine tumors (NETs) are rare cancers that most often arise in the gastrointestinal tract and pancreas. The fundamental mechanisms driving gastroenteropancreatic (GEP)-NET growth remain incompletely elucidated; however, the heterogeneous clinical behavior of GEP-NETs suggests that both cellular lineage dynamics and tumor microenvironment influence tumor pathophysiology. Here, we investigated the single-cell transcriptomes of tumor and immune cells from patients with gastroenteropancreatic NETs. Malignant GEP-NET cells expressed genes and regulons associated with normal, gastrointestinal endocrine cell differentiation, and fate determination stages. Tumor and lymphoid compartments sparsely expressed immunosuppressive targets commonly investigated in clinical trials, such as the programmed cell death protein-1/programmed death ligand-1 axis. However, infiltrating myeloid cell types within both primary and metastatic GEP-NETs were enriched for genes encoding other immune checkpoints, including VSIR (VISTA), HAVCR2 (TIM3), LGALS9 (Gal-9), and SIGLEC10. Our findings highlight the transcriptomic heterogeneity that distinguishes the cellular landscapes of GEP-NET anatomic subtypes and reveal potential avenues for future precision medicine therapeutics.


Figures
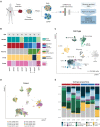
Fig. 1.
Fig. 1.. Characterizing the cellular landscape of pancreatic, small intestinal, and gNETs.
(A) NET scRNA-seq workflow. Resected tumor fragments were dissociated into single-cell suspensions, which were then divided for parallel sequencing of (i) nonsorted single cells and (ii) fluorescence-activated cell sorting (FACS) sorted, CD45+ immune cells. All samples were processed using the 10x Genomics platform. (B) Patient demographics and treatment summary at time of tumor resection. Site: SI, small intestine; SI/liver: small intestinal primary tumor with liver metastasis. A bar underneath samples indicates that they originate from the same patient. (C) UMAP of malignant and nonmalignant cells from all tumors, colored by general cell type. (D) UMAP of malignant and nonmalignant cells from all tumors, colored by sample of origin (left). (E) Cellular composition of each tumor, colored by general cell type.
Fig. 2.
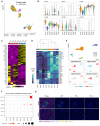
Fig. 2.. GEP-NET cells do not express common immune checkpoint targets.
(A) UMAP plot of all malignant cells from all GEP-NET samples, colored by sample of origin. (B) Violin plots of genes commonly expressed in GEP-NETs, grouped and colored by sample. (C) Heatmap of scaled, normalized average expression of top 50 differentially expressed genes between pancreatic (pn) and small intestinal (si) NETs. (D) Heatmap of scaled expression of the top five differentially expressed regulons per individual tumor. Blue-labeled genes indicate involvement in enteroendocrine differentiation or regulation of intestinal stem cell fate. Red-labeled genes indicate TFs with known involvement in endocrine pancreas development and pNET biology. (E) UMAP plots of malignant cells from all pNETs, colored by tumor of origin (top), followed by heatmaps in UMAP space of VISION signature scores for cell type–specific genes for the major cells in the normal human endocrine pancreas (bottom). (F) Dotplot of percent expression of common, targetable immune checkpoint and evasion genes, grouped by sample. (G) Representative immunohistochemical staining of CD8, PD-1, and PD-L1 two siNET samples. PD-1 and PD-L1 expression was low to nonexistent across all stained samples, consistent with low transcriptional expression by scRNA-seq. Scale bars, 100 μm. DAPI, 4′,6-diamidino-2-phenylindole.
Fig. 3.
Fig. 3.. Classifying T cell and NK cell populations within GEP-NETs.
(A) UMAP (top) of T cells and NK cells from all tumors, colored and labeled by lymphoid subtype. Barplot (bottom) displays T/NK cell type proportion by sample. (B) Heatmap of scaled, normalized expression of top 15 differentially expressed genes per T/NK cell subtype. Specific subtype-determining genes are annotated at right. (C) UMAP of CD8+ T cells from all tumors, colored by CD8+ T cell subtype (left) and NET origin site (right). (D) Expression heatmaps in UMAP space of naïve (TCF7 and CCR7), memory (IL7R), and exhausted (TOX) CD8 T cell markers as well as coinhibitory receptor TIM3 in CD8+ T cells. (E) Dotplots of percent of T cell subtypes expressing known immunosuppressive genes, grouped and colored by NET site.
Fig. 4.
Fig. 4.. GEP-NET–intrinsic myeloid cells express targetable immunosuppressive ligands.
(A) UMAP of myeloid cells (top) from all tumors, colored and labeled by myeloid cell subtype. Barplot (bottom) displays myeloid cell type proportion by sample. (B) Dotplot of percentage of each myeloid subtype expressing immunosuppressive ligand genes. (C) Two-dimensional butterfly plot visualizations of relative metamodule scores of top MSigDB Hallmark Pathways (TNF-α, “TNFA Signaling Via NFKB;” IFN-γ, “Interferon Gamma Response;” IL-2/STAT5, “IL2 STAT5 Signaling;” and complement = “Complement”) in all GEP-NET–associated macrophages (left) and separated by TAM subtype (right). (D) Violin plot of VISION scores of M1 macrophage– and M2 macrophage–associated gene signatures, grouped by TAM subtype. (E) Heatmaps of scaled, normalized, and averaged expression of top differentially expressed genes between GEP-NET sites within each TAM subtype (left, FOLR2-hi TAMs and right, SELENOP-hi TAMs). (F) Graphical summary of differential chemokine expression patterns between TAMs from GEP-NETs at different anatomical sites.
Fig. 5.
Fig. 5.. scRNA-seq reveals intratumoral heterogeneity and evolution dynamics in GEP-NETs.
(A) UMAP of malignant and immune cells from a primary siNET (sinet2) and its paired liver metastasis from the same patient (sinet3). Cells are colored by cancer or immune cell type. Tumor cells are represented by the clusters within the dashed oval. (B) UMAP of only tumor cells from sinet2 and sinet3, colored by Louvain cluster. (C) Donut plots representing percentage of cells found in each cluster from (B) for sinet2 and sinet3. Plots are colored by clusters as in (B). (D) Heatmap of scaled, normalized, and averaged expression of the top 10 differentially expressed genes between tumor clusters from (B). (E) Copy number alteration profiles of sinet2 and sinet3. Tumor subclones are indicated by color bars on the left-hand side of each plot. (F) GSEA of epithelial-mesenchymal transition (top) and KRAS signaling up (bottom) transcriptional signatures in clone 1 cells compared to clone 2 cells from sample sinet2.

References

    1. Z. Xu, L. Wang, S. Dai, M. Chen, F. Li, J. Sun, F. Luo, Epidemiologic trends of and factors associated with overall survival for patients with gastroenteropancreatic neuroendocrine tumors in the United States. JAMA Netw. Open 4, e2124750 (2021). - PMC - PubMed
    1. A. Dasari, C. Shen, D. Halperin, B. Zhao, S. Zhou, Y. Xu, T. Shih, J. C. Yao, Trends in the incidence, prevalence, and survival outcomes in patients with neuroendocrine tumors in the United States. JAMA Oncol. 3, 1335–1342 (2017). - PMC - PubMed
    1. M. Pavel, K. Öberg, M. Falconi, E. P. Krenning, A. Sundin, A. Perren, A. Berruti; SMO Guidelines Committee. Electronic address: clinicalguidelines@esmo.org , Gastroenteropancreatic neuroendocrine neoplasms: ESMO Clinical Practice Guidelines for diagnosis, treatment and follow-up. Ann. Oncol. 31, 844–860 (2020). - PubMed
    1. J. Hallet, C. H. L. Law, M. Cukier, R. Saskin, N. Liu, S. Singh, Exploring the rising incidence of neuroendocrine tumors: A population-based analysis of epidemiology, metastatic presentation, and outcomes. Cancer 121, 589–597 (2015). - PubMed
    1. M. Cives, J. R. Strosberg, Gastroenteropancreatic neuroendocrine tumors. CA Cancer J. Clin. 68, 471–487 (2018). - PubMed

MeSH terms

Supplementary concepts