. 2023 Dec 1;208(11):1177-1195.
doi: 10.1164/rccm.202305-0924OC.

Activation of CD8+ T Cells in Chronic Obstructive Pulmonary Disease Lung

Collaborators, Affiliations

Activation of CD8+ T Cells in Chronic Obstructive Pulmonary Disease Lung

Ana B Villaseñor-Altamirano et al. Am J Respir Crit Care Med. .

Abstract

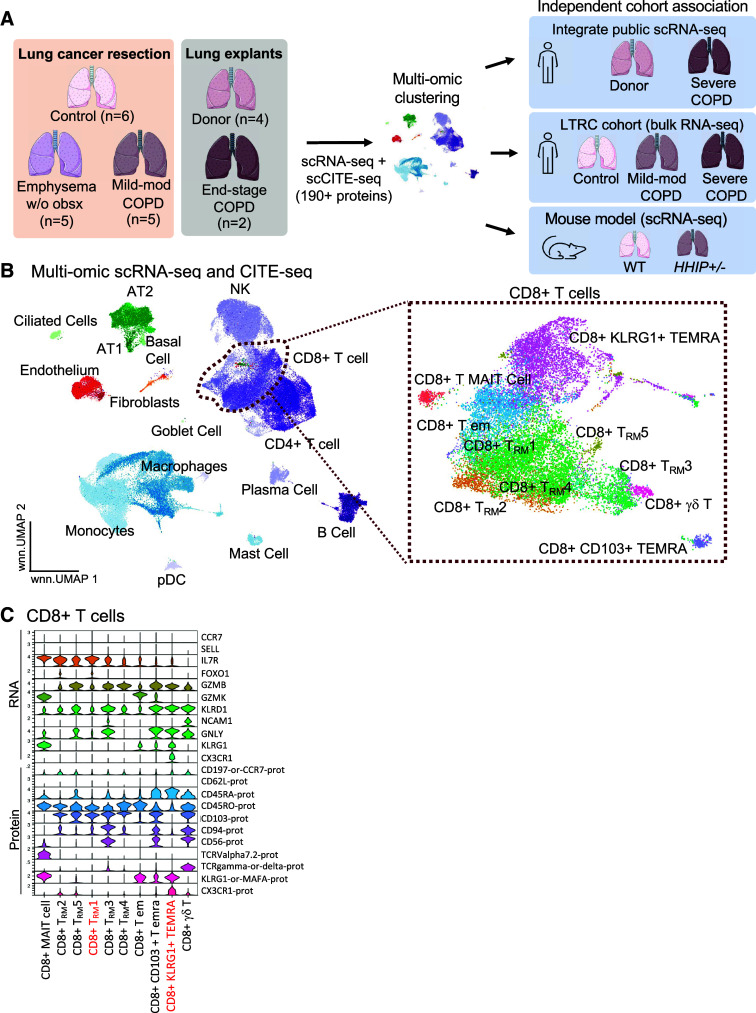
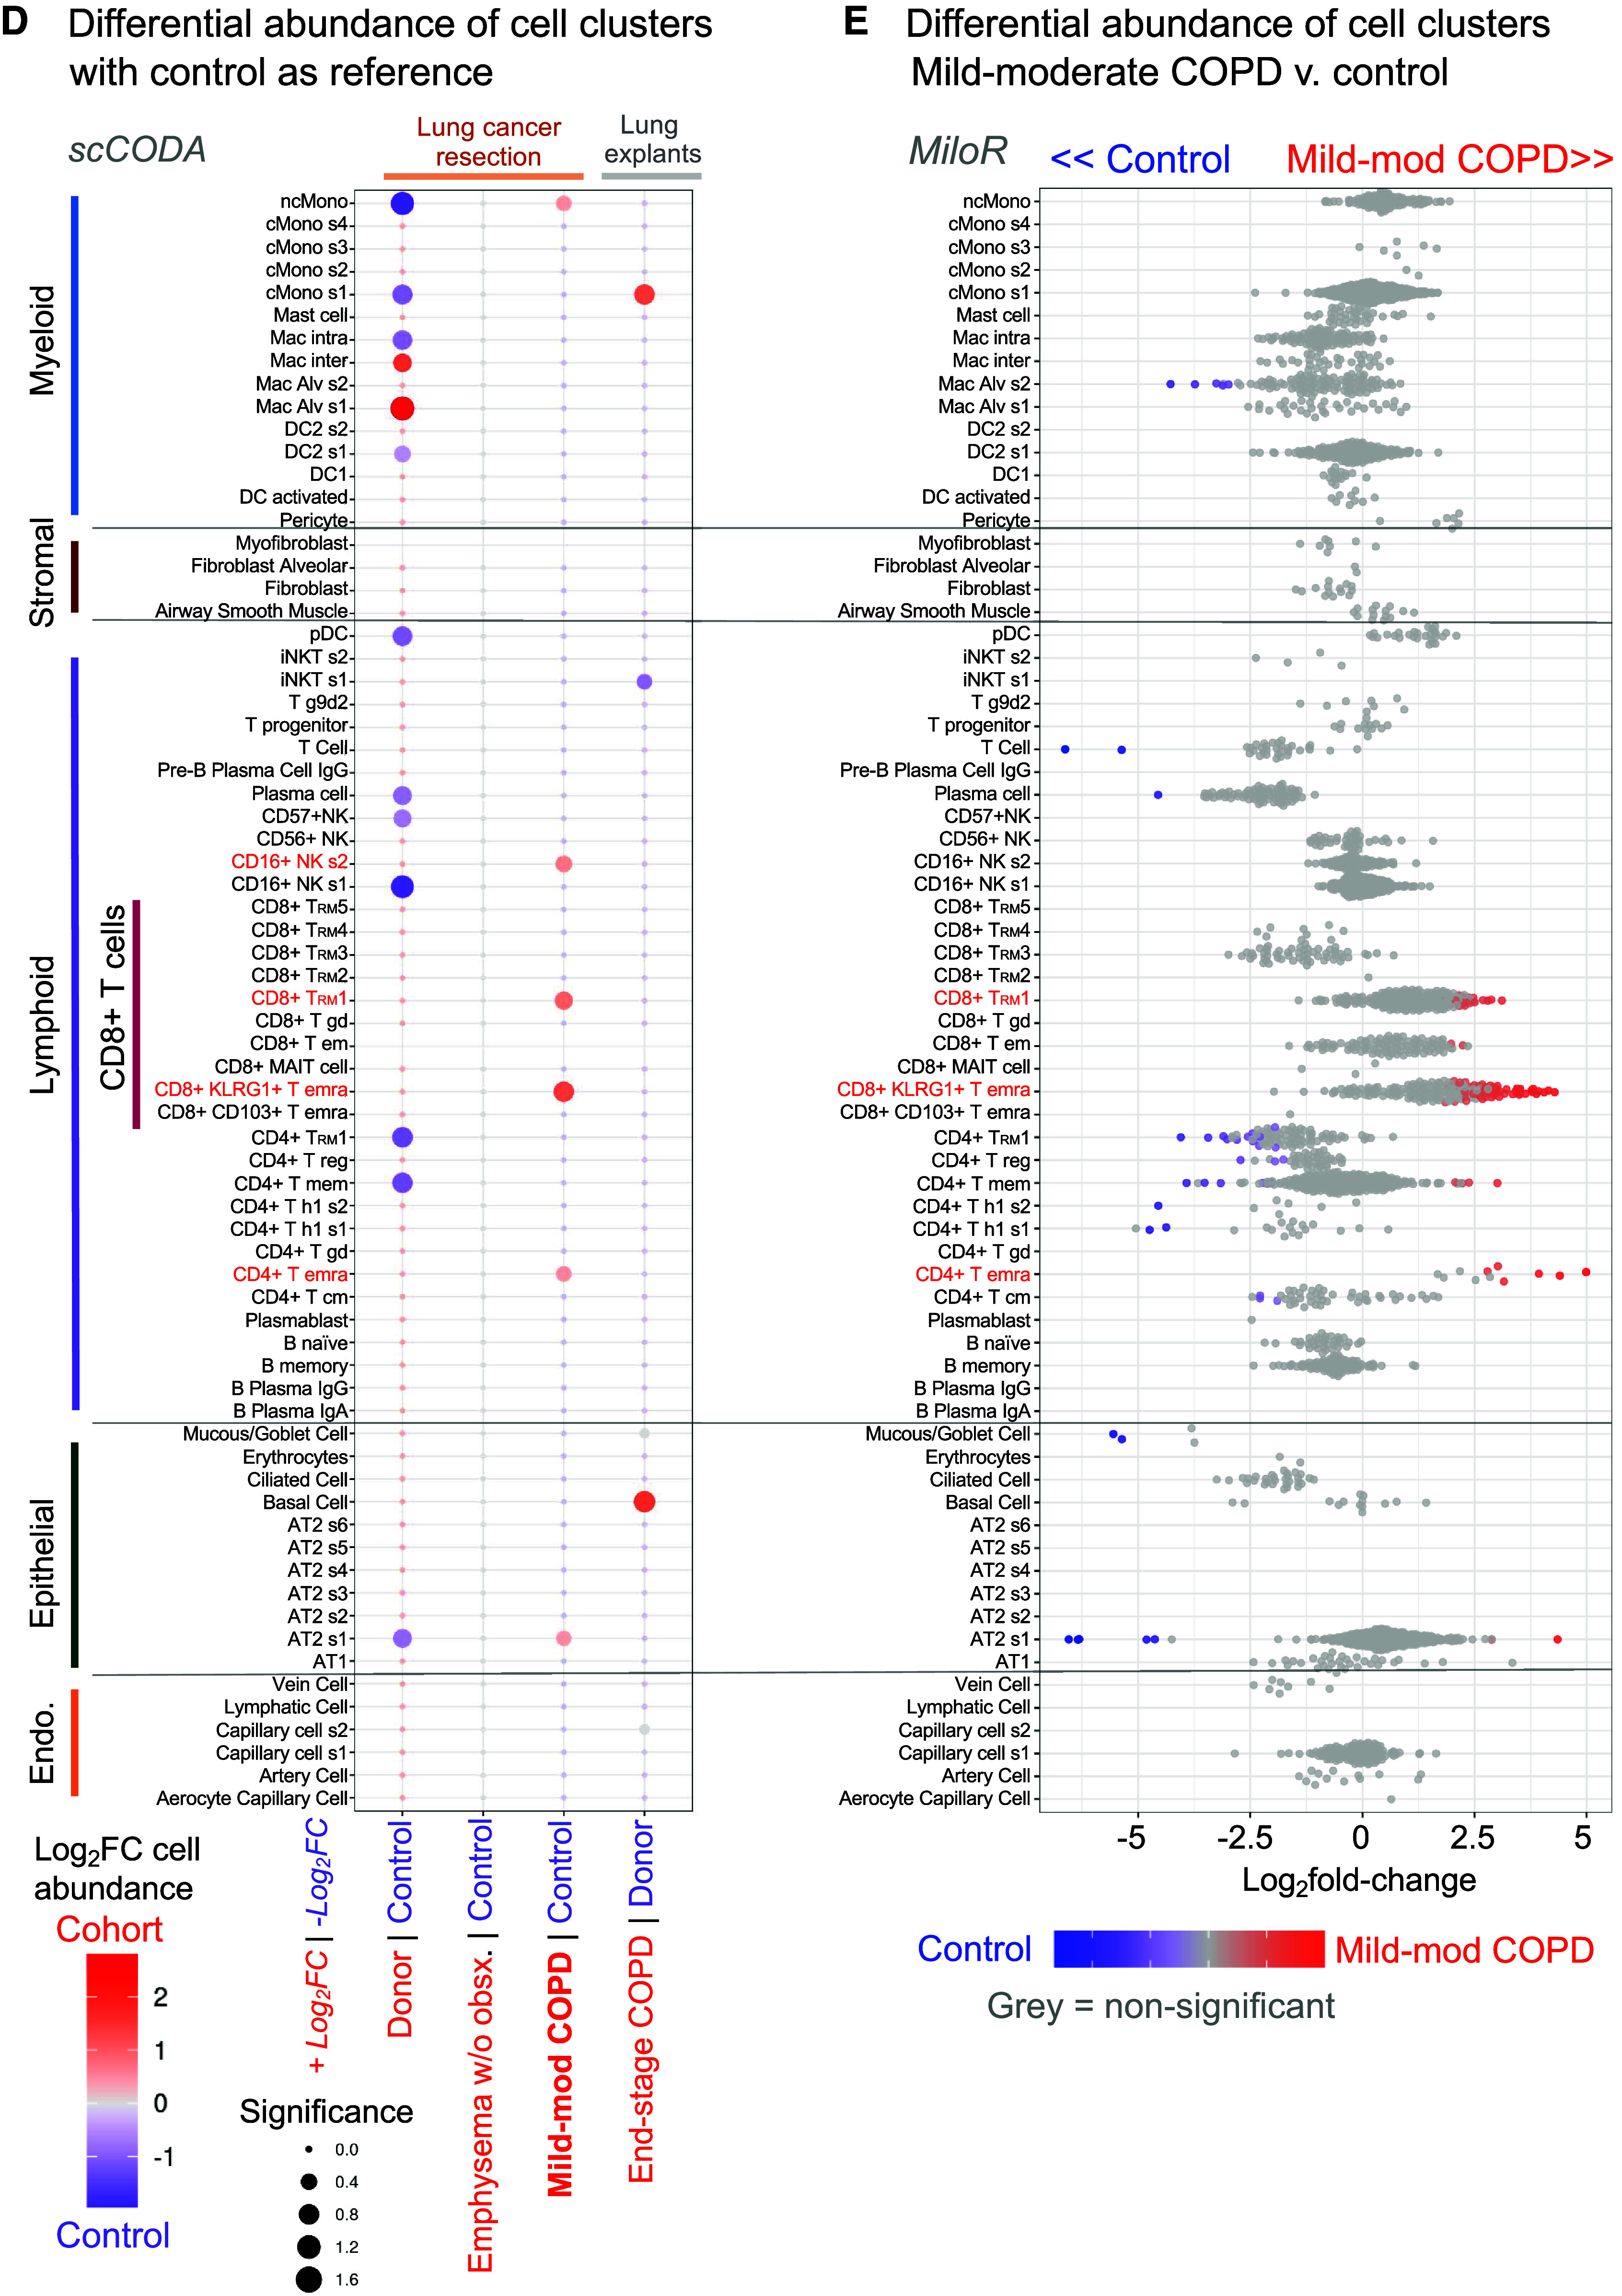
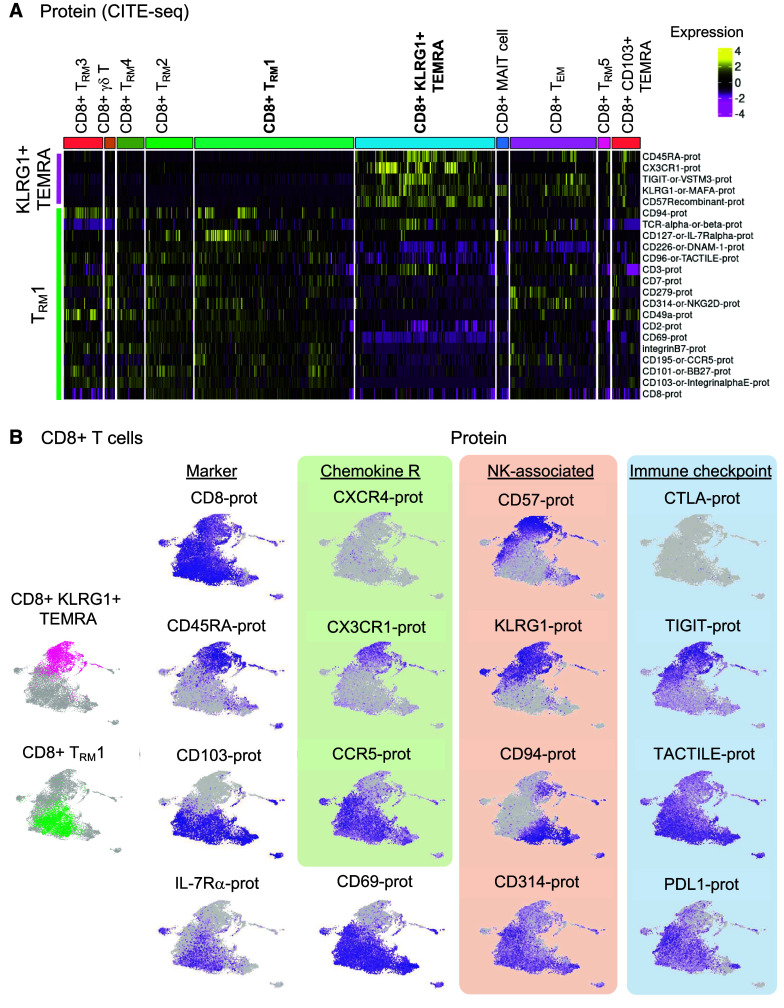
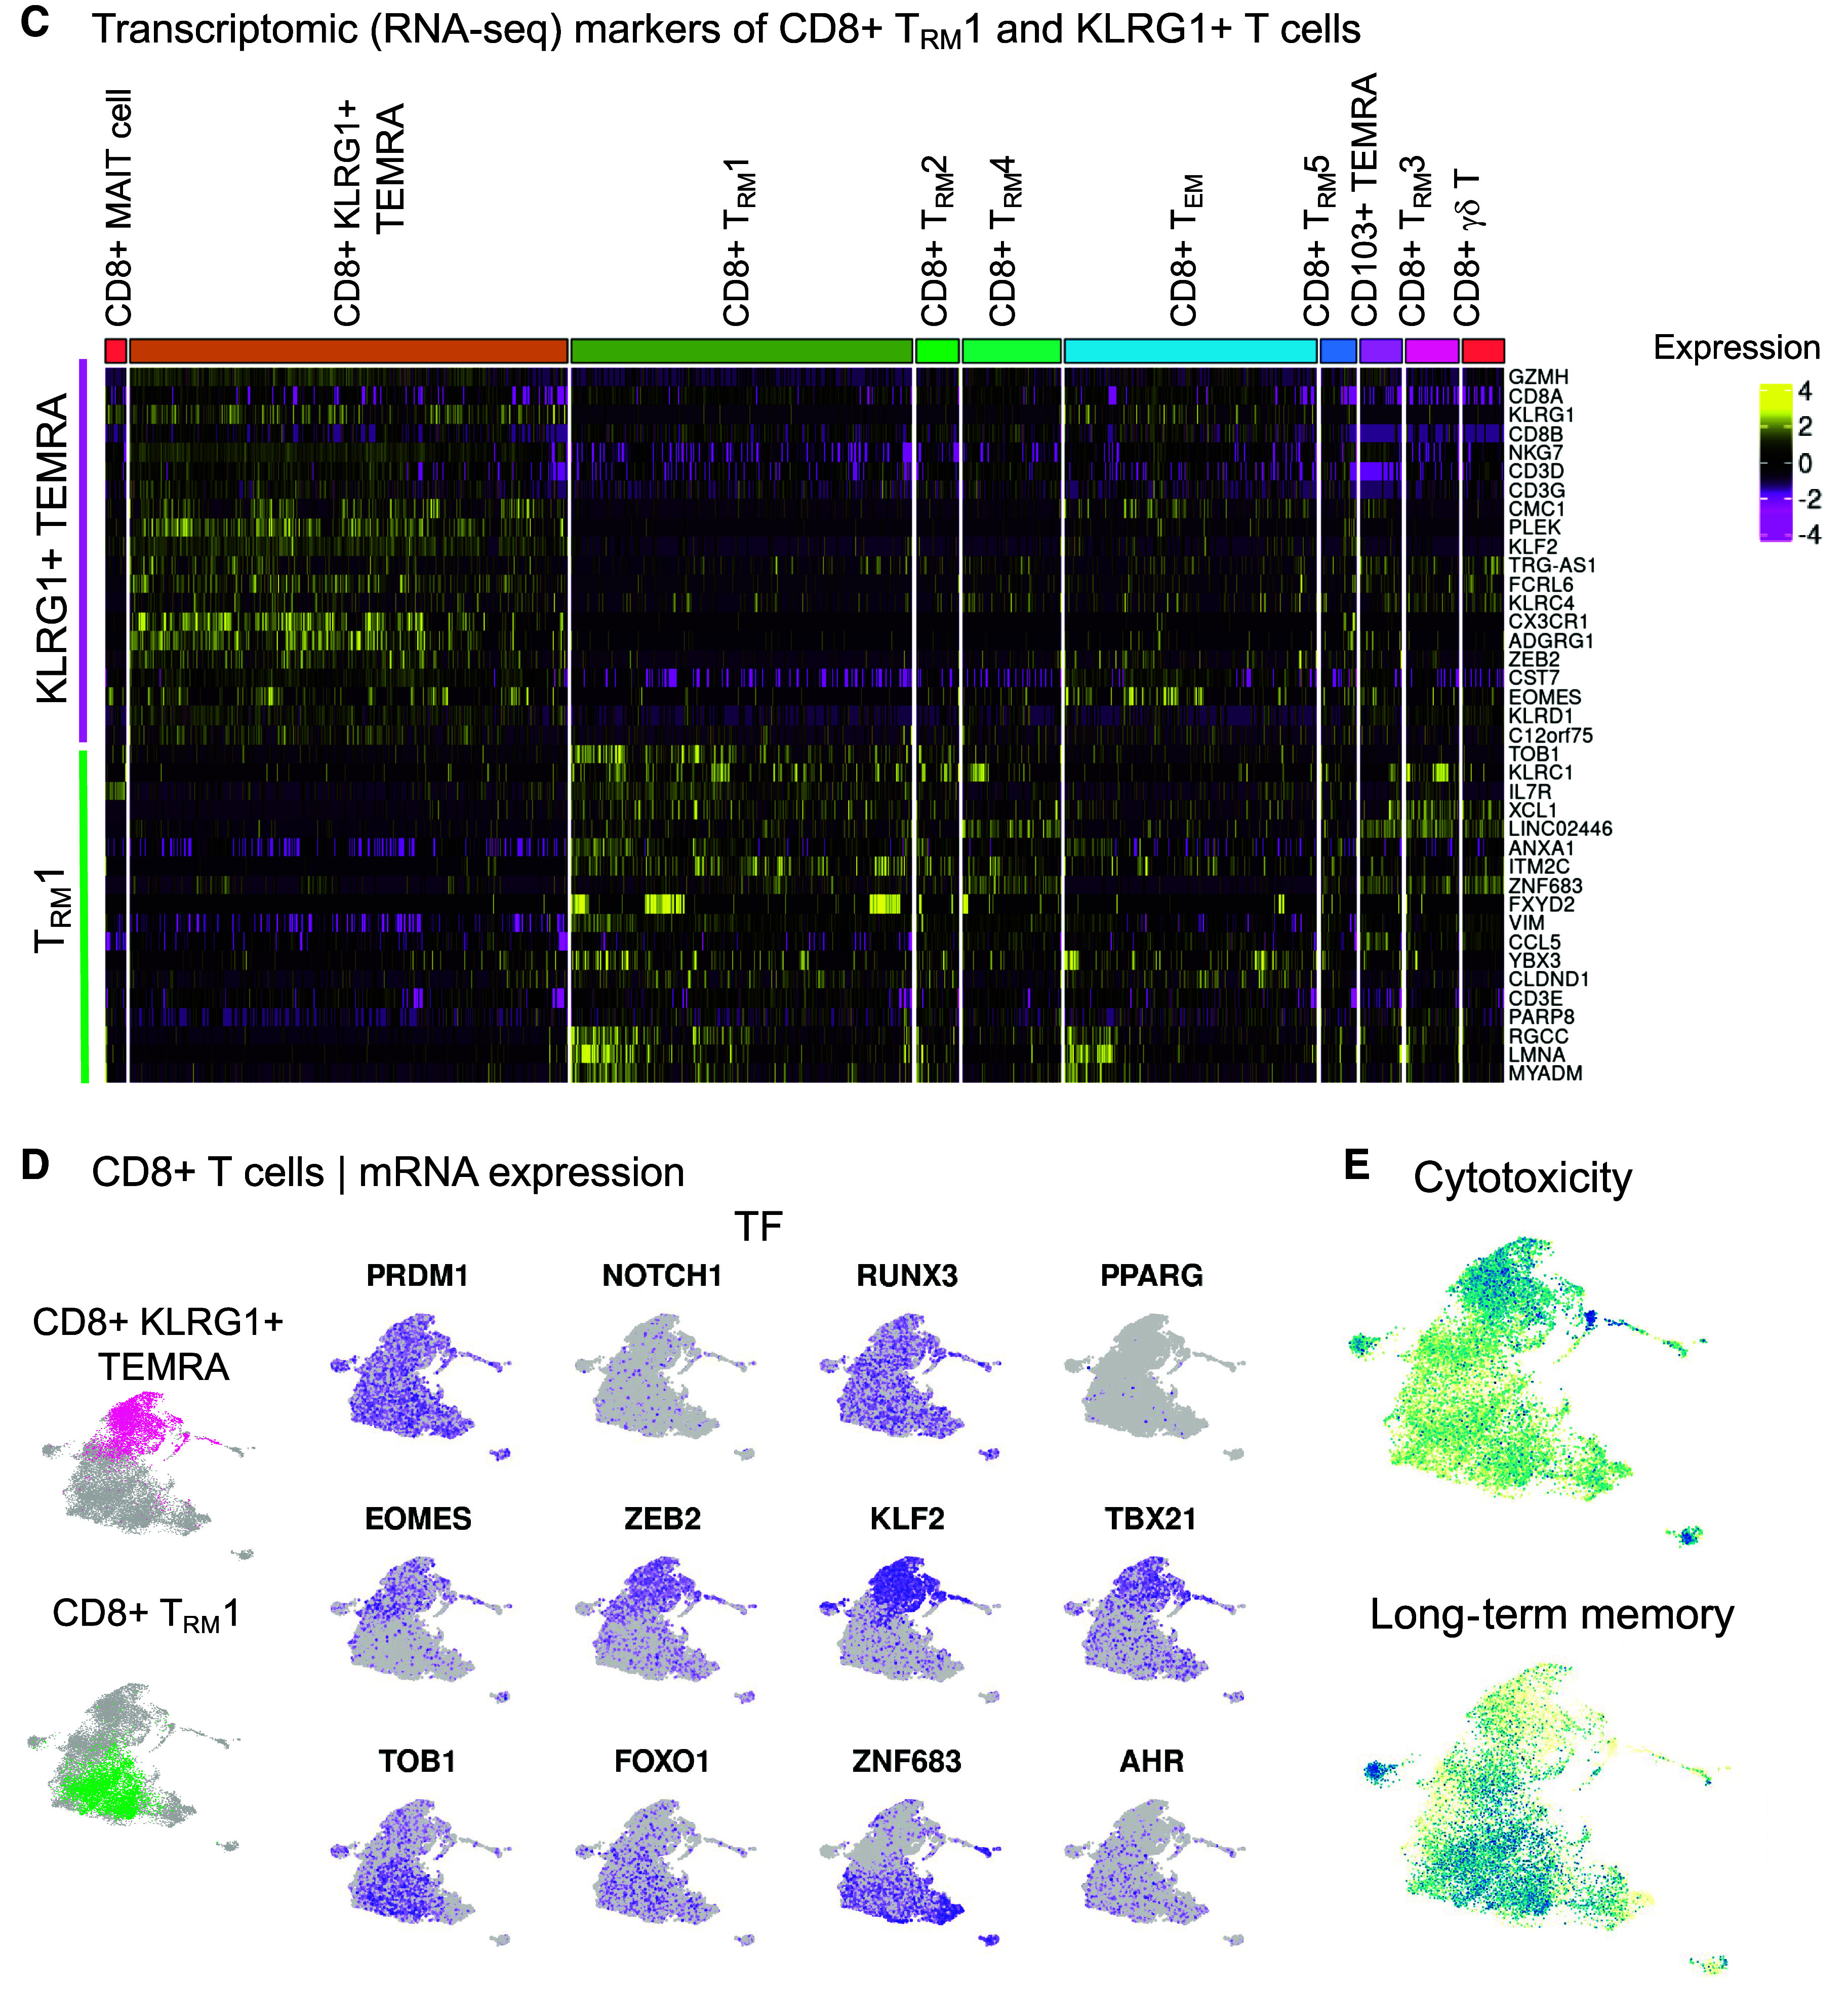
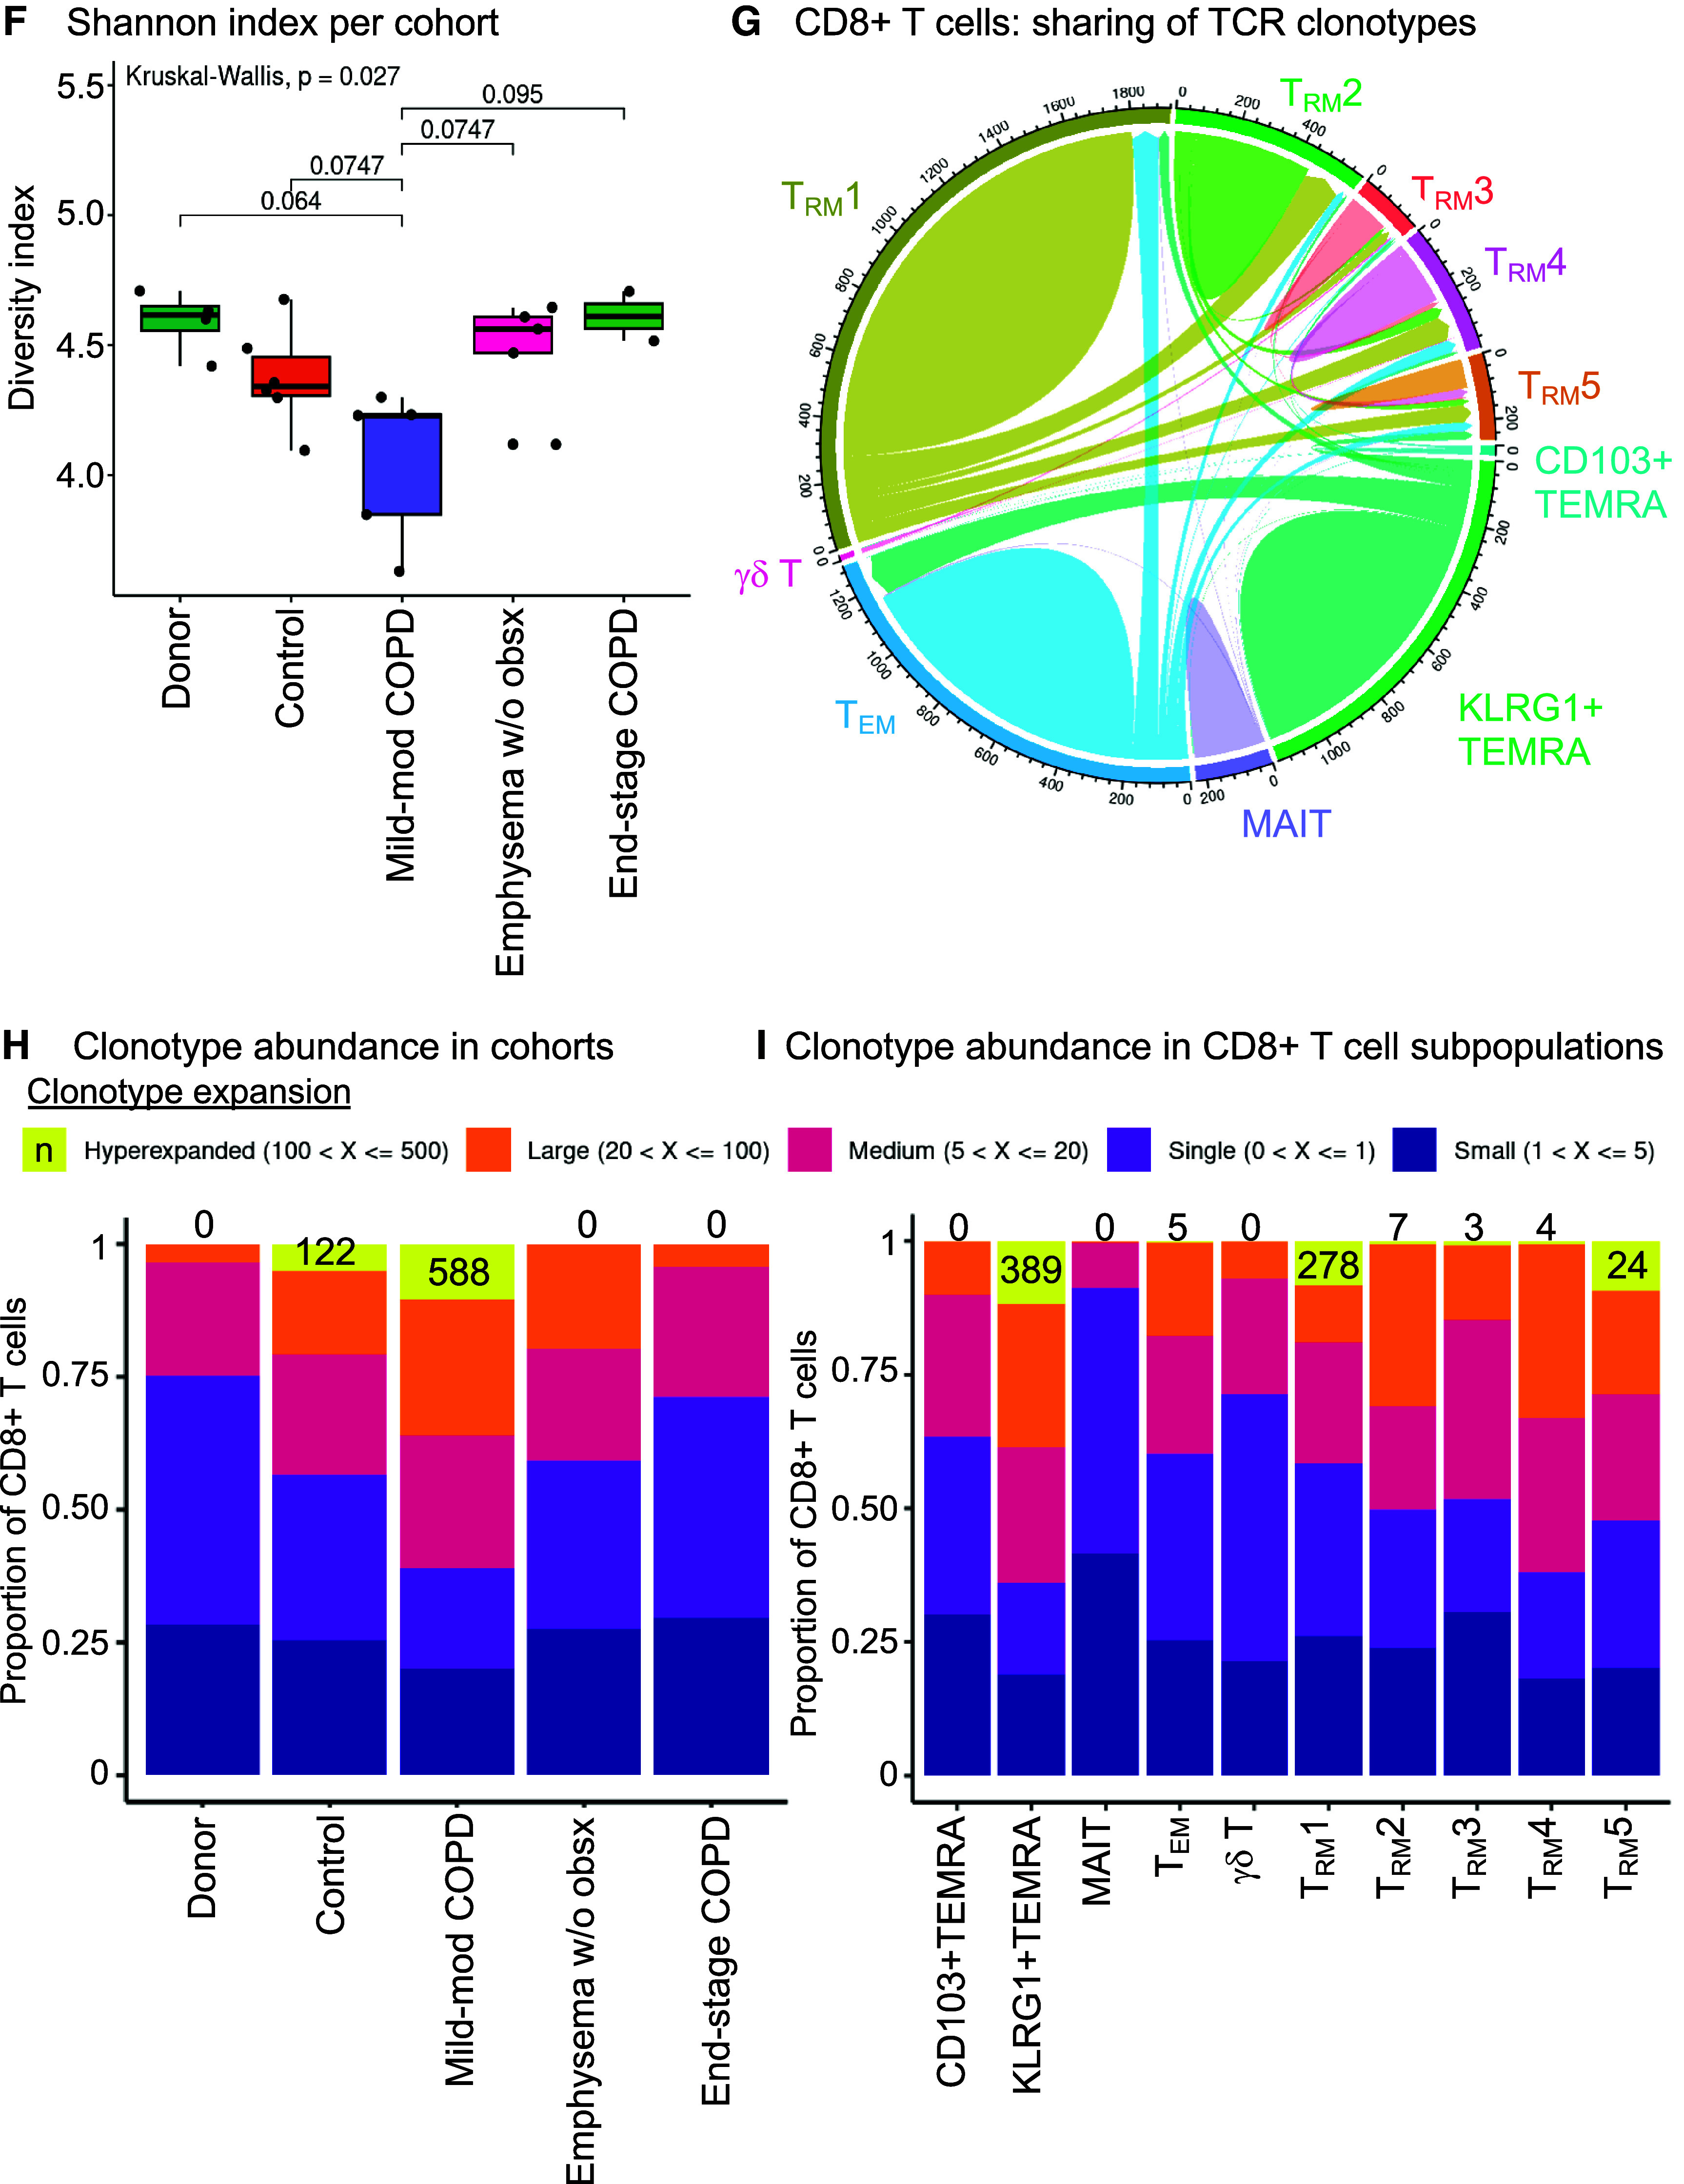
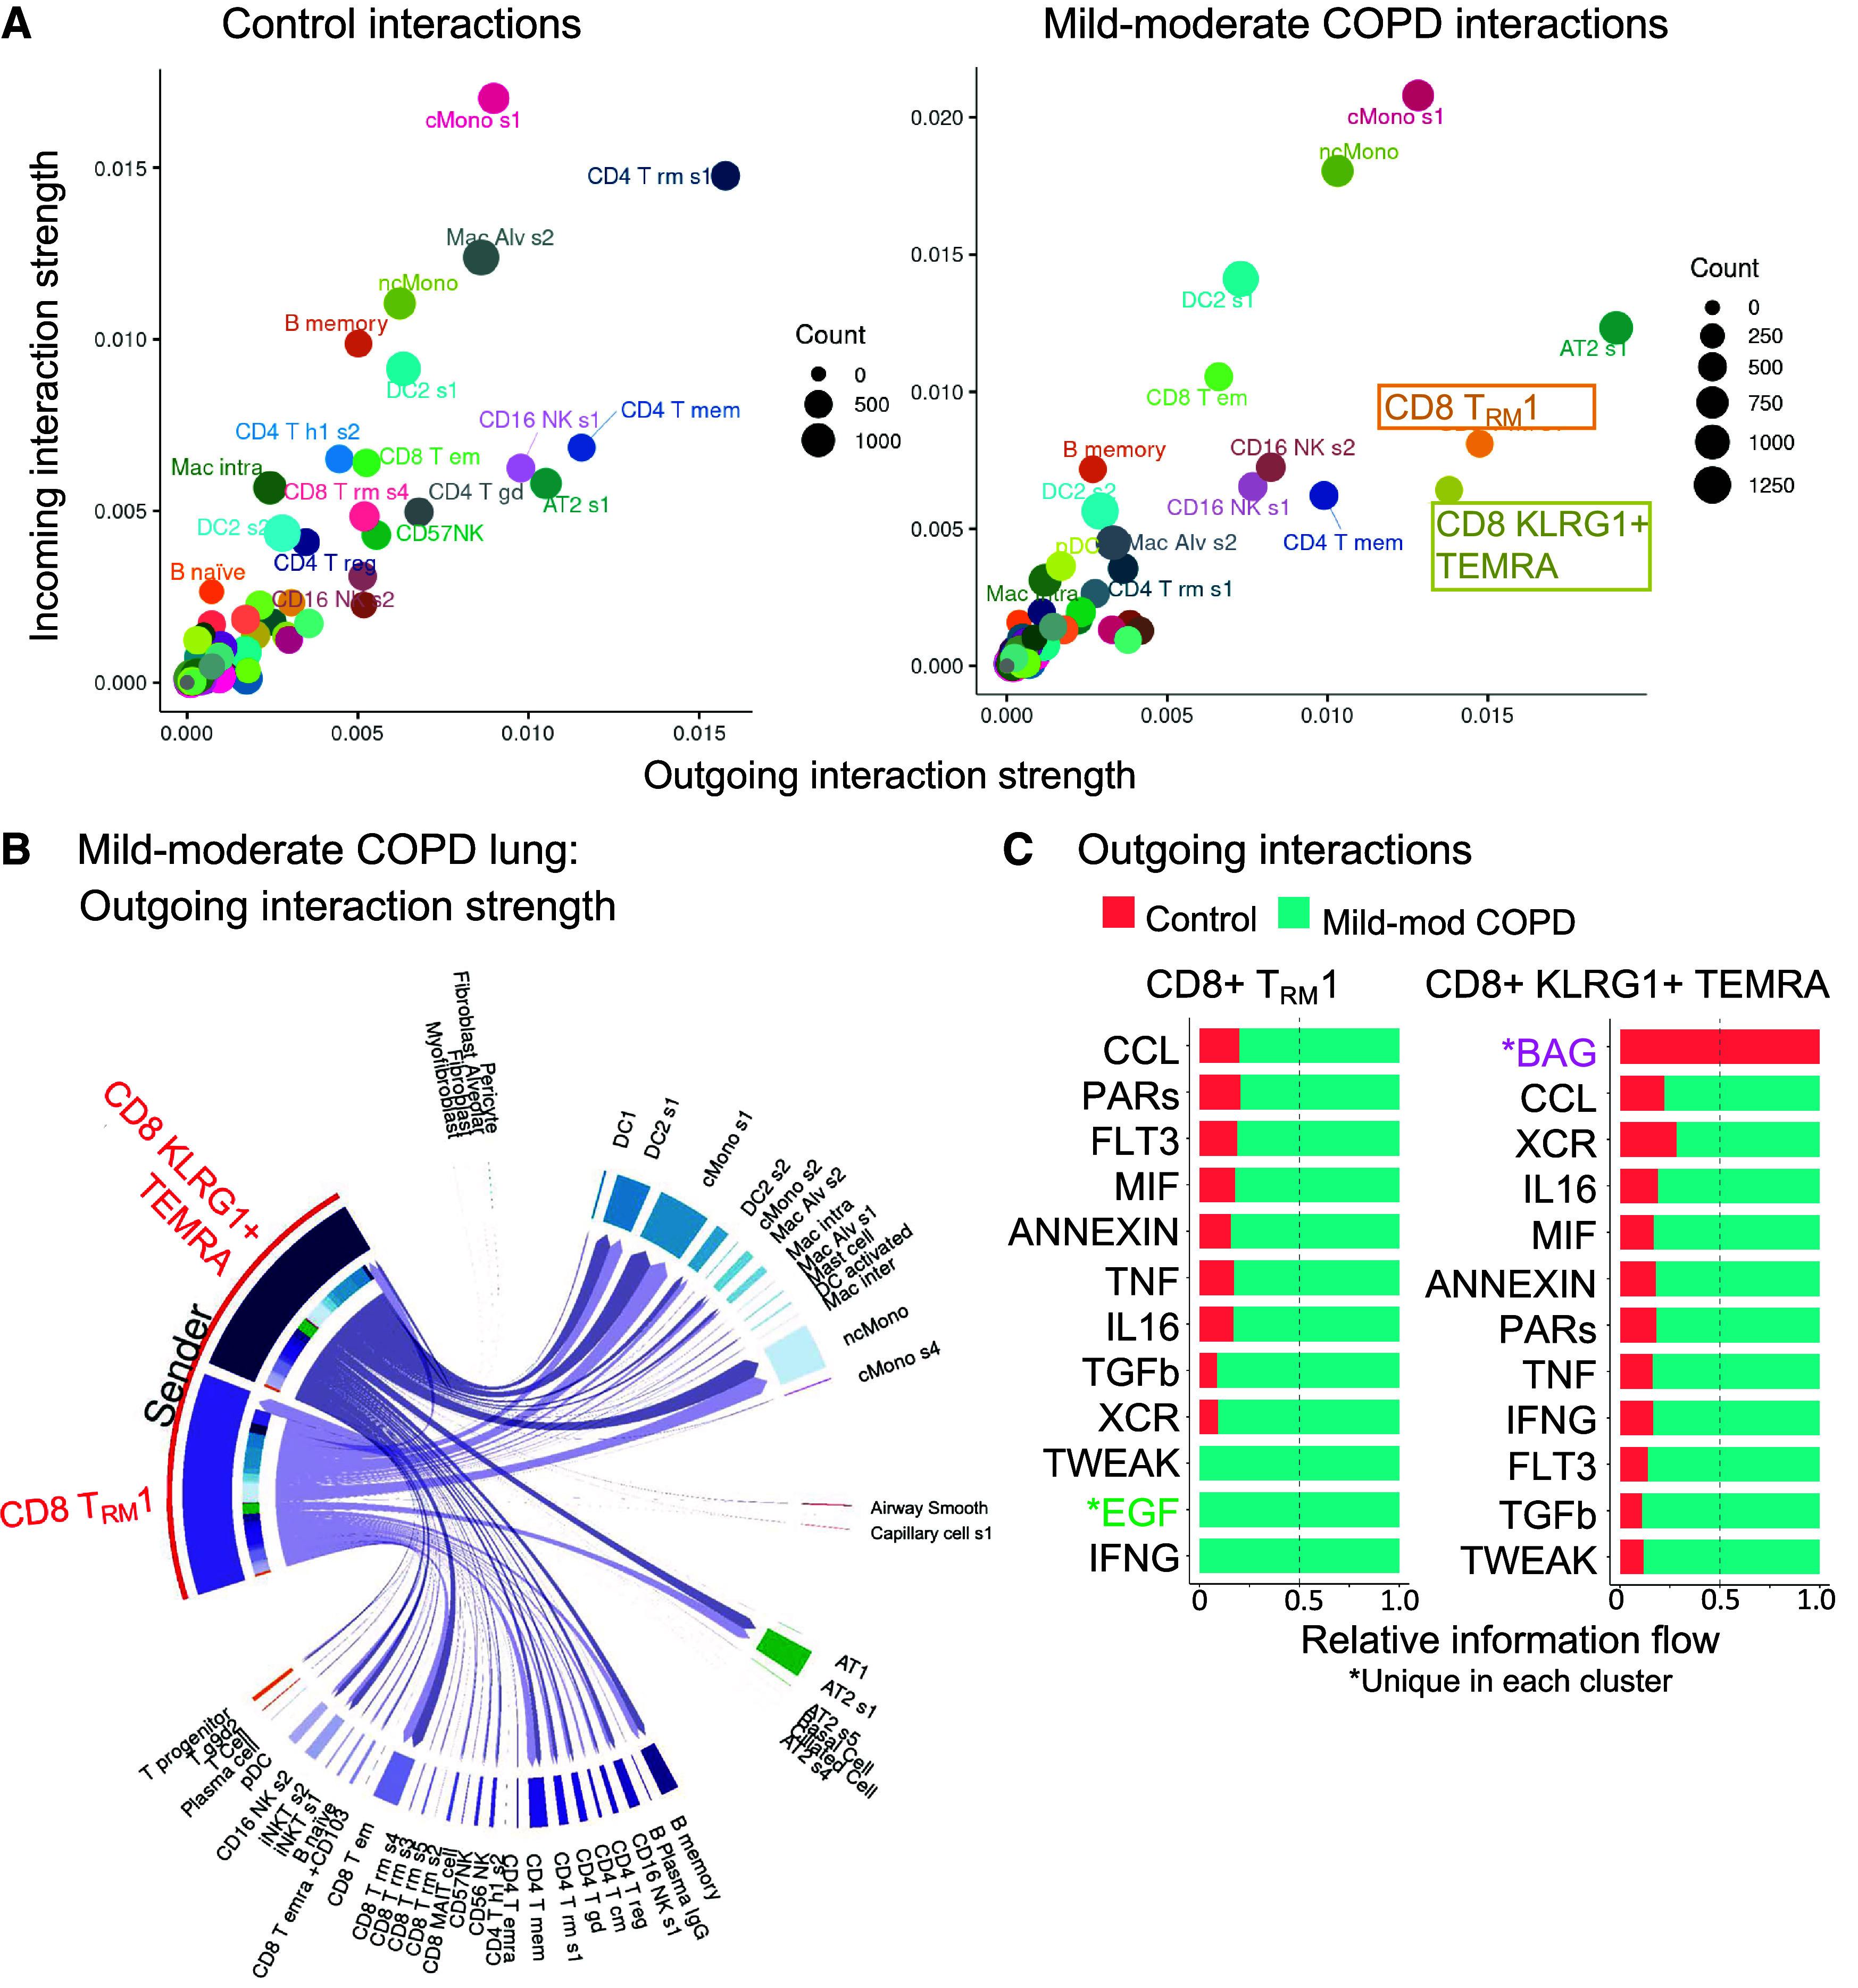
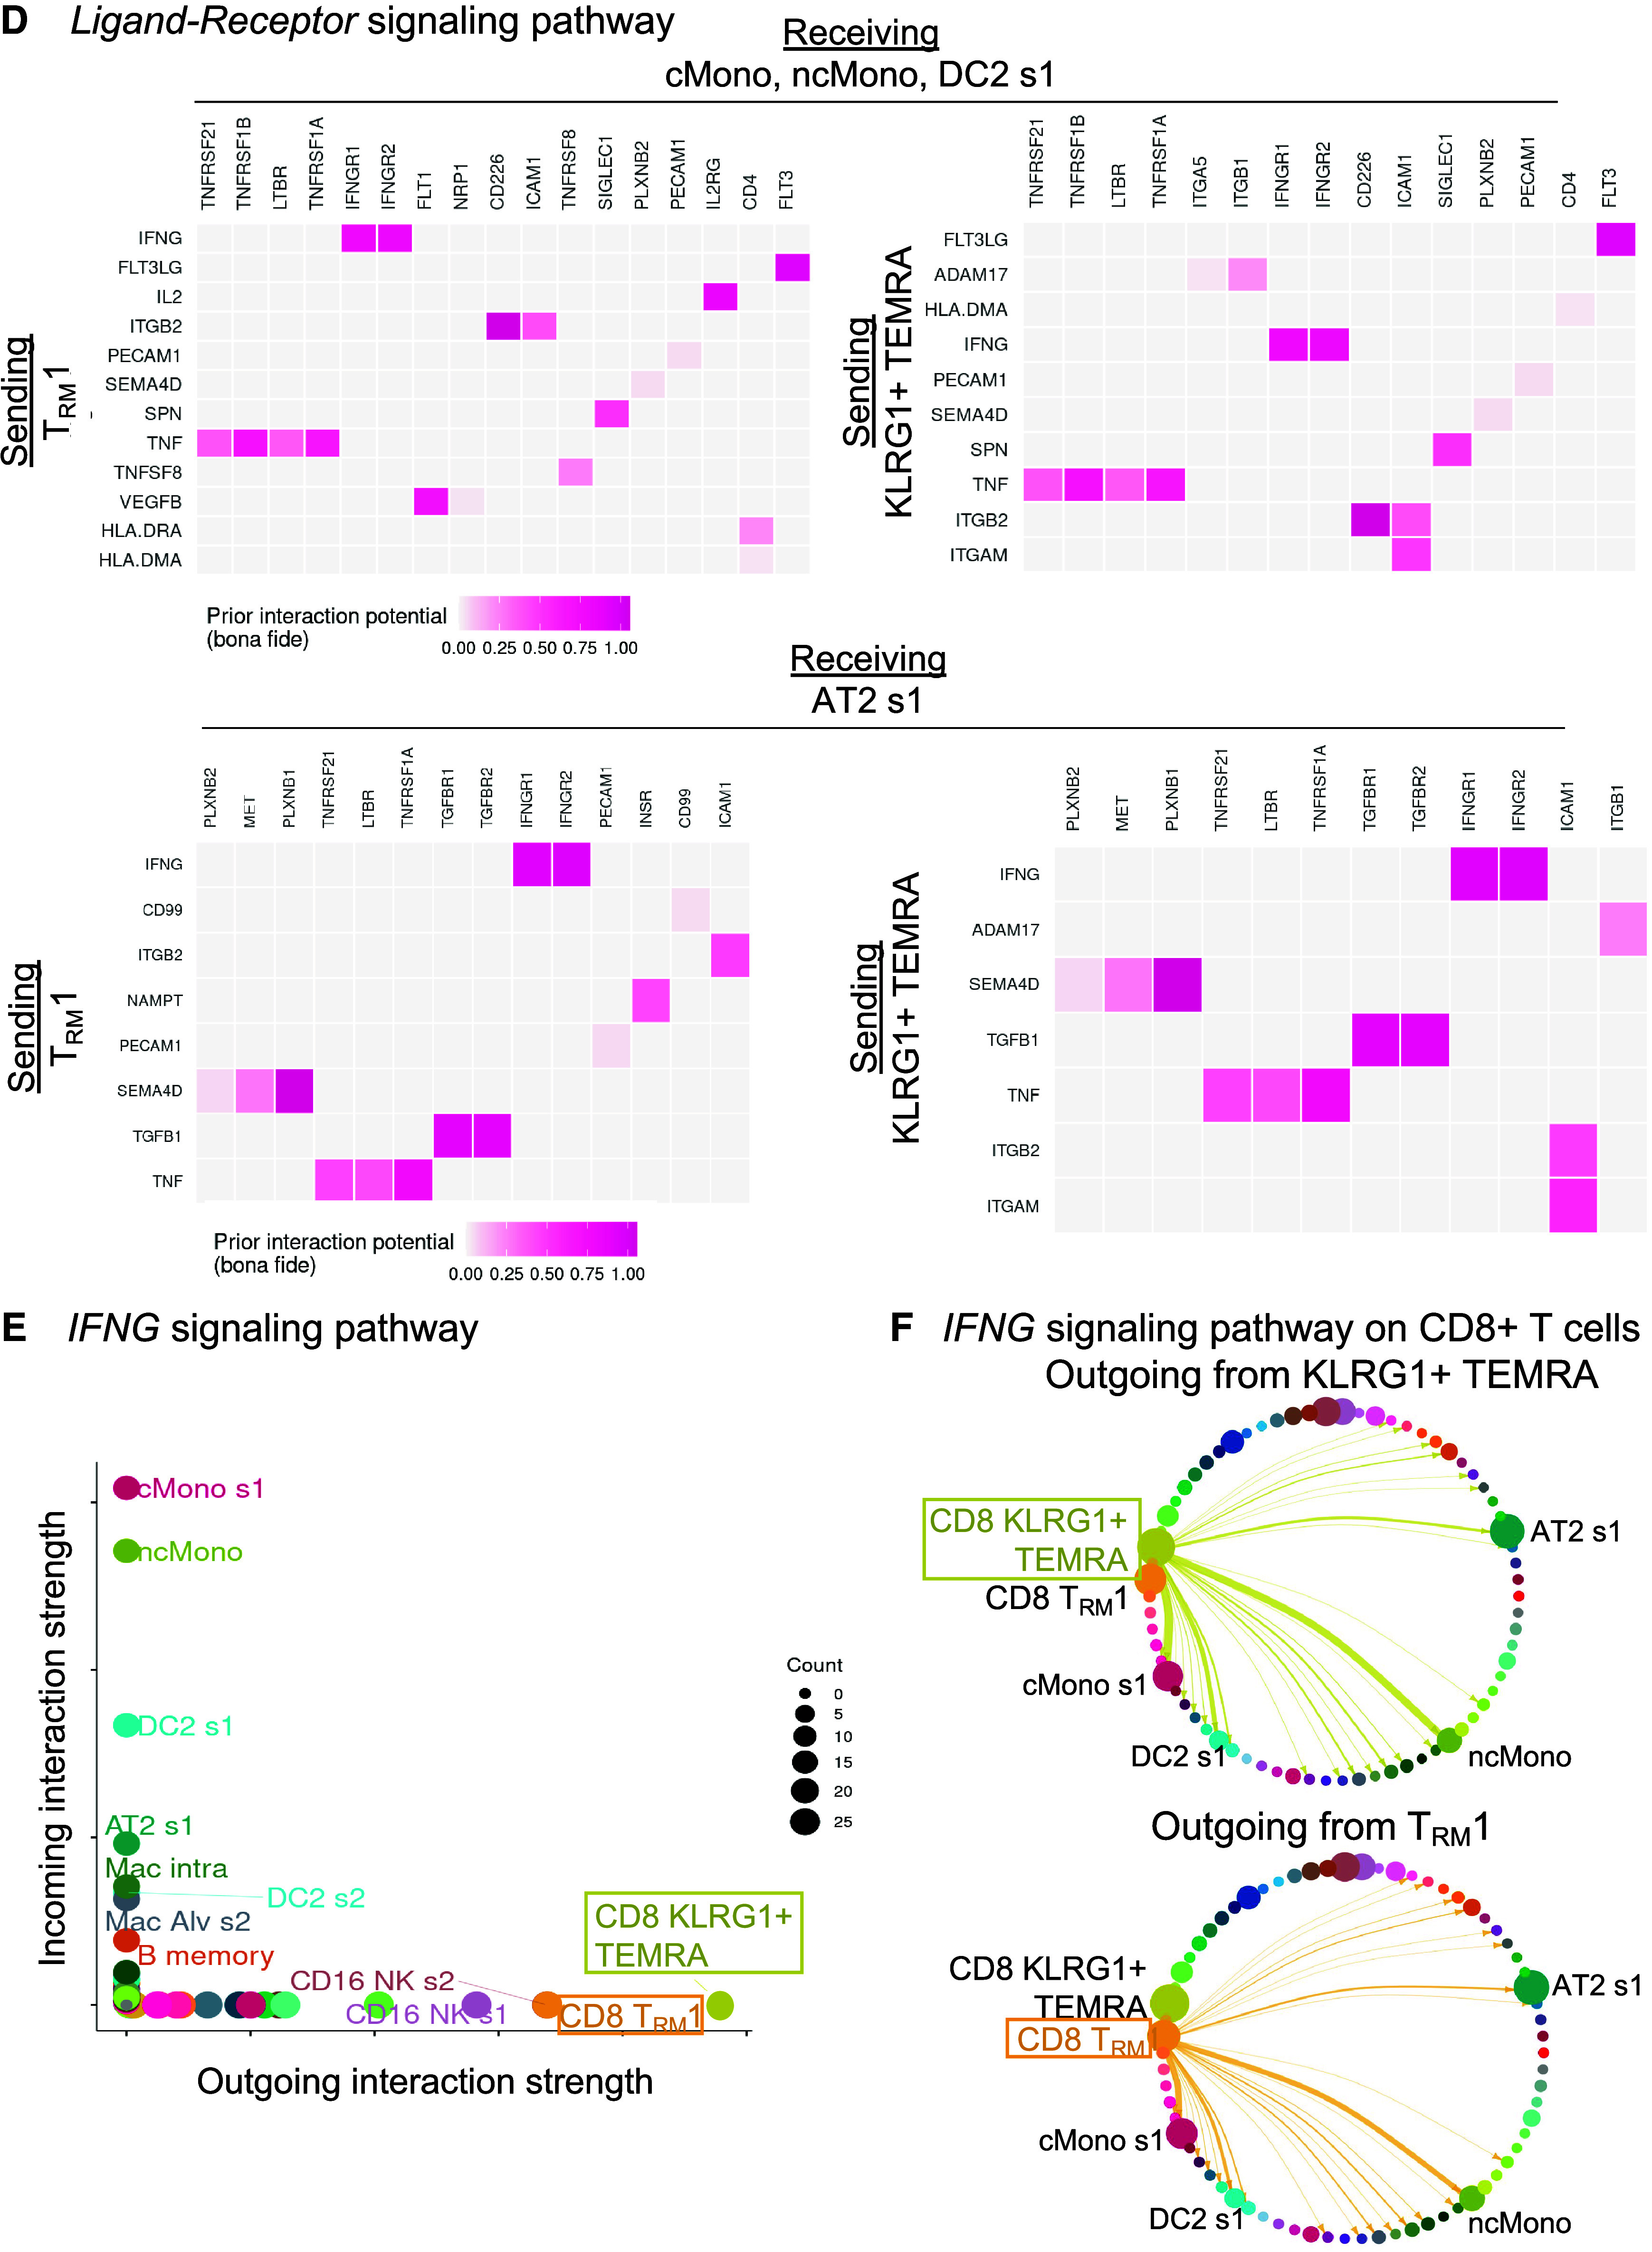
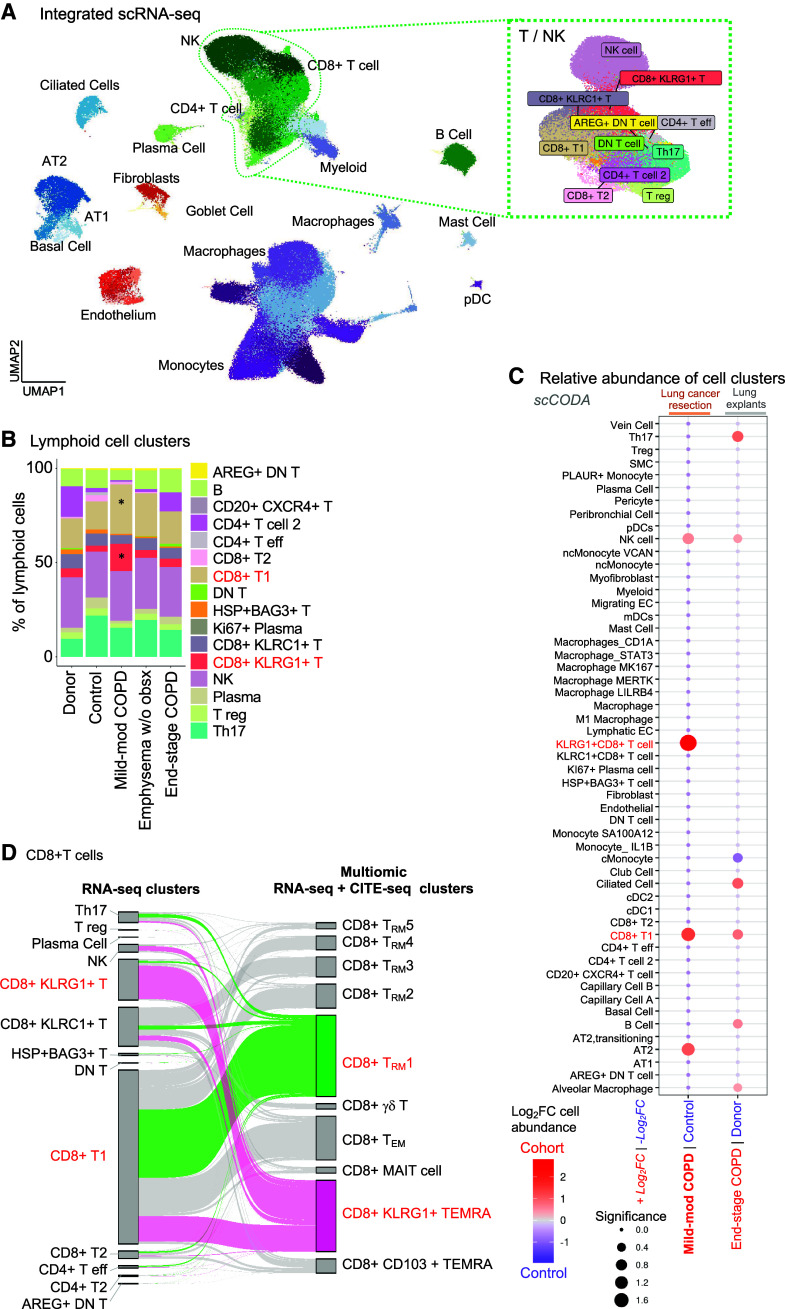
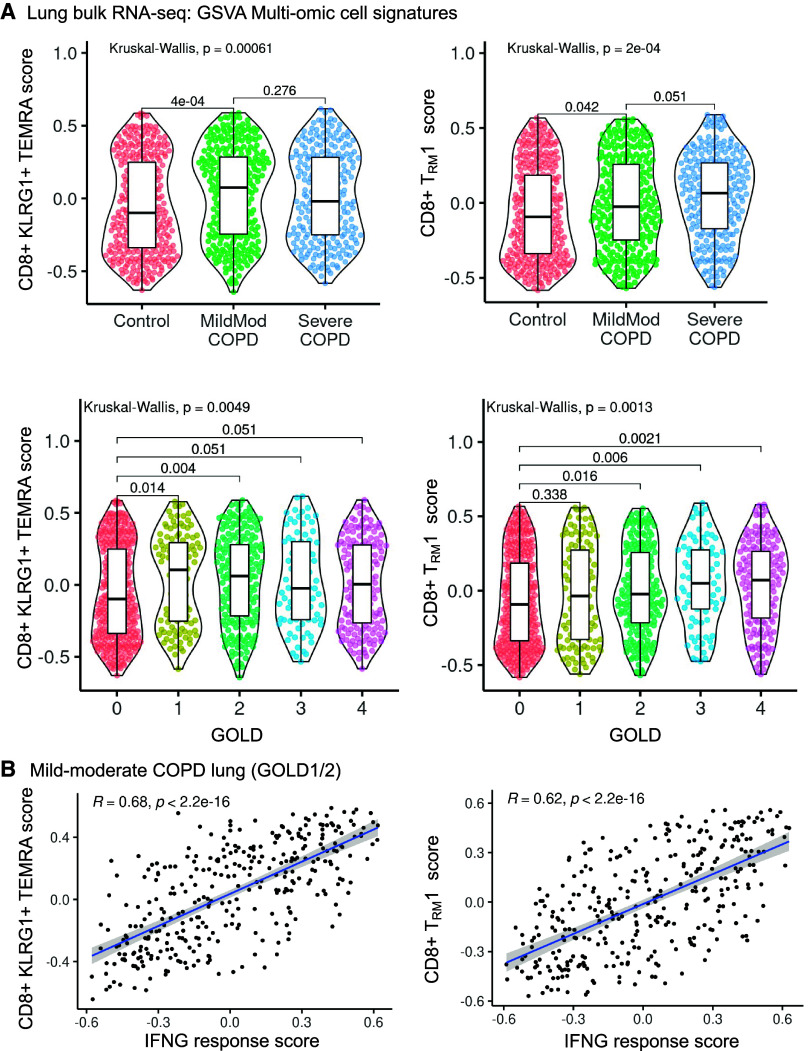
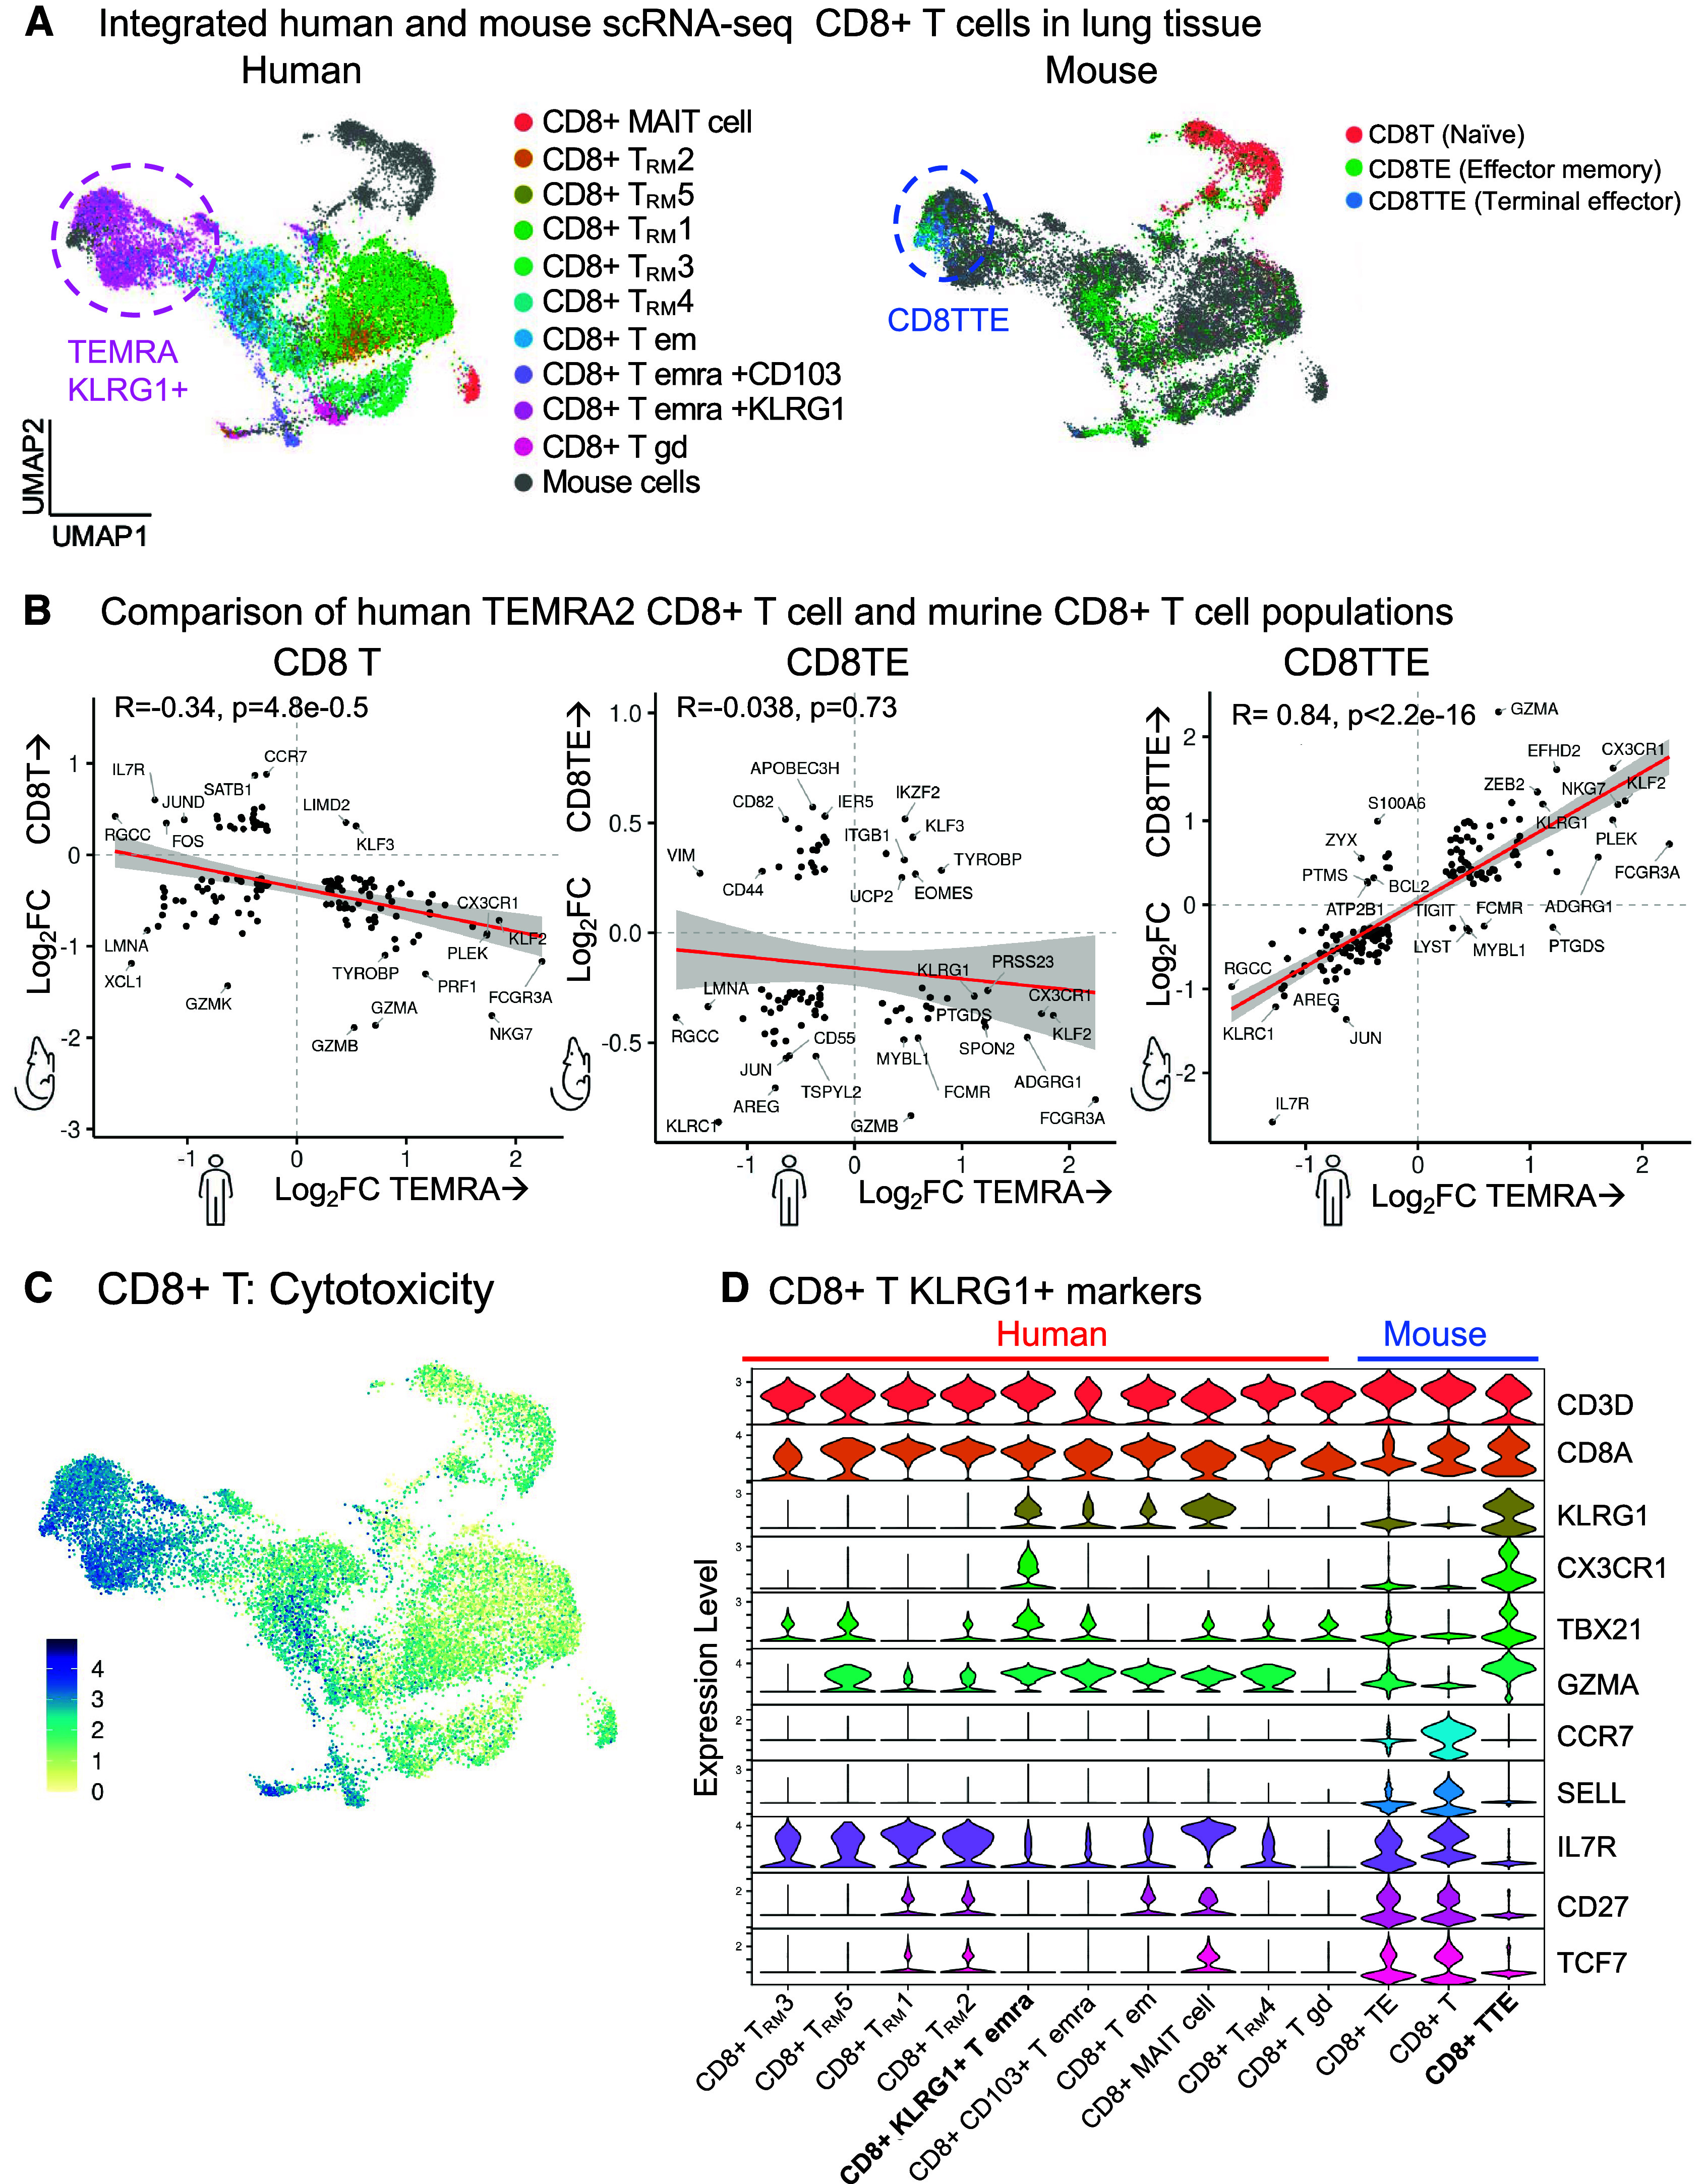
Rationale: Despite the importance of inflammation in chronic obstructive pulmonary disease (COPD), the immune cell landscape in the lung tissue of patients with mild-moderate disease has not been well characterized at the single-cell and molecular level. Objectives: To define the immune cell landscape in lung tissue from patients with mild-moderate COPD at single-cell resolution. Methods: We performed single-cell transcriptomic, proteomic, and T-cell receptor repertoire analyses on lung tissue from patients with mild-moderate COPD (n = 5, Global Initiative for Chronic Obstructive Lung Disease I or II), emphysema without airflow obstruction (n = 5), end-stage COPD (n = 2), control (n = 6), or donors (n = 4). We validated in an independent patient cohort (N = 929) and integrated with the Hhip+/- murine model of COPD. Measurements and Main Results: Mild-moderate COPD lungs have increased abundance of two CD8+ T cell subpopulations: cytotoxic KLRG1+TIGIT+CX3CR1+ TEMRA (T effector memory CD45RA+) cells, and DNAM-1+CCR5+ T resident memory (TRM) cells. These CD8+ T cells interact with myeloid and alveolar type II cells via IFNG and have hyperexpanded T-cell receptor clonotypes. In an independent cohort, the CD8+KLRG1+ TEMRA cells are increased in mild-moderate COPD lung compared with control or end-stage COPD lung. Human CD8+KLRG1+ TEMRA cells are similar to CD8+ T cells driving inflammation in an aging-related murine model of COPD. Conclusions: CD8+ TEMRA cells are increased in mild-moderate COPD lung and may contribute to inflammation that precedes severe disease. Further study of these CD8+ T cells may have therapeutic implications for preventing severe COPD.

Keywords: RNA sequence analysis; chronic obstructive pulmonary disease; memory T cells; multiomics; proteomics.


Figures

Figure 1.
Figure 1.
CD8+ T effector memory CD45RA+ (TEMRA) and T resident memory (TRM) cells have increased abundance in mild-moderate chronic obstructive pulmonary disease (COPD) lung. (A) Study approach. Lung tissues surgically resected from patients without chronic lung disease (control), mild-moderate COPD, or emphysema without airway obstruction (emphysema w/o obsx) were compared with lungs from explanted “donors” and patients undergoing lung transplantation for COPD (end-stage COPD). Single-cell transcriptomic and proteomic analyses of these lung tissues were compared with independent patient cohorts and a murine model of COPD. (B–D) Single-cell RNA-sequencing (scRNA-seq) and scCITE-seq analysis of lung tissue. (B) UMAP visualization of cell clusters; inset: CD8+ T-cell clusters. (C) Transcriptional and protein markers defining CD8+ T-cell clusters. Red indicates cell clusters enriched in mild-moderate COPD compared to other patient subcohorts. (D) Relative abundance of cell clusters in pairwise comparison of patient subcohorts using the scCODA computational pipeline; red indicates cell clusters enriched in the red subcohort compared with control or donor. (E) Relative abundance of cell clusters in mild-moderate COPD tested by the MiloR computational pipeline; red indicates clusters enriched compared with control. AT2 = alveolar type II; CITE-seq = cellular indexing of transcriptomes and epitopes; NK = natural killer.
Figure 1.
Figure 1.
CD8+ T effector memory CD45RA+ (TEMRA) and T resident memory (TRM) cells have increased abundance in mild-moderate chronic obstructive pulmonary disease (COPD) lung. (A) Study approach. Lung tissues surgically resected from patients without chronic lung disease (control), mild-moderate COPD, or emphysema without airway obstruction (emphysema w/o obsx) were compared with lungs from explanted “donors” and patients undergoing lung transplantation for COPD (end-stage COPD). Single-cell transcriptomic and proteomic analyses of these lung tissues were compared with independent patient cohorts and a murine model of COPD. (B–D) Single-cell RNA-sequencing (scRNA-seq) and scCITE-seq analysis of lung tissue. (B) UMAP visualization of cell clusters; inset: CD8+ T-cell clusters. (C) Transcriptional and protein markers defining CD8+ T-cell clusters. Red indicates cell clusters enriched in mild-moderate COPD compared to other patient subcohorts. (D) Relative abundance of cell clusters in pairwise comparison of patient subcohorts using the scCODA computational pipeline; red indicates cell clusters enriched in the red subcohort compared with control or donor. (E) Relative abundance of cell clusters in mild-moderate COPD tested by the MiloR computational pipeline; red indicates clusters enriched compared with control. AT2 = alveolar type II; CITE-seq = cellular indexing of transcriptomes and epitopes; NK = natural killer.
Figure 2.
Figure 2.
CD8+KLRG1+ T effector memory CD45RA+ (TEMRA) and T resident memory 1 (TRM1) cells have distinct immunophenotypes in mild-moderate chronic obstructive pulmonary disease (COPD) lung. CD8+ T-cell clusters are examined in the multiomic integration of single-cell RNA-seq, CITE-seq, and T-cell receptor (TCR) sequence repertoire analysis of lung tissue. (A–E) Lung tissue from mild-moderate COPD is examined. (A and B) CITE-seq dataset of protein expression. (A) Heatmap of proteins differentially expressed in CD8+KLRG1+ TEMRA and TRM1 cells, by CD8+ T cell cluster. (B) UMAP visualization of differentially expressed proteins. (C–E) RNA-seq dataset of mRNA expression. (C) Heatmap of transcripts differentially expressed in CD8+KLRG1+ TEMRA and TRM1 cells, by CD8+ T cell cluster. (D) UMAP visualization of differentially expressed genes. (E) UMAP visualization of differentially expressed pathways and associated genes. (F) Boxplot of clonotype diversity measured by Shannon index by patient (dot) and grouped by subcohort. (G) The sharing of TCR clonotype among CD8+ T cell clusters in mild-moderate COPD lungs. (H and I) Each CD8+ T cell is classified by its clonotypic expansion, ranging from single T cell with a specific clonotype to hyperexpanded (>100 T cells with same TCR clonotype). The proportion of CD8+ T cells in each classification is shown by: (H) patient subcohort; and (I) CD8+ T-cell cluster within mild-moderate COPD lung tissue. Emphysema w/o obsx = emphysema without airway obstruction; NK = natural killer.
Figure 2.
Figure 2.
CD8+KLRG1+ T effector memory CD45RA+ (TEMRA) and T resident memory 1 (TRM1) cells have distinct immunophenotypes in mild-moderate chronic obstructive pulmonary disease (COPD) lung. CD8+ T-cell clusters are examined in the multiomic integration of single-cell RNA-seq, CITE-seq, and T-cell receptor (TCR) sequence repertoire analysis of lung tissue. (A–E) Lung tissue from mild-moderate COPD is examined. (A and B) CITE-seq dataset of protein expression. (A) Heatmap of proteins differentially expressed in CD8+KLRG1+ TEMRA and TRM1 cells, by CD8+ T cell cluster. (B) UMAP visualization of differentially expressed proteins. (C–E) RNA-seq dataset of mRNA expression. (C) Heatmap of transcripts differentially expressed in CD8+KLRG1+ TEMRA and TRM1 cells, by CD8+ T cell cluster. (D) UMAP visualization of differentially expressed genes. (E) UMAP visualization of differentially expressed pathways and associated genes. (F) Boxplot of clonotype diversity measured by Shannon index by patient (dot) and grouped by subcohort. (G) The sharing of TCR clonotype among CD8+ T cell clusters in mild-moderate COPD lungs. (H and I) Each CD8+ T cell is classified by its clonotypic expansion, ranging from single T cell with a specific clonotype to hyperexpanded (>100 T cells with same TCR clonotype). The proportion of CD8+ T cells in each classification is shown by: (H) patient subcohort; and (I) CD8+ T-cell cluster within mild-moderate COPD lung tissue. Emphysema w/o obsx = emphysema without airway obstruction; NK = natural killer.
Figure 3.
Figure 3.
CD8+ T cells interact with myeloid and alveolar type II (AT2) cells by inflammatory axes in mild-moderate chronic obstructive pulmonary disease (COPD) lung. Interactome analyses were performed on the single-cell RNA-sequencing (scRNA-seq) dataset of lung tissue from the control or mild-moderate COPD patient subcohorts. (A–C, E, and F) Statistically significant interactions determined by the CellChat pipeline are shown. (A) Total strength of incoming (y-axis) and outgoing (x-axis) interactions for each cell cluster, by patient subcohort. (B) For CD8+KLRG1+ T effector memory CD45RA+ (TEMRA) and T resident memory 1 (TRM1) cells (red), outgoing interactions in mild-moderate COPD lung. Color density is proportional to interaction strength. Receiving cell color indicates lineage (lymphoid, purple; epithelial, green; myeloid, blue). (C) For CD8+KLRG1+ TEMRA and TRM1 cells, the strongest outgoing interactions (and their relative strength in control versus mild-moderate COPD). *Unique in each cluster. (D) Interactions were tested by the Nichenet pipeline. Interactions increased in mild-moderate COPD lung compared with control lung with adjusted P value < 0.05 are shown. Sending cells are CD8+KLRG1+ TEMRA or TRM1 cells. (Top) Receiving cells are pooled myeloid cells: classical (c) Monos (monocyte/macrophages), nonclassical (nc)Monos, and dendritic cells (DC2 cluster 1). (Bottom) Receiving cells are AT2 cluster 1. (E) For the IFNG signaling pathway in mild-moderate COPD lung, strength of incoming (y-axis) and outgoing (x-axis) interactions for each cell cluster. (F) For the IFNG signaling pathway, visualization of outgoing interactions from CD8+KLRG1+ TEMRA or TRM1 cells. Thickness of arrows and the size of receiving clusters are proportional to interaction strength. NK = natural killer.
Figure 3.
Figure 3.
CD8+ T cells interact with myeloid and alveolar type II (AT2) cells by inflammatory axes in mild-moderate chronic obstructive pulmonary disease (COPD) lung. Interactome analyses were performed on the single-cell RNA-sequencing (scRNA-seq) dataset of lung tissue from the control or mild-moderate COPD patient subcohorts. (A–C, E, and F) Statistically significant interactions determined by the CellChat pipeline are shown. (A) Total strength of incoming (y-axis) and outgoing (x-axis) interactions for each cell cluster, by patient subcohort. (B) For CD8+KLRG1+ T effector memory CD45RA+ (TEMRA) and T resident memory 1 (TRM1) cells (red), outgoing interactions in mild-moderate COPD lung. Color density is proportional to interaction strength. Receiving cell color indicates lineage (lymphoid, purple; epithelial, green; myeloid, blue). (C) For CD8+KLRG1+ TEMRA and TRM1 cells, the strongest outgoing interactions (and their relative strength in control versus mild-moderate COPD). *Unique in each cluster. (D) Interactions were tested by the Nichenet pipeline. Interactions increased in mild-moderate COPD lung compared with control lung with adjusted P value < 0.05 are shown. Sending cells are CD8+KLRG1+ TEMRA or TRM1 cells. (Top) Receiving cells are pooled myeloid cells: classical (c) Monos (monocyte/macrophages), nonclassical (nc)Monos, and dendritic cells (DC2 cluster 1). (Bottom) Receiving cells are AT2 cluster 1. (E) For the IFNG signaling pathway in mild-moderate COPD lung, strength of incoming (y-axis) and outgoing (x-axis) interactions for each cell cluster. (F) For the IFNG signaling pathway, visualization of outgoing interactions from CD8+KLRG1+ TEMRA or TRM1 cells. Thickness of arrows and the size of receiving clusters are proportional to interaction strength. NK = natural killer.
Figure 4.
Figure 4.
CD8+KLRG1+ T cells have increased abundance in mild-moderate chronic obstructive pulmonary disease (COPD) lung compared with end-stage COPD. Single-cell RNA-sequencing (scRNA-seq) datasets from this study and Adams and colleagues (14) were integrated. (A) UMAP visualization of cell clusters with lineage indicated by color. Green dotted line denotes natural killer (NK) and T-cell clusters. (B) Relative abundance of lymphoid clusters, by patient subcohort. *Indicates CD8+ T1 (tan) and CD8+KLRG1+ (orange) T cells. (C) Relative abundance of cell clusters in pairwise comparison of patient subcohorts using the scCODA computational pipeline; red indicates cell clusters enriched in COPD compared with their respective control. Red text highlight CD8+KLRG1+ and T1-cell clusters. (D) On the left, CD8+ T cells in the scRNA-seq–only analysis (from Figure 4A) are mapped to themselves on the right in the multiomic (scRNA-seq/CITE-seq) analysis (from Figure 1B). The cell cluster annotations for either the RNA-seq only (left) or multiomic (right) analyses are shown. Cells in the KLRG1+ T effector memory CD45RA+ (TEMRA) and T resident memory 1 (TRM1) multiomic clusters are highlighted as pink or green, respectively.
Figure 5.
Figure 5.
CD8+KLRG1+ T effector memory CD45RA+ (TEMRA) and T resident memory 1 (TRM1) cell gene signatures are increased in mild-moderate chronic obstructive pulmonary disease (COPD) lung in an independent cohort. Gene set variation analysis (GSVA) signature scores were generated for CD8+ T-cell clusters from the single-cell datasets and measured in a bulk RNA-seq dataset of lung tissue from an independent patient cohort (Lung Tissue Research Consortium, n = 929) of control subjects and patients with COPD. (A) GSVA signature scores for CD8+ T-cell clusters are shown by patient subcohort or Global Initiative for Chronic Obstructive Lung Disease (GOLD) classification. (B) In mild-moderate COPD lung, GSVA signature scores for CD8+ T-cell clusters are compared with an IFNγ-response signature score. (A) Kruksal-Wallis with post hoc pairwise Wilcoxon testing with P values adjusted by multiple testing correction with Benjamini-Hochberg. (B) Pearson correlation with linear regression (blue line), 95% confidence interval (gray), correlation coefficient (R), and P values (p).
Figure 6.
Figure 6.
Comparative analysis of CD8+ T cells. Single-cell RNA-sequencing (scRNA-seq) datasets of human CD8+ T cells from this study and the Hhip+/− murine model of aging-associated chronic obstructive pulmonary disease (COPD) without smoke exposure (17) are compared. The human and murine datasets were integrated into one reference map. (A) Human (left) or murine (right) cells are mapped on UMAP visualizations of the integrated dataset. (B) Using pseudobulk analysis, the differentially expressed genes in murine CD8+ T cell subpopulations (y-axis) are compared with the differentially expressed genes in human CD8+KLRG1+ T effector memory CD45RA+ (TEMRA) cells (x-axis). For each CD8+ T-cell population, gene expression is compared with all the other CD8+ T cells in that human or murine dataset. Genes with log2fold-change (FC) > 0.25 and adjusted P < 0.01 are shown. (C) UMAP visualization of the cytotoxicity pathway. (D) Transcriptional expression of genes defining human and murine CD8+ T cell clusters. (B) Spearman correlation with linear model (red), 95% confidence interval (gray), Spearman coefficient (rs) and P value.

Comment in

References

    1. Hogg JC, Chu F, Utokaparch S, Woods R, Elliott WM, Buzatu L, et al. The nature of small-airway obstruction in chronic obstructive pulmonary disease. N Engl J Med. 2004;350:2645–2653. - PubMed
    1. Barnes PJ. Inflammatory mechanisms in patients with chronic obstructive pulmonary disease. J Allergy Clin Immunol. 2016;138:16–27. - PubMed
    1. Hikichi M, Mizumura K, Maruoka S, Gon Y. Pathogenesis of chronic obstructive pulmonary disease (COPD) induced by cigarette smoke. J Thorac Dis . 2019;11:S2129–S2140. - PMC - PubMed
    1. Williams M, Todd I, Fairclough LC. The role of CD8 + T lymphocytes in chronic obstructive pulmonary disease: a systematic review. Inflamm Res . 2021;70:11–18. - PMC - PubMed
    1. Sauler M, McDonough JE, Adams TS, Kothapalli N, Barnthaler T, Werder RB, et al. Characterization of the COPD alveolar niche using single-cell RNA sequencing. Nat Commun . 2022;13:494. - PMC - PubMed

Publication types

Substances