. 2023 Dec 21;142(25):2175-2191.
doi: 10.1182/blood.2022015752.

Germ line variant GFI1-36N affects DNA repair and sensitizes AML cells to DNA damage and repair therapy

Daria Frank  1   2 Pradeep Kumar Patnana  1   2   3 Jan Vorwerk  1 Lianghao Mao  4 Lavanya Mokada Gopal  4 Noelle Jung  4 Thorben Hennig  4 Leo Ruhnke  5 Joris Maximillian Frenz  4 Maithreyan Kuppusamy  4 Robert Autry  6 Lanying Wei  1   7 Kaiyan Sun  1 Helal Mohammed Mohammed Ahmed  1   3 Axel Künstner  8   9 Hauke Busch  8   9 Heiko Müller  10 Stephan Hutter  10 Gregor Hoermann  10 Longlong Liu  1   11 Xiaoqing Xie  1   12 Yahya Al-Matary  13 Subbaiah Chary Nimmagadda  1   3 Fiorella Charles Cano  14 Michael Heuser  14 Felicitas Thol  14 Gudrun Göhring  15 Doris Steinemann  15 Jürgen Thomale  16 Theo Leitner  3 Anja Fischer  17   18 Roland Rad  17   18   19 Christoph Röllig  6 Heidi Altmann  6 Desiree Kunadt  6 Wolfgang E Berdel  1 Jana Hüve  20 Felix Neumann  20   21 Jürgen Klingauf  20   22 Virginie Calderon  23 Bertram Opalka  2 Ulrich Dührsen  2 Frank Rosenbauer  24 Martin Dugas  25 Julian Varghese  7 Hans Christian Reinhardt  2 Nikolas von Bubnoff  3 Tarik Möröy  26   27   28 Georg Lenz  1 Aarif M N Batcha  29   30 Marianna Giorgi  31 Murugan Selvam  31 Eunice Wang  31 Shannon K McWeeney  32   33   34 Jeffrey W Tyner  33   35 Friedrich Stölzel  5   36 Matthias Mann  37 Ashok Kumar Jayavelu  4   6   37   38 Cyrus Khandanpour  1   2   3
Affiliations

Germ line variant GFI1-36N affects DNA repair and sensitizes AML cells to DNA damage and repair therapy

Daria Frank et al. Blood. .

Abstract

Growth factor independence 1 (GFI1) is a DNA-binding transcription factor and a key regulator of hematopoiesis. GFI1-36N is a germ line variant, causing a change of serine (S) to asparagine (N) at position 36. We previously reported that the GFI1-36N allele has a prevalence of 10% to 15% among patients with acute myeloid leukemia (AML) and 5% to 7% among healthy Caucasians and promotes the development of this disease. Using a multiomics approach, we show here that GFI1-36N expression is associated with increased frequencies of chromosomal aberrations, mutational burden, and mutational signatures in both murine and human AML and impedes homologous recombination (HR)-directed DNA repair in leukemic cells. GFI1-36N exhibits impaired binding to N-Myc downstream-regulated gene 1 (Ndrg1) regulatory elements, causing decreased NDRG1 levels, which leads to a reduction of O6-methylguanine-DNA-methyltransferase (MGMT) expression levels, as illustrated by both transcriptome and proteome analyses. Targeting MGMT via temozolomide, a DNA alkylating drug, and HR via olaparib, a poly-ADP ribose polymerase 1 inhibitor, caused synthetic lethality in human and murine AML samples expressing GFI1-36N, whereas the effects were insignificant in nonmalignant GFI1-36S or GFI1-36N cells. In addition, mice that received transplantation with GFI1-36N leukemic cells treated with a combination of temozolomide and olaparib had significantly longer AML-free survival than mice that received transplantation with GFI1-36S leukemic cells. This suggests that reduced MGMT expression leaves GFI1-36N leukemic cells particularly vulnerable to DNA damage initiating chemotherapeutics. Our data provide critical insights into novel options to treat patients with AML carrying the GFI1-36N variant.


Conflict of interest statement

Conflict-of-interest disclosure: H.C.R. received consulting and lecture fees from AbbVie, AstraZeneca, Vertex, and Merck; received research funding from Gilead Pharmaceuticals; and is a cofounder of CDL Therapeutics GmbH. G.H. received consulting and lecture fees from Novartis, Incyte, and Jazz Pharmaceuticals. C.K. received funding from AstraZeneca for this project. E.W. received funding from Pfizer for conducting the clinical trial. The remaining authors declare no competing financial interests.

B.O. and U.D. are retired from University Hospital Essen, Essen, Germany.

Figures

None
Graphical abstract
Figure 1.
Figure 1.
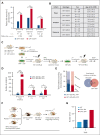
More genetic aberrations in human and murine GFI1-36N AML samples. (A) Percentage of patients with MDS/AML of 3 different cohorts with >2 chromosomal aberrations. Patient samples were genotyped for the presence of GFI1-36N or GFI1-36S with real time (RT)-PCR. (B) Number of patients in individual cohorts corelating to gender and age of the patients. (C) Schematic experimental setup to generate leukemic mice and the serial transplantation experiments. (D) Serial transplanted BM cells from leukemic MLL-AF9 mice and nonleukemic Lin cells were analyzed using RNA-seq followed by variant calling analysis. Shown is the number of variations in leukemic cells minus the number of variations in nonleukemic cells. n = 3; mean ± standard deviation. (E) Variations from (D) divided according to the functional class of mutation. Shown is the total number of mutations per genotype (left). The Venn diagram (right) represents the overlaps of missense mutations between GFI1-36S and GFI1-36N leukemic cells. (F) Scheme of the PiggyBac transposon-based mouse model. GFI1-36S or GFI1-36N mice were crossed with the PiggyBac transposon mice (Mx-Cre × Rosa26 × ATP2). Mice were injected with poly(I:C) to activate the transposon system. (G) The PiggyBac transposon-based mouse model was used to check the number of common insertion sites (CISs) of the transposon sequence. The number of CISs were calculated for each genotype. WT: n = 4, GFI1-36S (heterozygous [n = 6] and homozygous [n = 1]): n = 7, and GFI1-36N (heterozygous [n = 2] and homozygous [n = 7]): n = 9. ∗P < .05; ∗∗P < .01; ∗∗∗P < .001. M, men; W, women; WT, wild-type.
Figure 2.
Figure 2.
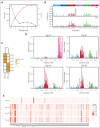
Somatic signatures in GFI1-36S and -36N leukemic mice and de novo identification of mutational signatures in human GFI1-36N–mutated samples. (A-C) RNA-seq data of BM cells from leukemic GFI1-36S (n = 3) and GFI1-36S (n = 3) mice were analyzed regarding their somatic signatures. (A) The optimal number of signatures is estimated based on silhouette coefficient (black) and L2 error (red). (B) SBS profiles considering the mutated base but also the bases immediately 5′ and 3′ for each signature and (C) signature activities for each sample. (D-E) Human GFI1-36S (n = 1348) and GFI1-36N (n = 182) samples were analyzed for their mutational signatures. (D) Mutational signatures identified in somatically enriched set of variants occurring in coding regions of clinical samples harboring GFI1-36N. (E) Cosine similarity of signatures Sign.01 to Sign.04 to the COSMIC single-base substitution reference set of mutational signatures version 3.3.
Figure 3.
Figure 3.
Higher DNA damage in GFI1-36N cells and lower DNA repair in GFI1-36N leukemic cells. (A) γH2AX-assay results of GFI1-36S and GFI1-36N thymocytes. γH2AX foci were stained with an antibody against γH2AX (immunofluorescence staining) and counted at different time points after 2 Gy irradiation. The images were analyzed with Imaris. Approximately 50-176 cells per sample; mean ± standard deviation (SD). P value was calculated over time. (B) Alkaline comet assay results of GFI1-36S and GFI1-36N thymocytes at different time points after irradiation with 5 Gy. Tail moment was analyzed from 34-65 cells per sample with the Comet-Assay Software from CaspLab. Mean ± SD. P value was calculated over time. (C) Murine nonleukemic progenitor cells (Lin cells) or (D) leukemic (MLL-AF9) BM cells from mice that received transplantation were irradiated with 3 Gy and were analyzed by flow cytometry at different time points after irradiation γH2AX level. n = 3; mean ± SD. (E) HR assay results from murine GFI1-36S- (n = 2) and GFI1-36N- (n = 2) Lin cells and murine GFI1-36S- (n = 2) and GFI1-36N- (n = 2) MLL-AF9 BM cells. The HR rate was measured with RT-PCR after the cells were transfected with 2 plasmids of the plasmid-based homologous recombination assay from Norgen Biotek Corp; mean ± SD (F) K562 cell lines expressing GFI1-36S or GFI1-36N were generated by CRISPR/Cas. The HR rate was measured as described in (E) 2 hours after irradiation with 3 Gy or 24 hours after treatment with 100 μg/mL temozolomide (TMZ). N = 3, mean ± SD (G) RAD51 foci formation in murine GFI1-36S and GFI1-36N leukemic (MLL-AF9) BM cells was analyzed at different time points after irradiation with 5 Gy. n = 3 (31-73 cells per sample), mean ± SD. ∗P > .05; ∗∗P < .01; ∗∗∗P < .001. (H) Cell-cycle analysis of GFI1-36S and GFI1-36N MLL-AF9 cells. GFI1-36S: n = 3 and GFI1-36N: n = 4; mean ± SD. ∗∗P < .01. No-Ir: no irradiation (0 Gy).
Figure 4.
Figure 4.
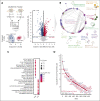
Proteome discovers GFI1-36N leukemic cells deregulate DNA repair protein MGMT. Proteomic analysis of primary murine and human GFI1-36S and GFI1-36N leukemic cells (A) Schematic representation of the experimental setup of murine GFI1-36S (n = 4) vs GFI1-36N (n = 4) leukemic BM cells proteome experiment, principle component analysis of measured samples, and evaluation of the results (left). Volcano plot displays significantly regulated proteins (permutation-based FDR < 0.05) is shown (right). (B) Network analysis of significantly regulated proteins between the 2 genotypes using Cytoscape. The network displays enriched Gene Ontology Biological Processes terms (P < .01). (C) Dot plot showing the significantly enriched GFI1-36N and GFI1-36S specific gene set enrichment terms based on proteomic analysis (D) Rank plot displaying the total number of DNA damage and repair proteins (highlighted with red dots) of all significantly regulated proteins in the data set. (E) Significantly regulated DNA damage and repair proteins grouped according to their specific pathways (selected from panel D). Rank plot displaying all significantly regulated proteins in GFI1 36N and 36S leukemia cells. The protein that participates in DNA damage repair are highlighted in red dots. The GFI1 36N upregulated proteins are marked in red, and downregulated proteins are marked in blue. The x-axis denotes the protein rank and y-axis denotes the –log10 P value. (F) Venn diagram showing the unique and shared number of differentially expressed proteins in murine and human AML samples (also see supplemental Figure 4H). MGMT is 1 of the shared and significantly altered proteins in both mouse and human samples. (G) Violin plot showing the log2 intensity of MGMT protein level in primary GFI1-36S (n = 4) vs GFI1-36N (n = 4) murine leukemic BM cells. (H) Violin plot showing the log2 intensity of MGMT protein level in human GFI1-36S (n = 11) vs GFI1-36N (n = 9) cells from patients with AML patient.
Figure 4.
Figure 4.
Proteome discovers GFI1-36N leukemic cells deregulate DNA repair protein MGMT. Proteomic analysis of primary murine and human GFI1-36S and GFI1-36N leukemic cells (A) Schematic representation of the experimental setup of murine GFI1-36S (n = 4) vs GFI1-36N (n = 4) leukemic BM cells proteome experiment, principle component analysis of measured samples, and evaluation of the results (left). Volcano plot displays significantly regulated proteins (permutation-based FDR < 0.05) is shown (right). (B) Network analysis of significantly regulated proteins between the 2 genotypes using Cytoscape. The network displays enriched Gene Ontology Biological Processes terms (P < .01). (C) Dot plot showing the significantly enriched GFI1-36N and GFI1-36S specific gene set enrichment terms based on proteomic analysis (D) Rank plot displaying the total number of DNA damage and repair proteins (highlighted with red dots) of all significantly regulated proteins in the data set. (E) Significantly regulated DNA damage and repair proteins grouped according to their specific pathways (selected from panel D). Rank plot displaying all significantly regulated proteins in GFI1 36N and 36S leukemia cells. The protein that participates in DNA damage repair are highlighted in red dots. The GFI1 36N upregulated proteins are marked in red, and downregulated proteins are marked in blue. The x-axis denotes the protein rank and y-axis denotes the –log10 P value. (F) Venn diagram showing the unique and shared number of differentially expressed proteins in murine and human AML samples (also see supplemental Figure 4H). MGMT is 1 of the shared and significantly altered proteins in both mouse and human samples. (G) Violin plot showing the log2 intensity of MGMT protein level in primary GFI1-36S (n = 4) vs GFI1-36N (n = 4) murine leukemic BM cells. (H) Violin plot showing the log2 intensity of MGMT protein level in human GFI1-36S (n = 11) vs GFI1-36N (n = 9) cells from patients with AML patient.
Figure 5.
Figure 5.
MGMT downregulation in GFI1-36N cells due to low levels of NDRG1. (A) Fold change expression of Mgmt in murine GFI1-36S- and GFI1-36N-MLL-AF9 leukemic BM cells at different time points after actinomycin D (10 μg/mL) treatment. Mgmt level was normalized to Hprt and to the untreated controls. n = 3; mean ± SD. (B) NDRG1 protein level in GFI1-36S- and GFI1-36N-MLL-AF9 leukemic BM cells (proteomic). n = 4; mean ± SD. (C) Ndrg1 expression (normalized read counts; RNA-seq) of murine leukemic GFI1-36S- and GFI1-36N-MLL-AF9 BM cells. n = 3; mean ± SD. (D) Ndrg1 gene expression measured in GFI1-36S- and GFI1-36N-MLL-AF9 BM cells by RT-PCR. GFI1-36S: n = 3 and GFI1-36N: n = 3; mean ± SD. (E) Published GFI1-ChIP-seq data sets showing the Ndrg1 gene and its regulatory elements with the possible binding sides of GFI1 (red square) at regulatory elements of Ndrg1. (F) GFI1-ChIP-quantitative PCR of the Ndrg1 upper regulatory elements of murine GFI1-36S and GFI1-36N leukemic BM cells. Gapdh and Runx1 were used as a control (right). (G) Comparison between the GFI1 binding motif from the Jasper database (top) and the consensus motif found using find individual motif occurrence (FIMO) at sites occupied by GFI1 in 21 genes differentially expressed in granulocyte/monocyte progenitors s from GFI1-36N or -36S animals. (H) Ndrg1 expression (RNA-seq) in murine leukemic GFI1-36S- and GFI1-36N-MLL-AF9 cells after treatment with 50 μg/mL TMZ for 20 hours and without. Normalized read counts of treated samples were normalized to the untreated samples. n = 3; mean ± SD. (I) NDRG1 protein level was analyzed by immunoblotting in BM cells from GFI1-36S and GFI1-36N leukemic mice without and with TMZ (50 μg/mL) treatment for 24 hours. ∗P < .05; ∗∗∗P < .001; ∗∗∗∗P < .0001.
Figure 6.
Figure 6.
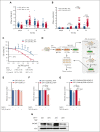
GFI1-36N leukemic cells are highly susceptible to TMZ treatment. (A) Functional Mgmt assays from murine GFI1-36S and GFI1-36N Lin cells (45-206 cells per sample) and (B) GFI1-36S and GFI1-36N MLL-AF9 BM cells from mice that received transplantation (115-223 cells per sample). Cells were treated with 100 μg/mL TMZ and at different time points after treatment O6MeG level was analyzed with immunofluorescence. The ACAS program was used for the evaluation. (C) Cell viability of murine GFI1-36S and GFI1-36N MLL-AF9 BM cells measured by MTT assay after treatment with different TMZ concentrations for 48 hours, and IC50 values were calculated; mean ± SD. (D) Schematic experimental setup of the colony-forming unit (CFU) assays. (E) Murine GFI1-36S and GFI1-36N Lin cells and (F) MLL-AF9 BM cells from mice were plated for 14 days in methylcellulose medium with the addition of 50 μg/mL TMZ or as a control dimethyl sulfoxide (DMSO). The colony number of the treated samples was calculated relative to the control. n = 3; mean ± SD. (G) CFU assay was performed with malignant BM cells from transgenic GFI1-36Sx and GFI1-36NxNUP98-HOXD13 mice. Cells were treated with 50 μg/mL TMZ and as a control with DMSO. The colony number after 14 days in culture of the treated samples was calculated relative to the control. n = 2, each triplicate, mean ± SD. (H) MGMT protein level was measured by immunoblotting in BM of GFI1-36S and GFI1-36N leukemic mice without and with TMZ (50 μg/mL) treatment for 24 hours. ∗P < .05; ∗∗P < .01; ∗∗∗P < .001; ∗∗∗∗P < .0001. AFU, arbitrary fluorescence units (O6MeG/4′,6-diamidino-2-phenylindole); IC50, 50% inhibitory concentration.
Figure 7.
Figure 7.
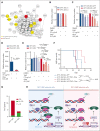
The combination of TMZ and olaparib shows synergistic effect on GFI1-36N leukemic cells in vitro and in vivo. (A) Analysis of possible drug targets of the differently expressed DNA repair–related proteins (results from the proteomic analysis of GFI1-36S and GFI1-36N leukemic BM cells). (B) CFU assay results of murine Lin cells after treatment with either the combination of 10 μg/mL TMZ and 0.2 μM olaparib (Olap) or DMSO as a control. n = 3, mean ± SD (C) CFU assay results from MLL-AF9 BM cells from mice that received transplantation after treatment with either 10 μg/mL TMZ (n = 2), 0.2 μM Olap (n = 2), or the combination of both (n = 3, triplicate) and as a control DMSO (n = 3). Colony number was determined, and treated samples were calculated relative to the control. mean ± SD (D) CFU assay results from K562 cells expressing GFI1-36S and GFI1-36N, treated with 10 μg/mL TMZ and 0.2 μM Olap. Relative colony numbers were calculated with respect to DMSO control (n = 3, triplicate). (E) Primary human GFI1-36S (GFI1-36S/S: 2 × BM and 2 × peripheral blood) and GFI1-36N (GFI1-36S/N: 1 × BM and 1 × SPL and GFI1-36N/N: 2 × peripheral blood) cells from patients with AML were plated 14 days in methylcellulose media and treated as described in (B). Number of live cells was determined, and treated samples were calculated relative to the control. n = 4; mean ± SD. (F) AML-free survival of mice that received transplantatiob with TMZ and Olap treatment or without. GFI1-36S or GFI1-36N MLL-AF9 BM cells were transplanted into sublethally irradiated WT mice and on day 3 after transplantation, the treatment with 100 mg/kg olaparib and 50 mg/kg TMZ was started. n = 6. (G) In an ongoing clinical trial (NCT04207190) of treating patients with AML with talazoparib along with gemtuzumab ozogamicin, 3 out of 4 GFI1-36N patients showed CRi, whereas 1 out of 12 GFI1-36S patients showed CRi. (H) Scheme elucidates GFI1-36N influence on DNA repair and genome stability in AML cells compared with GFI1-36S. ∗P < .05; ∗∗P < .01; ∗∗∗P < .001. FDA, Food and Drug Administration; SPL, spleen. Scheme created with BioRender.com.

References

    1. Hock H, Hamblen MJ, Rooke HM, et al. Gfi-1 restricts proliferation and preserves functional integrity of haematopoietic stem cells. Nature. 2004;431(7011):1002–1007. - PubMed
    1. Karsunky H, Zeng H, Schmidt T, et al. Inflammatory reactions and severe neutropenia in mice lacking the transcriptional repressor Gfi1. Nat Genet. 2002;30(3):295–300. - PubMed
    1. Thambyrajah R, Mazan M, Patel R, et al. GFI1 proteins orchestrate the emergence of haematopoietic stem cells through recruitment of LSD1. Nat Cell Biol. 2016;18(1):21–32. - PubMed
    1. Yucel R, Kosan C, Heyd F, Moroy T. Gfi1:green fluorescent protein knock-in mutant reveals differential expression and autoregulation of the growth factor independence 1 (Gfi1) gene during lymphocyte development. J Biol Chem. 2004;279(39):40906–40917. - PubMed
    1. Zeng H, Yücel R, Kosan C, Klein-Hitpass L, Möröy T. Transcription factor Gfi1 regulates self-renewal and engraftment of hematopoietic stem cells. EMBO J. 2004;23(20):4116–4125. - PMC - PubMed

Publication types