. 2023 Oct 31;137(20):1563-1575.
doi: 10.1042/CS20230779.

A normative microbiome is not restored following kidney transplantation

Affiliations

A normative microbiome is not restored following kidney transplantation

Hannah Craven et al. Clin Sci (Lond). .

Abstract

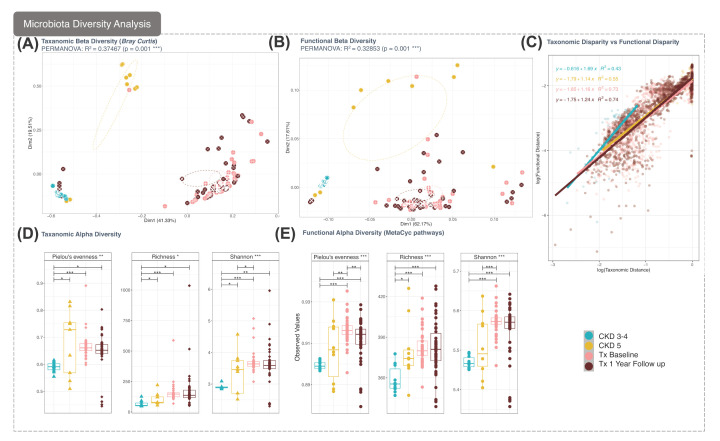
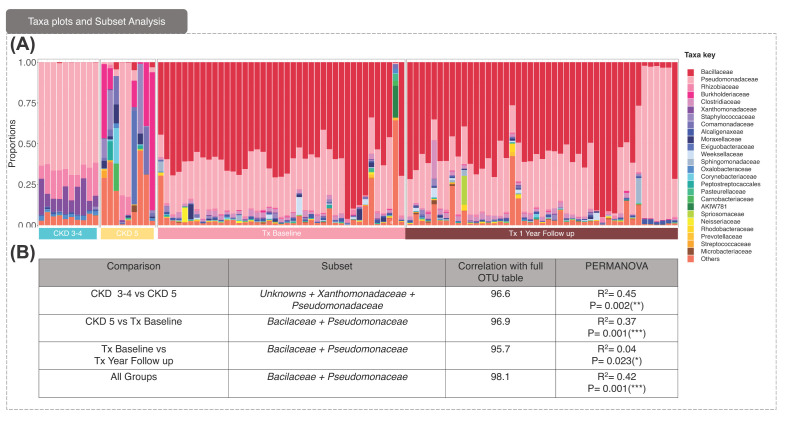
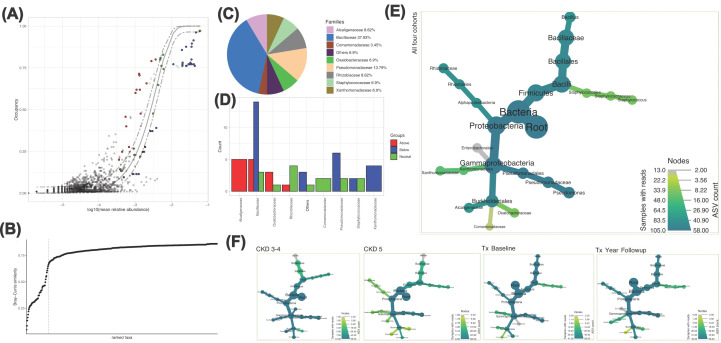
Dialysis and kidney transplantation (Ktx) mitigate some of the physiological deficits in chronic kidney disease (CKD), but it remains to be determined if these mitigate microbial dysbiosis and the production of inflammatory microbial metabolites, which contribute significantly to the uraemic phenotype. We have investigated bacterial DNA signatures present in the circulation of CKD patients and those receiving a KTx. Our data are consistent with increasing dysbiosis as CKD progresses, with an accompanying increase in trimethylamine (TMA) producing pathobionts Pseudomonas and Bacillus. Notably, KTx patients displayed a significantly different microbiota compared with CKD5 patients, which surprisingly included further increase in TMA producing Bacillus and loss of salutogenic Lactobacilli. Only two genera (Viellonella and Saccharimonidales) showed significant differences in abundance following KTx that may reflect a reciprocal relationship between TMA producers and utilisers, which supersedes restoration of a normative microbiome. Our metadata analysis confirmed that TMA N-oxide (TMAO) along with one carbon metabolism had significant impact upon both inflammatory burden and the composition of the microbiome. This indicates that these metabolites are key to shaping the uraemic microbiome and might be exploited in the development of dietary intervention strategies to both mitigate the physiological deficits in CKD and enable the restoration of a more salutogenic microbiome.

Keywords: chronic kidney disease; kidney transplantation; microbiome.


Conflict of interest statement

The authors declare that there are no competing interests associated with the manuscript.

Figures

Figure 1
Figure 1. Microbial Diversity in terms of taxonomy and function
(A) Beta diversity using Bray–Curtis distance measure and (B) hierarchical meta-storms (a hierarchical measure of functional beta diversity that takes into account redundancies in KEGG orthologies (KOs)and resolves beta diversity by collating abundances of KOs in a weighted fashion in terms of the pathways they belong to). PERMANOVA results for CKD groups (3–4 and 5) and transplant groups (Baseline and 1 year follow-up). For (a) and (b), the ellipses represent 95% confidence intervals of standard errors of each group. (C) A Linear regression model fitted to Log abundance of both paired wise distances (Bray-Curtis distances in x-axis and hierarchical meta-storm distances in y-axis). The slope of the fitted lines then reveals how functionally robust the communities are in terms of taxonomic perturbations. (D,E) Taxanomic and functional alpha diversity (Peilou’s evenness, Richness and Shannon entropy) for each group whereby lines connect two categories if the differences are significant (ANOVA) with *(P<0.05), **(P<0.01) or *** (P<0.001). Only samples with 5000 reads per sample have been included in these analyses.
Figure 2
Figure 2. Taxa plots and subset analysis
(A) Taxa plots representing the Top-25 most abundant families observed in all samples in the corresponding groups with the taxa key shown. (B) Subset analysis that implodes the abundance table down to a minimal subset of species that roughly explain the same beta diversity between samples as the full abundance table. The correlation value cut-off 0.95 was chosen and based on these subsets, the PERMANOVA values (R2 values explaining percentage variability between the groups) suggest them to be discriminatory.
Figure 3
Figure 3. Core Microbiota
(A) Core microbiome (red, green and blue points) identified through species occupancy abundance diagrams incorporating Site-Specific Occupancy (accounting for differences between CKD 3-4, CKD 5, KTx baseline, and KTx one year follow-up). (B) To identify the thresholds for core microbiome, we calculate the function C (that implicitly incorporates explanatory power of the chosen core subset in terms of capturing beta diversity). The dotted line represents ‘Last 2% decrease’ criteria where ASVs are incorporated in the core subset until there is no more than 2% decrease in beta diversity. (C) shows piechart of these ASVs resolved at Family level. Independently, a neutral model is fitted with those ASVs that fall within the 95% interval confidence intervals shown in green in (A), whilst non-neutral OTUs with observed frequency above the predicted frequency from the neutral model (selected by the host) are shown in red colours, and those with observed frequency below the predicted frequency from the neutral model (selected by dispersal limitation) are shown in green colours. (D) Then summarizes these OTUs at family level by giving their count. (E) Then shows the complete taxonomic coverage of these ASVs by collating abundances from all four cohorts together whilst (F) shows them separately for each cohort.
Figure 4
Figure 4. Differential Taxa analysis
Genera found to be discriminately expressed based on differential taxa analyses showing which genera are up-/down-regulated between CKD 3-4 and CKD 5 (A), CKD 5 and KTx Baseline (B), and KTx baseline and KTx one year follow up (C), where they had at least a 2 log2 fold change from the mean abundance (Adj P-value ≤ 0.05). Left axis shows the range of Log2 fold change values whilst the right axis shows the mean abundance. In this manner, we can see whether the changes happen in low abundant or high abundant taxa.
Figure 5
Figure 5. Correlation Analysis of Continuous variables within the Metadata
(A) Kendall rank correlation analysis of metadata against elements of one-carbon metabolism, TMAO, Choline, Betaine. (B) Kendall Rank correlation analysis of the metadata against the 25 most abundant genera and ASVs. Note that metadata was only available for the baseline group of the KTx cohort, and so encompasses the CKD 5, CKD 3-4, and KTx baseline groups only. Bonferroni correction was used to adjust for multiple comparisons. P values <0.001 is denoted with (***), <0.01 with (**), <0.05 with (*) <0.1 with (.)

Similar articles

Cited by

References

    1. Ebert T., Pawelzik S.C., Witasp A., Arefin S., Hobson S., Kublickiene K.et al. . (2020) Inflammation and premature ageing in chronic kidney disease. Toxins 12, 227 10.3390/toxins12040227 - DOI - PMC - PubMed
    1. Rysz J., Franczyk B., Ławiński J., Olszewski R., Ciałkowska-Rysz A. and Gluba-Brzózka A. (2021) The impact of CKD on uremic toxins and gut microbiota. Toxins 13, 252 10.3390/toxins13040252 - DOI - PMC - PubMed
    1. Gątarek P. and Kałużna-Czaplińska J. (2021) Trimethylamine N-oxide (TMAO) in human health. EXCLI J. 20, 301–319 - PMC - PubMed
    1. Senger D.R., Li D., Jaminet S.C. and Cao S. (2016) Activation of the Nrf2 cell defense pathway by ancient foods: disease prevention by important molecules and microbes lost from the modern Western Diet. PloS ONE 11, e0148042 10.1371/journal.pone.0148042 - DOI - PMC - PubMed
    1. Craven H., McGuinness D., Buchanan S., Galbraith N., McGuinness D.H., Jones B.et al. . (2021) Socioeconomic position links circulatory microbiota differences with biological age. Sci. Rep. 11, 12629 10.1038/s41598-021-92042-0 - DOI - PMC - PubMed

Publication types

MeSH terms