. 2023 Dec 12;13(12):2610-2631.
doi: 10.1158/2159-8290.CD-23-0299.

Spatial and Temporal Mapping of Breast Cancer Lung Metastases Identify TREM2 Macrophages as Regulators of the Metastatic Boundary

Affiliations

Spatial and Temporal Mapping of Breast Cancer Lung Metastases Identify TREM2 Macrophages as Regulators of the Metastatic Boundary

Ido Yofe et al. Cancer Discov. .

Abstract

Cancer mortality primarily stems from metastatic recurrence, emphasizing the urgent need for developing effective metastasis-targeted immunotherapies. To better understand the cellular and molecular events shaping metastatic niches, we used a spontaneous breast cancer lung metastasis model to create a single-cell atlas spanning different metastatic stages and regions. We found that premetastatic lungs are infiltrated by inflammatory neutrophils and monocytes, followed by the accumulation of suppressive macrophages with the emergence of metastases. Spatial profiling revealed that metastasis-associated immune cells were present in the metastasis core, with the exception of TREM2+ regulatory macrophages uniquely enriched at the metastatic invasive margin, consistent across both murine models and human patient samples. These regulatory macrophages (Mreg) contribute to the formation of an immune-suppressive niche, cloaking tumor cells from immune surveillance. Our study provides a compendium of immune cell dynamics across metastatic stages and niches, informing the development of metastasis-targeting immunotherapies.

Significance: Temporal and spatial single-cell analysis of metastasis stages revealed new players in modulating immune surveillance and suppression. Our study highlights distinct populations of TREM2 macrophages as modulators of the microenvironment in metastasis, and as the key immune determinant defining metastatic niches, pointing to myeloid checkpoints to improve therapeutic strategies. This article is featured in Selected Articles from This Issue, p. 2489.


Figures

Figure 1
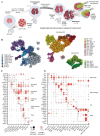
Figure 1. Detailed atlas of the immune microenvironment in breast cancer lung metastasis.
A, Experimental design of the spontaneous metastasis model conducted in photoactivatable-GFP mice. B, Two-dimensional projection of the transcriptomic profiles of cells from three immune subsets: T and NK; monocyte, macrophage, and DC; and neutrophils. Dots represent single cells and are color-coded according to subpopulation annotation, larger circles represent metacells. See Methods. C, Bubble heat map showing marker gene expression across T and NK cell types from B. Size indicates the fraction of expressing cells. Color indicates the mean log-normalized expression levels. D, As in C but for myeloid populations.
Figure 2
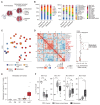
Figure 2. Lung metastases and primary tumors exhibit divergent immune landscapes.
A, Scheme illustrating the comparison of primary breast tumors and lung metastases. B, The cumulative cell fraction of the different main immune lineages (left) and subtypes (right) in primary tumors (n = 4 samples) and metastasis core (n = 13). C, Fractions of cells belonging to different immune lineages (from total) or subtypes (from their respective lineage), averaged over primary tumor (x-axis) or metastasis core (y-axis) samples. Size indicates the average of x and y. Color depicts P value of the two-sided T test between x and y, accounting for sample variation. D, PCA of immune compartment makeup, based on cell type and subpopulation fractions. E, Fractions of indicated cell types out of total CD45+ cells. F, Fractions of indicated T-cell subtypes from total T cells. G, The log2 ratio of activated T cells (Cd8 Gzma and Cd8 Gzmk) and naïve T cells (Cd8 Dapl1 and Cd4 Lef1). H, Fractions of the indicated monocyte subtypes from total monocytes. I, Comparison of monocyte subtypes gene expression (log2 normalized). J, Fractions of the indicated macrophage subtypes from the total macrophage. K, Comparison of macrophage subtypes gene expression (log2 normalized). L, Enriched gene ontology terms in macrophage subtypes. Two-tailed Student t test was used. In box plots, the center line represents the median, the box limits denote the 25th to the 75th percentiles, and the whiskers represent the minimum and maximum values. Differentially expressed genes (DEG) are colored in red and leading DEGs are labeled. Normalized gene ontology term enrichment score (NES) is shown on the x-axis. For all terms, Padj < 0.05.
Figure 3
Figure 3. The premetastatic lung microenvironment is characterized by the activation of monocytes and neutrophils.
A, Scheme illustrating the comparison of control and premetastatic lung tissues. B, The cumulative fraction of the different main immune lineages (left) and subtypes (right) in control (n = 3 samples) and premetastatic (Pre-MET, n = 3) samples. C, Fractions of indicated cell types out of total CD45+ cells. D, Fractions of indicated T-cell subtypes from total T cells. E, The log2 ratio of activated T cells (Cd8 Gzma and Cd8 Gzmk) and naïve T cells (Cd8 Dapl1 and Cd4 Lef1). F, Fractions of the indicated monocyte subtypes from total monocytes. G, Comparison of monocyte subtypes gene expression (log2 normalized). H, Enriched gene ontology terms in monocyte subtypes. I, Fractions of the indicated neutrophil subtypes from total monocytes (ns. = non significant). J, Comparison of neutrophil subtypes gene expression (log2 normalized). K, Enriched gene ontology terms in neutrophil subtypes. L, CellChat analysis (see Methods) of differential interaction strength between cell types in Pre-MET and control lungs based on ligand–receptor gene expression (top), and of upregulated ligand–receptor interactions in Pre-MET cells (bottom). Up depicts higher in Pre-MET. M, Scheme illustrating ex vivo cell migration assay. Cells were purified from the bone marrow of normal mice. The lung noncellular fraction was produced from the lungs of control or Pre-MET mice, and the migration of monocytes and granulocytes toward lung-secreted factors was analyzed. N, Quantification of migrated Ly6c+ monocytes and Ly6g+ granulocytes toward supernatant from normal or pre-MET lung-secreted factors, with or without anti-CCL6 antibody (presented as fold change from the normal mean; error bars, SE). Two-tailed Student t test was used. In box plots, the center line represents the median, the box limits denote the 25th to the 75th percentiles, and the whiskers represent the minimum and maximum values. Differentially expressed genes (DEG) are colored in red and leading DEGs are labeled. Normalized gene ontology term enrichment score (NES) is shown on the x-axis. For all terms, Padj < 0.05.
Figure 4
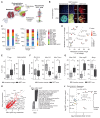
Figure 4. Progression to lung metastasis is associated with infiltration by unconventional immune cell subtypes.
A, Scheme illustrating the comparison of control, relapse-free, distal normal, and metastasis lung tissues. B, The cumulative fraction of the different main immune cell lineages (left) and subtypes (right) per tissue type (control, n = 3 samples; relapse free, n = 6; distal normal, n = 14; metastasis, n = 13). C, PCA of immune compartment makeup, based on cell type and subtype fractions. D, Cellular module analysis. Pairwise Spearman correlation of cell type and subpopulation fraction across samples of distal normal and metastasis (left; color gradient represents Spearman correlation). Consensus hierarchical clustering into four cell modules. Enrichment of each cell type between distal normal and metastasis tissues (right). Size indicates the mean percentage of cells in all samples; color gradient represents the P value of Student t test between metastasis and distal normal per cell population. E, Quantification of cell fractions from total cells per sample in the metastasis cell module analysis in D. CTL, control; PM, premetastasis; RF, relapse free; DN, distal normal; MET, metastasis. F, Fractions of the indicated monocyte subtypes from total monocytes. G, Fractions of the indicated macrophage subtypes from total macrophages. H, Scheme illustrating ex vivo cell migration assay. Cells were purified from the bone marrow of normal mice. The lung noncellular fraction was produced from the distal normal area or metastatic area of metastases-bearing lungs. Migration of monocytes and granulocytes toward lung-secreted factors was analyzed. I, Quantification of migrated Ly6c+ monocytes and Ly6g+ granulocytes toward supernatant from the distal normal area or metastatic area of metastases-bearing lungs (presented as log2 fold change from the distal normal mean; error bars, SE. Two-tailed paired Student t test was used). J, Scheme and quantification of macrophage-induced T-cell suppression assay. Splenic T cells from normal mice were stimulated and stained with cell proliferation dye and then cocultured for 48 hours with macrophages isolated from the lungs of control, premetastatic (Pre-MET), or metastasis-bearing mice. Error bars, SE. Two-tailed Student t test was used. In box plots, the center line represents the median, the box limits denote the 25th to the 75th percentiles, and the whiskers represent the minimum and maximum values.
Figure 5
Figure 5. The metastatic invasive margin is populated by suppressive TREM2 macrophages.
A, Scheme illustrating labeling of cells in metastasis invasive margins and metastatic cores, using PA-GFP. B, Representative fluorescent imaging of lung tissue samples pre- and postphotoactivation of a random region in a control sample, and the metastasis invasive margin or core in metastasis-bearing mice. C, The cumulative fraction of the different main immune cell lineages (left) and subtypes (right). D, Fractions of immune cell lineages (from total) or subtypes (from their respective lineage), averaged over invasive margin (x-axis) or metastasis core (y-axis) samples. Size indicates the average of x and y. Color gradient depicts P value of the two-sided t test between x and y, accounting for sample variation. E, Fractions of Tregs and PMN-MDSCs from their respective lineages. F, Fractions of the indicated monocyte subtypes from total monocytes. G, Fractions of the indicated macrophage subtypes from total macrophages. H, Comparison of macrophage subtypes gene expression (log2 normalized). Differentially expressed genes (DEG) are colored in red and leading DEGs are labeled. I, Enriched gene ontology terms in macrophage subtypes. Normalized gene ontology term enrichment score (NES) is shown on the x-axis. For all terms, Padj < 0.05. J, Cell subtype enrichment in metastasis over distal normal tissues (x-axis), compared with metastasis core over invasive margin (y-axis). K, CD9 and IL7R flow cytometry protein expression values (index sorting) of cells that were annotated as Mreg or Mac Isg20 by following scRNA-seq. L, Activated T cells (or not activated control) were cocultured with the lung-derived macrophage populations (CD45+ CD11b+ Ly6g, and the indicated gate). Quantification of activated CD8 T cells (CD25+ CD69+, left), and IFNγ secreted in supernatant (right). M, Representative immuno-fluorescence imaging of EO771 breast cancer lung metastasis, stained for GPNMB (Cyan). Tumor cells shown in red (tdTomato), nuclei shown in blue (DAPI). N, Quantification of the percentage of GPNMB+ cells at the metastasis core and invasive margin, at different distances from metastases’ boundary. Two-tailed paired t test was used. In boxplots, the center line represents the median, the box limits denote the 25th to the 75th percentiles, and the whiskers represent the minimum and maximum values.
Figure 6
Figure 6. Mregs accumulate at the invasive margin of human lung metastases.
A, H&E and immunofluorescent images of patient lung metastasis sections. Each patient’s primary tumor diagnosis is indicated on the left. FFPE sections were stained using DAPI and rabbit anti-TREM2 (clone D8I4C, Cell Signaling Technology; #91068). Image acquisition was performed using a Leica DMi8 widefield microscope with a 20× objective (Leica Microsystems).

References

    1. Allahverdiyev A, Tari G, Bagirova M, Abamor ES. Current approaches in development of immunotherapeutic vaccines for breast cancer. J Breast Cancer. 2018;21:343–53. doi: 10.4048/jbc.2018.21.e47. - DOI - PMC - PubMed
    1. Tong CWS, Wu M, Cho WCS, To KKW. Recent advances in the treatment of breast cancer. Front Oncol. 2018;8:227. doi: 10.3389/fonc.2018.00227. - DOI - PMC - PubMed
    1. Jin L, Han B, Siegel E, Cui Y, Giuliano A, Cui X. Breast cancer lung metastasis: molecular biology and therapeutic implications. Cancer Biol Ther. 2018;19:858–68. doi: 10.1080/15384047.2018.1456599. - DOI - PMC - PubMed
    1. Welch DR, Hurst DR. Defining the hallmarks of metastasis. Cancer Res. 2019;79:3011–27. doi: 10.1158/0008-5472.CAN-19-0458. - DOI - PMC - PubMed
    1. Garner H, de Visser KE. Immune crosstalk in cancer progression and metastatic spread: a complex conversation. Nat Rev Immunol. 2020;20:483–97. - PubMed

Publication types