. 2023 Dec 1;29(23):4883-4893.
doi: 10.1158/1078-0432.CCR-23-1928.

Upregulation of Indoleamine 2,3-Dioxygenase 1 in Tumor Cells and Tertiary Lymphoid Structures is a Hallmark of Inflamed Non-Small Cell Lung Cancer

Affiliations

Upregulation of Indoleamine 2,3-Dioxygenase 1 in Tumor Cells and Tertiary Lymphoid Structures is a Hallmark of Inflamed Non-Small Cell Lung Cancer

Alban Bessede et al. Clin Cancer Res. .

Abstract

Purpose: Overexpression of the tryptophan-catabolizing enzyme indoleamine 2,3-dioxygenase 1 (IDO1) has been reported in several tumor types, including non-small cell lung cancer (NSCLC), and has been shown to promote tumor-immune evasion and inhibit T-cell activation through increased tryptophan degradation and the production of several immunosuppressive metabolites collectively known as kynurenines. However, it remains unclear whether IDO1 expression by tumor cells is detrimental specifically in the context of programmed cell death protein 1 (PD-1)/programmed death ligand 1 (PD-L1) axis blockade.

Experimental design: We analyzed the transcriptome of 891 NSCLC tumor samples from patients enrolled in two large randomized clinical trials investigating the safety and activity of atezolizumab, a humanized IgG1 mAb that targets PD-L1, versus docetaxel in patients with advanced NSCLC. We complemented these transcriptomics results at the protein level by using multiplex immunofluorescence and at the functional level with in vitro experiments.

Results: The increased expression of the tryptophan-catabolizing enzyme IDO1 was significantly associated with improved objective response, progression-free survival, and overall survival in patients treated with PD-L1 inhibitors, but not in those treated with chemotherapy. Strikingly, inflamed tumors had higher levels of IDO1, and IDO1 was also expressed in tertiary lymphoid structures (TLS) by mature follicular dendritic cells. L-kynurenine impaired the differentiation of antibody-producing B cells induced by follicular helper T (Tfh)/B-cell interactions, a hallmark process within TLS.

Conclusions: IDO1 pathway in NSCLC is driven by the immune system rather than by tumor cells. Targeting IDO1 in combination with anti-PD-1/PD-L1 might be beneficial only in patients with inflamed tumors and particularly in those bearing TLS.


Figures

Figure 1. High IDO1 expression is associated with a favorable response to ICI. A–E, Patients from the POPLAR and OAK trials were classified as high or low based on their baseline level of IDO1 gene expression as assessed by RNA-seq. Kaplan‒Meier curves of the progression-free survival (A–D) and overall survival (B–E) of patients treated with atezolizumab (A and B) or docetaxel (D and E). C–F, Proportion of patients treated with atezolizumab (C) or docetaxel (F) with high and low expression of IDO1 who responded to treatment (NR, nonresponders; R, responders). The P values were calculated using a χ² test.
Figure 1.
High IDO1 expression is associated with a favorable response to ICI. A–E, Patients from the POPLAR and OAK trials were classified as high or low based on their baseline level of IDO1 gene expression as assessed by RNA-seq. Kaplan‒Meier curves of the progression-free survival (A–D) and overall survival (B–E) of patients treated with atezolizumab (A and B) or docetaxel (D and E). C–F, Proportion of patients treated with atezolizumab (C) or docetaxel (F) with high and low expression of IDO1 who responded to treatment (NR, nonresponders; R, responders). The P values were calculated using a χ² test.
Figure 2. High IDO1 expression is associated with the inflammatory response. A, Atezolizumab-treated patients from the POPLAR and OAK trials were classified as IDO1-high or IDO1-low based on their baseline level of IDO1 gene expression and PDL1-high (≥1%) or PDL1-low (<1%) based on their PD-L1 22C3 assay status. The P value was calculated using a χ² test. B, Histogram of IDO1 gene expression levels (normalized counts) according to the PDL1 22C3 assay. The P values were calculated using the Wilcoxon test. C, Volcano plot showing the differentially expressed gene between IDO1-high and IDO1-low patients. D, Gene ontology analysis of the differentially expressed genes between IDO1-high and IDO1-low patients. NES, normalized enrichment score. E, Assessment of the immune microenvironment of patients with high and low IDO1 gene expression by data deconvolution using Bindea et al. gene sets. Bubble plot of the genes upregulated (red dots) and downregulated (blue dots) in patients with high IDO1 expression. The P values were calculated using the Wilcoxon test.
Figure 2.
High IDO1 expression is associated with the inflammatory response. A, Atezolizumab-treated patients from the POPLAR and OAK trials were classified as IDO1-high or IDO1-low based on their baseline level of IDO1 gene expression and PDL1-high (≥1%) or PDL1-low (<1%) based on their PD-L1 22C3 assay status. The P value was calculated using a χ² test. B, Histogram of IDO1 gene expression levels (normalized counts) according to the PDL1 22C3 assay. The P values were calculated using the Wilcoxon test. C, Volcano plot showing the differentially expressed gene between IDO1-high and IDO1-low patients. D, Gene ontology analysis of the differentially expressed genes between IDO1-high and IDO1-low patients. NES, normalized enrichment score. E, Assessment of the immune microenvironment of patients with high and low IDO1 gene expression by data deconvolution using Bindea et al. gene sets. Bubble plot of the genes upregulated (red dots) and downregulated (blue dots) in patients with high IDO1 expression. The P values were calculated using the Wilcoxon test.
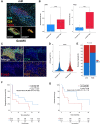
Figure 3. Tumor expression of IDO1 is associated with increased CD8+ T-cell infiltration. A, Proportion of patients with high and low percentages of PanCK+/IDO1+ cells according to progression-free survival. The P value was calculated using a χ² test. B, Kaplan‒Meier curves of the progression-free survival of patients classified as high or low based on levels of PanCK+/IDO1+ cells. C, CD8+ T-cell infiltration in patients with high and low expression of IDO1 in PanCK+ cells. D, Histograms of the percentage of activated CD8+/PD-1+ cells in the stroma and tumor areas of patients with high and low PanCK+/IDO1+ cell levels. The P values were calculated using Wilcoxon tests. E, Nearest distances between PanCK+ and CD8+ cells in patients with high and low levels of PanCK+/IDO1+ cells. The minimum intercellular distance is shown by a white dashed segment. F, Histogram of the median distance between PanCK+ and CD8+ cells in patients with high and low levels of PanCK+/IDO1+ cells. The P value was calculated using Wilcoxon tests.
Figure 3.
Tumor expression of IDO1 is associated with increased CD8+ T-cell infiltration. A, Proportion of patients with high and low percentages of PanCK+/IDO1+ cells according to progression-free survival. The P value was calculated using a χ² test. B, Kaplan‒Meier curves of the progression-free survival of patients classified as high or low based on levels of PanCK+/IDO1+ cells. C, CD8+ T-cell infiltration in patients with high and low expression of IDO1 in PanCK+ cells. D, Histograms of the percentage of activated CD8+/PD-1+ cells in the stroma and tumor areas of patients with high and low PanCK+/IDO1+ cell levels. The P values were calculated using Wilcoxon tests. E, Nearest distances between PanCK+ and CD8+ cells in patients with high and low levels of PanCK+/IDO1+ cells. The minimum intercellular distance is shown by a white dashed segment. F, Histogram of the median distance between PanCK+ and CD8+ cells in patients with high and low levels of PanCK+/IDO1+ cells. The P value was calculated using Wilcoxon tests.
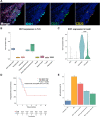
Figure 4. IDO1 is expressed on CD21+/CD23+ FDC within TLS and restricts B-cell activation. A, Representative image from the CD11c/CD14/CD3/CD20/CD21/CD23/IDO1/Mum1/DAPI multiplex immunofluorescence panel focused on a TLS from an NSCLC adenocarcinoma section. B, IDO1 expression in the different cell subsets identified within TLS (n = 6 patients). C, scRNAseq analysis of IDO1 expression in different tonsillar stromal cell subsets (GSE173539). D, Kaplan‒Meier curves of the progression-free survival of TLS+ patients classified as TLS IDO-positive or TLS IDO-negative (positive = at least one TLS with 10% IDO1+ cells). E, Level of IgG secretion by B-cell and Tfh cell cocultures activated with SEB (1 ng/mL) for 7 days or not treated; the doses of kynurenine are indicated (n = 2 different donors).
Figure 4.
IDO1 is expressed on CD21+/CD23+ FDC within TLS and restricts B-cell activation. A, Representative image from the CD11c/CD14/CD3/CD20/CD21/CD23/IDO1/Mum1/DAPI multiplex immunofluorescence panel focused on a TLS from an NSCLC adenocarcinoma section. B, IDO1 expression in the different cell subsets identified within TLS (n = 6 patients). C, scRNAseq analysis of IDO1 expression in different tonsillar stromal cell subsets (GSE173539). D, Kaplan‒Meier curves of the progression-free survival of TLS+ patients classified as TLS IDO-positive or TLS IDO-negative (positive = at least one TLS with 10% IDO1+ cells). E, Level of IgG secretion by B-cell and Tfh cell cocultures activated with SEB (1 ng/mL) for 7 days or not treated; the doses of kynurenine are indicated (n = 2 different donors).
Figure 5. IDO1 expression in TLS correlates with increased Treg levels and poor prognosis. A, Representative illustration of a GeoMx DSP-analyzed TLS. CD4/CD8/CD20 multiplex IF staining (top) and CD20 segmentation masks (bottom) for GeoMx transcriptomics analysis. B, Estimation of the percentage of pDC (left) and Tregs (right) in the CD20 areas of TLS expressing high or low levels of IDO1 by SpatialDecon analysis of GeoMx data. C, Representative image from the CD4/CD8/CD20/Ki67/Foxp3/DAPI multiplex immunofluorescence panel focused on a TLS from an NSCLC adenocarcinoma section. D, Proportion of proliferating Tregs (CD4+/Foxp3+/Ki67+) in TLS according to IDO1 expression. The analyzed TLS (n = 528) were classified as high or low based on the median IDO1 expression level inside TLS. The P value was calculated using a Wilcoxon test. E, Proportion of patients with high and low levels of proliferating Tregs in TLS according to their response to ICI. The P value was calculated using a χ² test. F and G, Kaplan‒Meier curves of the progression-free survival (C) and overall survival of patients classified as high and low according to the levels of proliferating Tregs (CD4+/Foxp3+/Ki67+) in TLS.
Figure 5.
IDO1 expression in TLS correlates with increased Treg levels and poor prognosis. A, Representative illustration of a GeoMx DSP-analyzed TLS. CD4/CD8/CD20 multiplex IF staining (top) and CD20 segmentation masks (bottom) for GeoMx transcriptomics analysis. B, Estimation of the percentage of pDC (left) and Tregs (right) in the CD20 areas of TLS expressing high or low levels of IDO1 by SpatialDecon analysis of GeoMx data. C, Representative image from the CD4/CD8/CD20/Ki67/Foxp3/DAPI multiplex immunofluorescence panel focused on a TLS from an NSCLC adenocarcinoma section. D, Proportion of proliferating Tregs (CD4+/Foxp3+/Ki67+) in TLS according to IDO1 expression. The analyzed TLS (n = 528) were classified as high or low based on the median IDO1 expression level inside TLS. The P value was calculated using a Wilcoxon test. E, Proportion of patients with high and low levels of proliferating Tregs in TLS according to their response to ICI. The P value was calculated using a χ² test. F and G, Kaplan‒Meier curves of the progression-free survival (C) and overall survival of patients classified as high and low according to the levels of proliferating Tregs (CD4+/Foxp3+/Ki67+) in TLS.

References

    1. Herbst RS, Giaccone G, de Marinis F, Reinmuth N, Vergnenegre A, Barrios CH, et al. . Atezolizumab for first-line treatment of PD-L1-selected patients with NSCLC. N Engl J Med 2020;383:1328–39. - PubMed
    1. Rittmeyer A, Barlesi F, Waterkamp D, Park K, Ciardiello F, von Pawel J, et al. . Atezolizumab versus docetaxel in patients with previously treated non-small-cell lung cancer (OAK): a phase 3, open-label, multicentre randomised controlled trial. Lancet 2017;389:255–65. - PMC - PubMed
    1. Camidge DR, Doebele RC, Kerr KM. Comparing and contrasting predictive biomarkers for immunotherapy and targeted therapy of NSCLC. Nat Rev Clin Oncol 2019;16:341–55. - PubMed
    1. Mellor AL, Munn DH. IDO expression by dendritic cells: tolerance and tryptophan catabolism. Nat Rev Immunol 2004;4:762–74. - PubMed
    1. Holmgaard RB, Zamarin D, Munn DH, Wolchok JD, Allison JP. Indoleamine 2,3-dioxygenase is a critical resistance mechanism in antitumor T cell immunotherapy targeting CTLA-4. J Exp Med 2013;210:1389–402. - PMC - PubMed

Publication types

MeSH terms