. 2023 Oct 15;136(20):jcs261547.
doi: 10.1242/jcs.261547. Epub 2023 Oct 27.

Transcription inhibition suppresses nuclear blebbing and rupture independently of nuclear rigidity

Affiliations

Transcription inhibition suppresses nuclear blebbing and rupture independently of nuclear rigidity

Isabel K Berg et al. J Cell Sci. .

Abstract

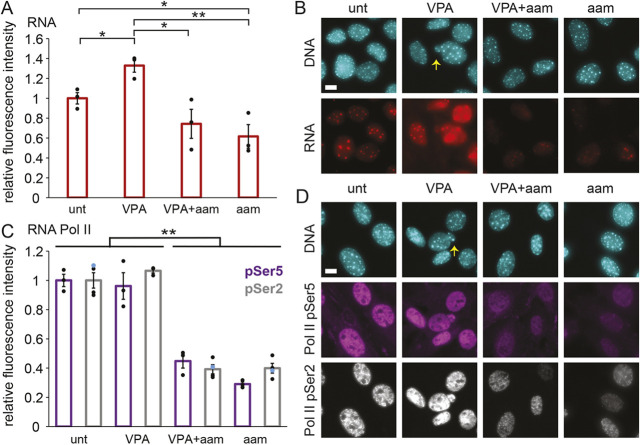
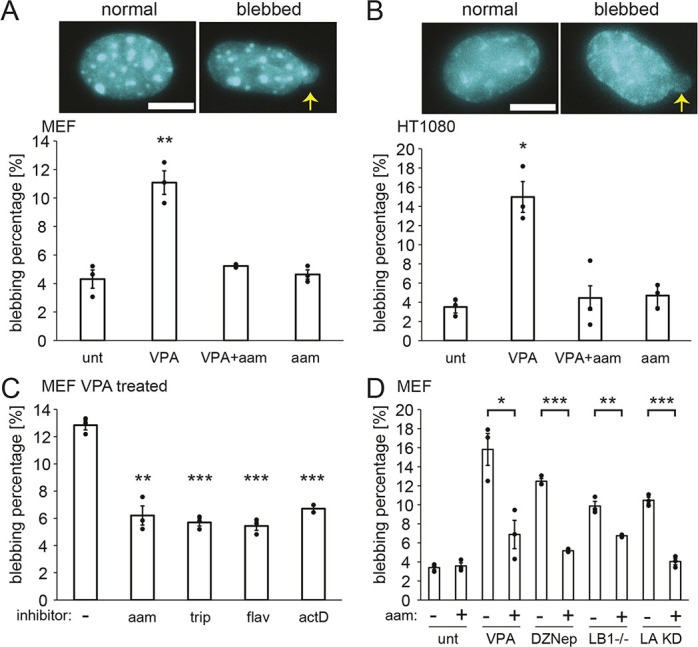
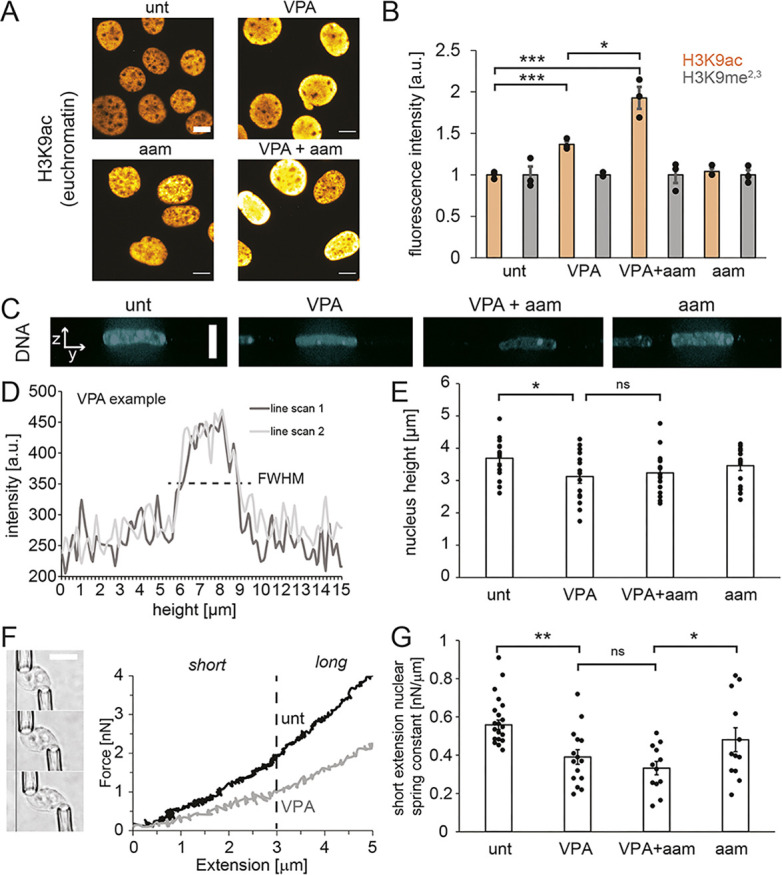
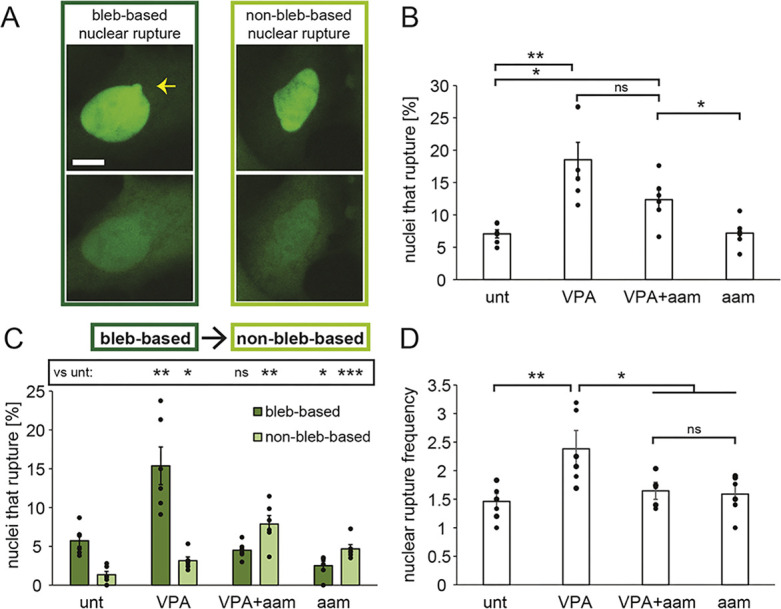
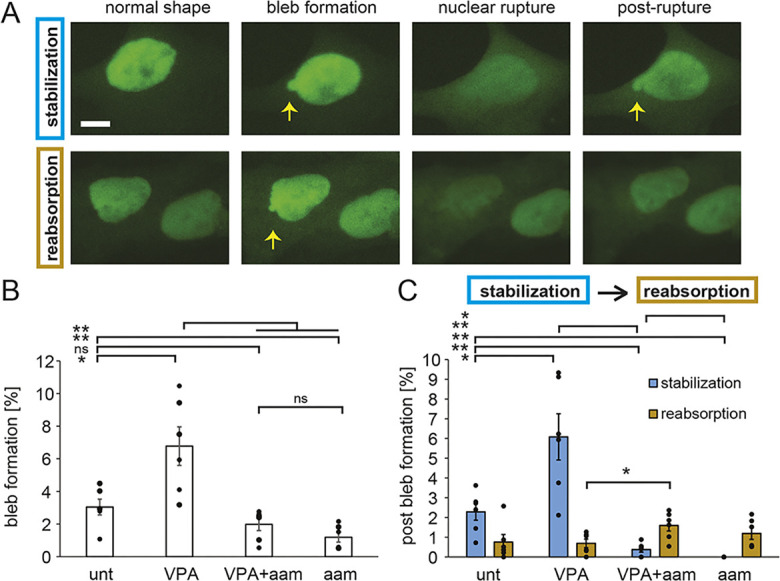
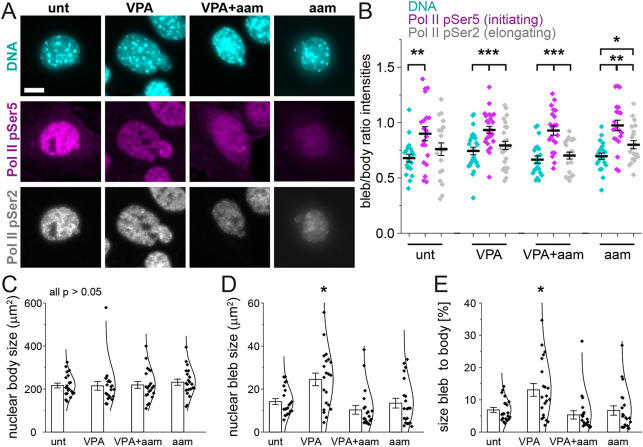
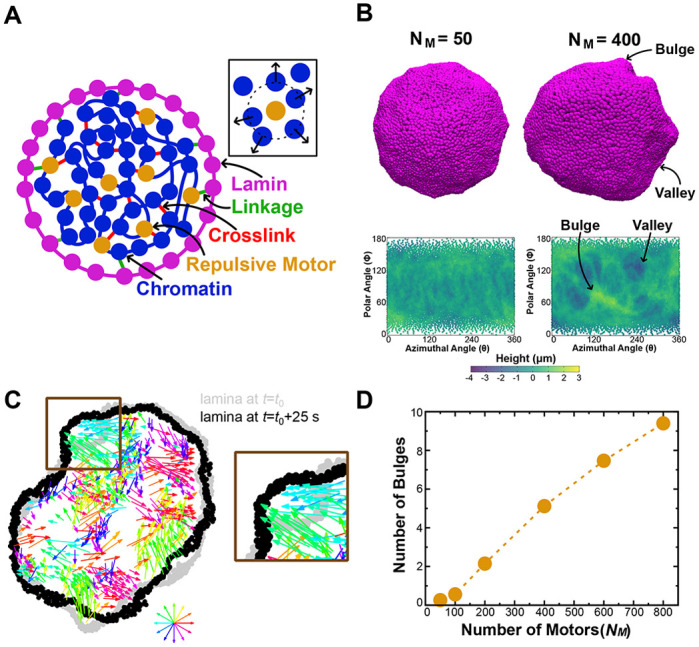
Chromatin plays an essential role in the nuclear mechanical response and determining nuclear shape, which maintain nuclear compartmentalization and function. However, major genomic functions, such as transcription activity, might also impact cell nuclear shape via blebbing and rupture through their effects on chromatin structure and dynamics. To test this idea, we inhibited transcription with several RNA polymerase II inhibitors in wild-type cells and perturbed cells that presented increased nuclear blebbing. Transcription inhibition suppressed nuclear blebbing for several cell types, nuclear perturbations and transcription inhibitors. Furthermore, transcription inhibition suppressed nuclear bleb formation, bleb stabilization and bleb-based nuclear ruptures. Interestingly, transcription inhibition did not alter the histone H3 lysine 9 (H3K9) modification state, nuclear rigidity, and actin compression and contraction, which typically control nuclear blebbing. Polymer simulations suggested that RNA polymerase II motor activity within chromatin could drive chromatin motions that deform the nuclear periphery. Our data provide evidence that transcription inhibition suppresses nuclear blebbing and rupture, in a manner separate and distinct from chromatin rigidity.

Keywords: Chromatin; Mechanobiology; Nuclear blebbing; Nucleus.


Conflict of interest statement

Competing interests The authors declare no competing or financial interests.

Figures

Fig. 1.
Fig. 1.
Transcription is decreased upon treatment with the RNA pol II inhibitor α-amanitin in both untreated and VPA-treated MEFs. (A,B) Graph (A) and example images (B) of RNA fluorescence levels in MEFs, labeled via EU Click-iT chemistry (red) and DNA labeled via Hoechst (cyan) for untreated (‘unt’), VPA-treated, VPA- and α-amanitin-treated (‘VPA+aam’), and α-amanitin-treated (‘aam’) cells. (C,D) Graph (C) and example images (D) of immunofluorescence levels of RNA pol II phosphorylated at Ser5 (purple, initiating) and Ser2 (gray, elongating) with DNA labeled via Hoechst (cyan). Yellow arrows denote nuclear blebs in example images. α-Amanitin treatment was for 24 h. Three biological replicates were performed with n>30 cells. Error bars represent standard error. *P<0.05; **P<0.01 (two-tailed unpaired Student's t-test). Scale bars: 10 µm.
Fig. 2.
Fig. 2.
Transcription inhibition suppresses nuclear blebbing across cell types, drugs and perturbations that cause nuclear blebbing. (A,B) Example images and graph of percentages of nuclei that bleb in MEF cells (A) and HT1080 cells (B) for untreated (‘unt’), VPA-treated (VPA), VPA- and α-amanitin-treated (‘VPA+aam’), and α-amanitin-treated (‘aam’) cells. The means of three biological replicates with n=60–200 cells each are shown as dots. Yellow arrows denote nuclear blebs in example images. Scale bars: 10 µm. (C) Graph of percentages of nuclei that blebbed in VPA-treated MEF cells with or without the RNA pol II inhibitors α-amanitin (‘aam’, 24 h), triptolide (‘trip’, 24 h), flavopiridol (‘flav’, 24 h) and actinomycin D (‘actD’, 1.5 h). The means of three technical replicates with n>100 cells each are shown as dots. (D) Graph of percentages of nuclei that blebbed in wild-type cells (‘unt’) and different perturbations without or with the RNA pol II inhibitor α-amanitin (‘aam’). The perturbations were: increased euchromatin (VPA treatment), decreased heterochromatin (DZNep treatment), lamin B1 knockout (LB1−/− cells) and lamin A knockdown (LA KD cells). The means of three biological replicates are shown as dots with n>71 cells each for ‘unt’ and ‘VPA’, and with n>300 cells each for ‘DZNep’, ‘LB1−/−’ and ‘LA KD’. Error bars represent standard error. *P<0.05; **P<0.01; ***P<0.001 (two-tailed unpaired Student's t-test).
Fig. 3.
Fig. 3.
The mechanical properties of the nucleus are not altered by transcription inhibition. (A,B) Example images (A) and graphs (B) of the relative immunofluorescence signal of a euchromatin marker (H3K9ac, orange) and a heterochromatin marker (H3K9me2,3, gray) in untreated (‘unt’), VPA-treated, VPA- and α-amanitin-treated (‘VPA+aam’), and α-amanitin-treated (‘aam’) cells. The means of three biological replicates with n=100–300 cells each are shown as dots. (C) Example images of side and top-down views of Hoechst-labeled nuclei captured using spinning-disk confocal microscopy. There is no yellow dotted line. (D) Example line scans through the side-on image of the nucleus of the VPA-treated cell from panel C, from which the full-width at half maximum (FWHM) values from two different line scans were averaged to determine the height of each nucleus. (E) Individual (dots) and average (bar) measurements of nuclear height for each condition (n=15 nuclei for each condition). (F) Left: example images of a micromanipulation force-extension measurement, with an isolated nucleus from MEF V−/− cells pulled by the ‘pull’ pipette (bottom right) to extend the nucleus and held by the ‘force’ pipette (top left), the deflection of which multiplied by a precalibrated spring constant measures force. Right: example force-extension graph of control (‘unt’) and chromatin-decompacted (‘VPA’) cells over short and long regimes. The dashed line indicates the crossover from the short-extension to the long-extension regime. (G) Graph of the individual (dots) and average (bar) short-extension nuclear spring constants (‘unt’, n=21; ‘VPA’, n=15; ‘VPA+aam’, n=12; ‘aam’, n=12). Long-extension spring constants did not change for all conditions (P>0.05, Fig. S3B). α-Amanitin treatment was for 24 h. Error bars represent standard error. ns, not significant, P>0.05; *P<0.05; **P<0.01 (two-tailed unpaired Student's t-test). a.u., arbitrary units. Scale bars: 10 µm.
Fig. 4.
Fig. 4.
Transcription inhibition alters the type and frequency of ruptures per nucleus. (A) Example images of bleb-based (yellow arrow) and non-bleb-based nuclear ruptures. Scale bar: 10 µm. (B) Graph of the percentages of nuclei that displayed at least one rupture in a 3-h timelapse with 2-min intervals based on NLS–GFP fluorescence in untreated (‘unt’), VPA-treated, VPA- and α-amanitin-treated (‘VPA+aam’), and α-amanitin-treated cells (‘aam’). (C) Graph of the percentages of nuclei that present bleb-based (dark green) or non-bleb-based (light green) nuclear ruptures. (D) Graph of average nuclear rupture frequency which is, for nuclei that rupture, the average number of times a nucleus ruptured during the 3-h timelapse. The averages were calculated from six biological replicates, graphed as dots, and each consisted of n=100–300 cells. α-Amanitin treatment was for 24 h. Error bars represent standard error. ns, not significant, P>0.05; *P<0.05; **P<0.01; ***P<0.001 (two-tailed unpaired Student's t-test).
Fig. 5.
Fig. 5.
Bleb formation and stabilization are dependent on transcription activity. (A) Example images of stabilization (top, blue) or reabsorption (bottom, gold) of a newly formed bleb tracked via NLS–GFP live-cell imaging. Yellow arrows denote blebs. Scale bar: 10 µm. (B) Graph of the percentages of nuclei that display new nuclear bleb formation in a 3-h timelapse for untreated (‘unt’), VPA-treated, VPA- and α-amanitin-treated (‘VPA+aam’), and α-amanitin-treated (‘aam’) cells. (C) Graph showing the percentages of nuclei that displayed new nuclear bleb formation alongside a nuclear rupture that resulted in either bleb stabilization (blue) or reabsorption (gold) post rupture. The averages were calculated from six biological replicates, graphed as dots, and each consisted of n=100–300 cells. α-Amanitin treatment was for 24 h. Error bars represent standard error. ns, not significant, P>0.05; *P<0.05; **P<0.01 (two-tailed unpaired Student's t-test).
Fig. 6.
Fig. 6.
Transcription initiation is enriched in blebs relative to DNA content and overall supports bleb size. (A) Example images of Hoechst (DNA, cyan), RNA pol II phosphorylated at Ser5 (initiating, pSer5, magenta) and RNA pol II phosphorylated at Ser2 (elongating, pSer2, gray) staining in untreated (‘unt’), VPA-treated, VPA- and α-amanitin-treated (‘VPA+aam’), and α-amanitin-treated (‘aam’) cells. Scale bar: 10 µm. (B) Graph of the single-nucleus bleb intensity/nuclear body intensity ratio. DNA (Hoechst) signal intensity was decreased in blebs, but pol II pSer5 signal intensity in the bleb was enriched relative to DNA signal intensity and had a signal that was similar to that in the main nuclear body. (C–E) Graphs of average nuclear body size (C), nuclear bleb size (D) and average size of the bleb as a percentage of the nuclear body (E) (‘unt’, n=20; ‘VPA’, n=26; ‘VPA+aam’, n=21; ‘aam’, n=21). α-Amanitin treatment was for 24 h. Error bars represent standard error. *P<0.05; **P<0.01; ***P<0.001 (two-tailed unpaired Student's t-test).
Fig. 7.
Fig. 7.
Inhibition of motors decreases nuclear bulge formation. (A) Schematic two-dimensional cross-section of the simulation model. Inset: illustration of a repulsive motor (gold) repelling chromatin subunits within the interaction range. (B) Top: simulation snapshots of simulated nuclei with bulges and valleys for simulations with different numbers (NM) of motors. Bottom: lamina height maps corresponding to the simulation snapshots, showing bulges (green) and valleys (blue). Maps show deviation of the lamina from the mean shell radius at coordinates given by the polar angle θ and azimuthal angle φ. (C) Left: snapshot of a two-dimensional cross-section of a simulation showing the chromatin displacements over 25 s (colored arrows) and changes in nuclear shape. The lamina is shown at the beginning (time t0, gray) and end (time t0+25 s, black) of the 25 s time interval. The color wheel indicates the direction of motion encoded by the corresponding color. The region outlined by the brown box identifies a part of the lamina that bulges outward due to chromatin motion, which is reproduced in the image on the right. (D) Mean number of bulges increases with increasing numbers of motors (NM).

References

    1. Banigan, E. J., Stephens, A. D. and Marko, J. F. (2017). Mechanics and buckling of biopolymeric shells and cell nuclei. Biophys. J. 113, 1654-1663. 10.1016/j.bpj.2017.08.034 - DOI - PMC - PubMed
    1. Banigan, E. J., Tang, W., van den Berg, A. A., Stocsits, R. R., Wutz, G., Brandão, H. B., Busslinger, G. A., Peters, J.-M. and Mirny, L. A. (2023). Transcription shapes 3D chromatin organization by interacting with loop extrusion. Proc. Natl. Acad. Sci. USA 120, e2210480120. 10.1073/pnas.2210480120 - DOI - PMC - PubMed
    1. Barth, R., Bystricky, K. and Shaban, H. A. (2020). Coupling chromatin structure and dynamics by live super-resolution imaging. Sci. Adv. 6, eaaz2196. 10.1126/sciadv.aaz2196 - DOI - PMC - PubMed
    1. Belaghzal, H., Borrman, T., Stephens, A. D., Lafontaine, D. L., Venev, S. V., Weng, Z., Marko, J. F. and Dekker, J. (2021). Liquid chromatin Hi-C characterizes compartment-dependent chromatin interaction dynamics. Nat. Genet. 53, 367-378. 10.1038/s41588-021-00784-4 - DOI - PMC - PubMed
    1. Bensaude, O. (2011). Inhibiting eukaryotic transcription: Which compound to choose? How to evaluate its activity? Transcription 2, 103-108. 10.4161/trns.2.3.16172 - DOI - PMC - PubMed

Publication types

LinkOut - more resources