. 2023 Oct 17;4(10):101209.
doi: 10.1016/j.xcrm.2023.101209. Epub 2023 Sep 26.

Hyperglycemia-regulated tRNA-derived fragment tRF-3001a propels neurovascular dysfunction in diabetic mice

Affiliations

Hyperglycemia-regulated tRNA-derived fragment tRF-3001a propels neurovascular dysfunction in diabetic mice

Jun-Ya Zhu et al. Cell Rep Med. .

Abstract

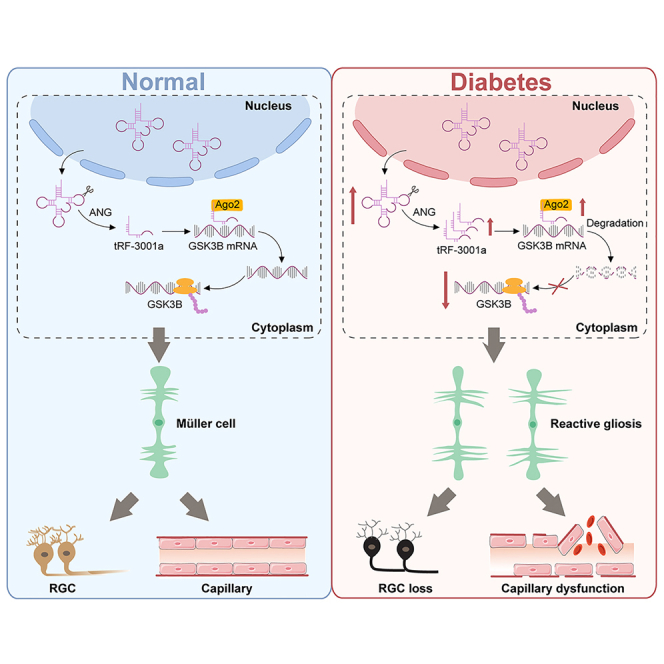
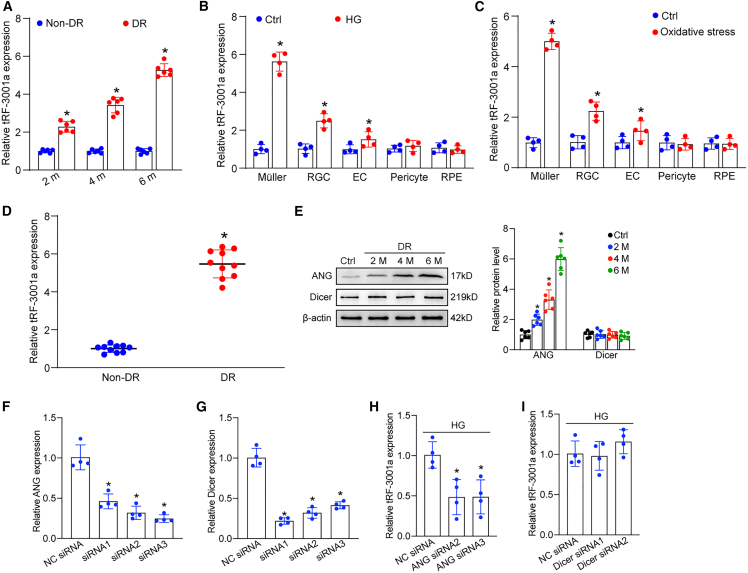
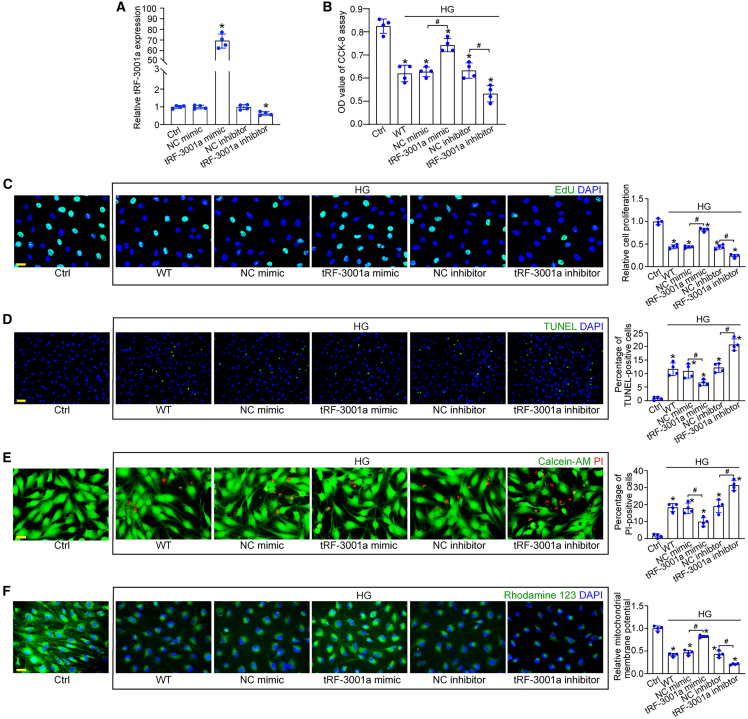
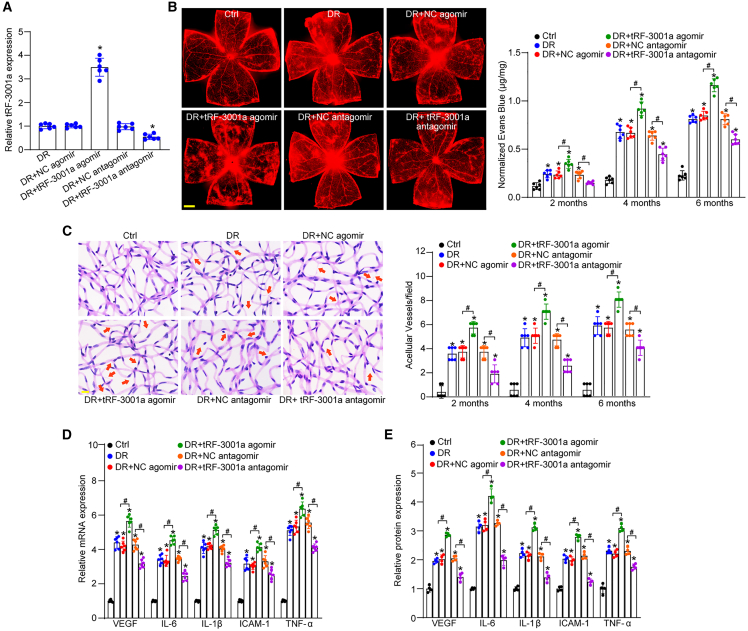
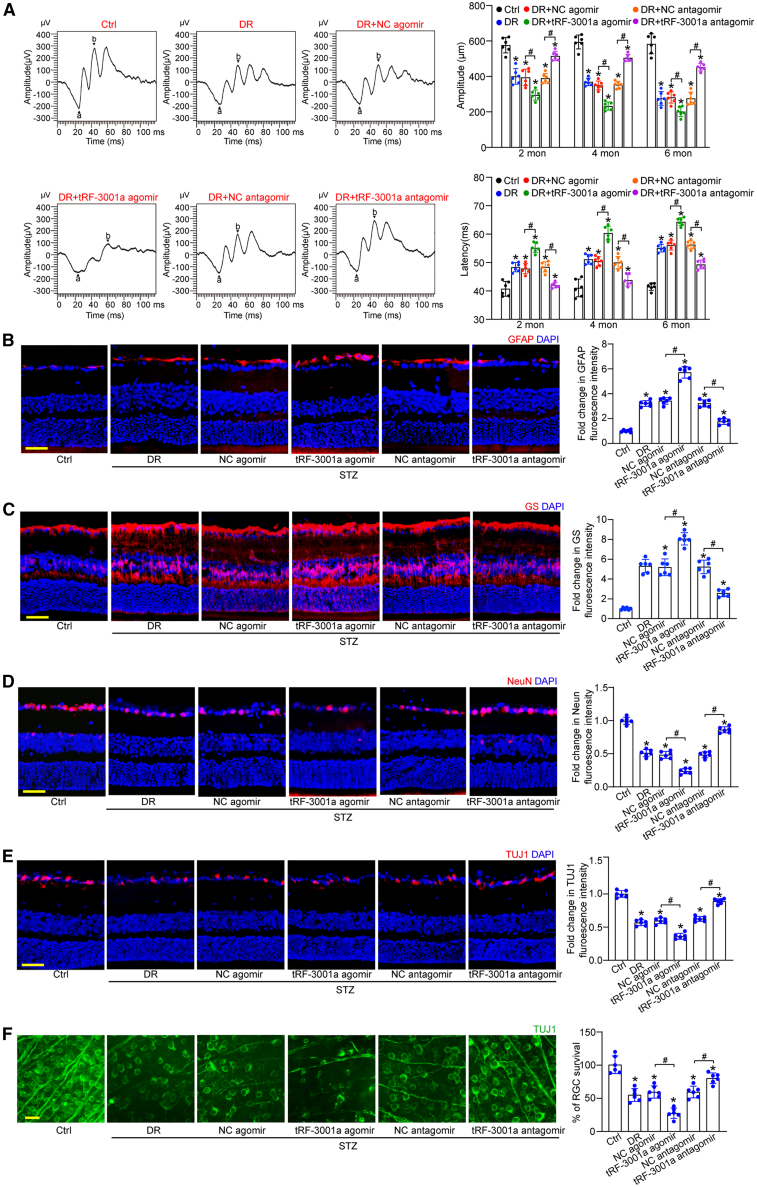
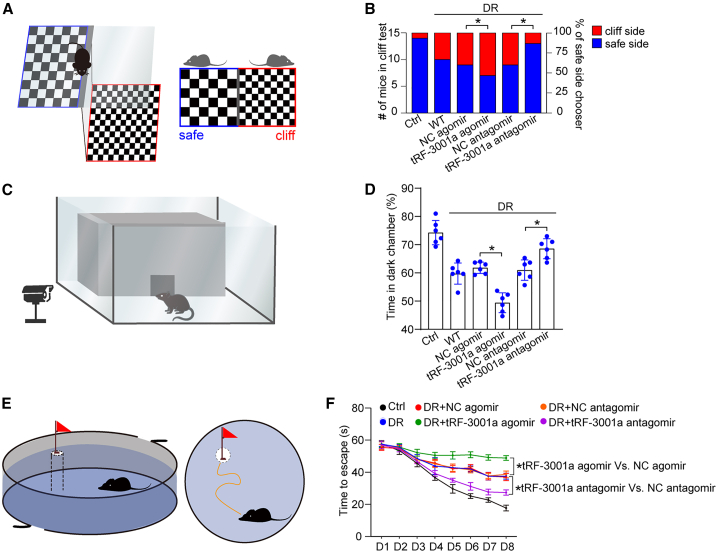
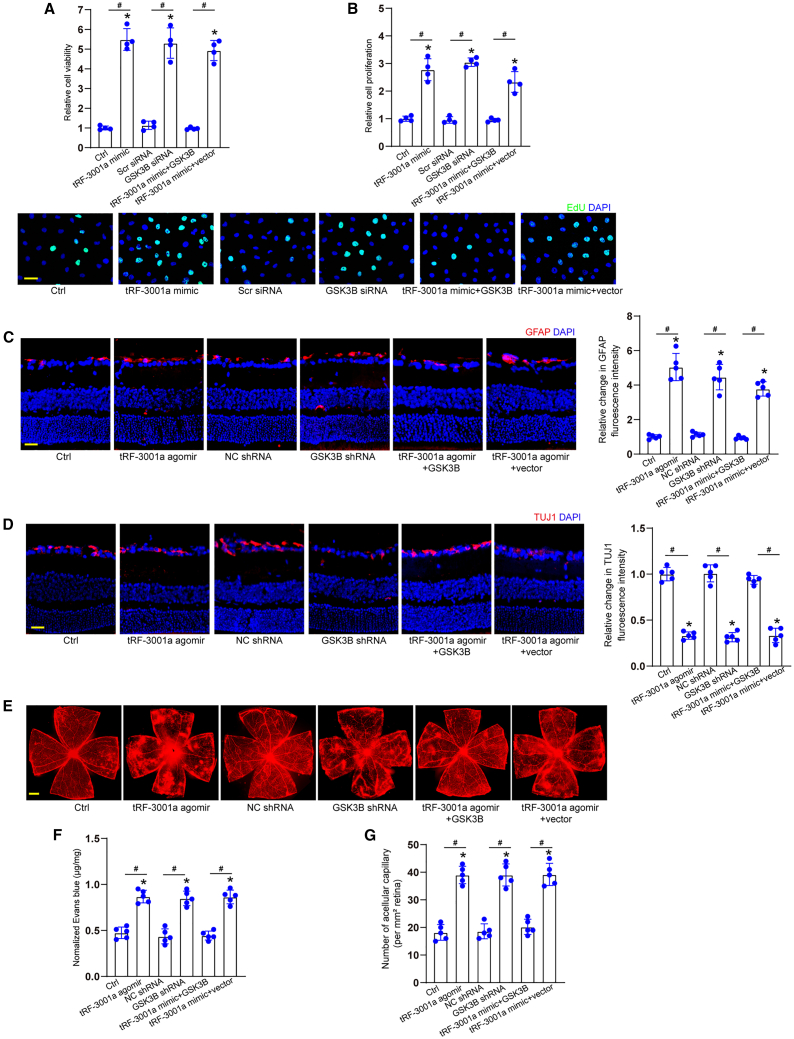
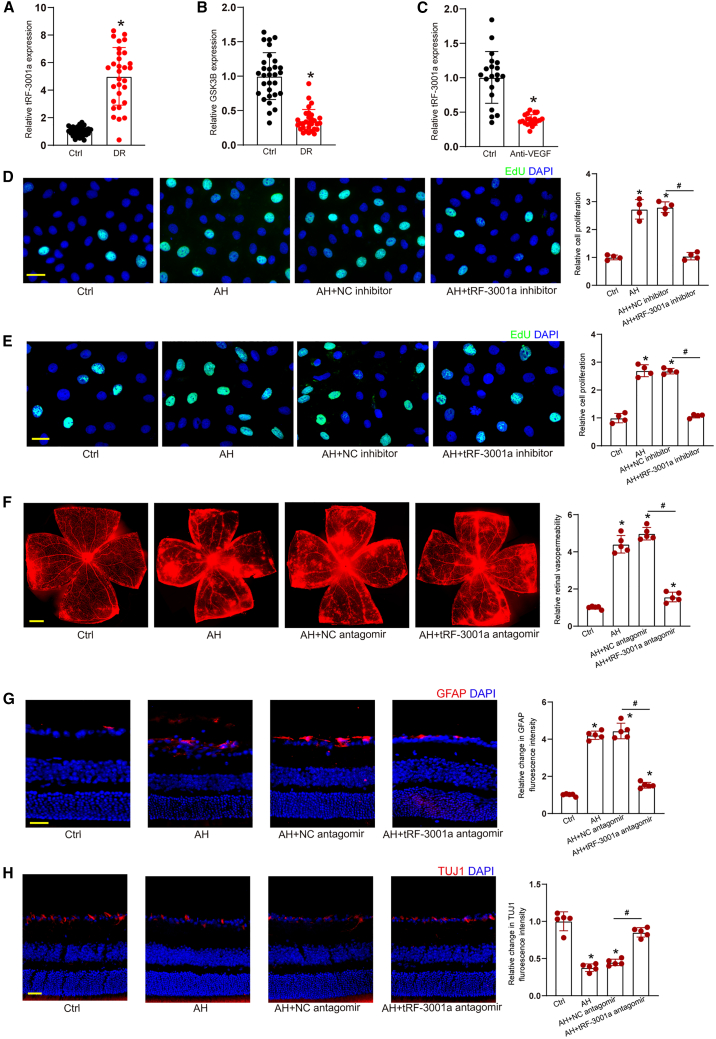
Neurovascular dysfunction is a preclinical manifestation of diabetic complications, including diabetic retinopathy (DR). Herein, we report that a transfer RNA-derived RNA fragment, tRF-3001a, is significantly upregulated under diabetic conditions. tRF-3001a downregulation inhibits Müller cell activation, suppresses endothelial angiogenic effects, and protects against high-glucose-induced retinal ganglion cell injury in vitro. Furthermore, tRF-3001a downregulation alleviates retinal vascular dysfunction, inhibits retinal reactive gliosis, facilitates retinal ganglion cell survival, and preserves visual function and visually guided behaviors in STZ-induced diabetic mice and db/db diabetic mice. Mechanistically, tRF-3001a regulates neurovascular dysfunction in a microRNA-like mechanism by targeting GSK3B. Clinically, tRF-3001a is upregulated in aqueous humor (AH) samples of DR patients. tRF-3001a downregulation inhibits DR-induced human retinal vascular endothelial cell and Müller cell dysfunction in vitro and DR-induced retinal neurovascular dysfunction in C57BL/6J mice. Thus, targeting tRF-3001a-mediated signaling is a promising strategy for the concurrent treatment of vasculopathy and neuropathy in diabetes mellitus.

Keywords: diabetic retinopathy; neuropathy; neurovascular dysfunction; transfer RNA-derived RNA fragment; vasculopathy.


Conflict of interest statement

Declaration of interests The authors declare no competing interests.

Figures

None
Graphical abstract
Figure 1
Figure 1
Expression level of tRF-3001a is upregulated following diabetic stress (A) Quantitative reverse transcription-polymerase chain reaction (qRT-PCR) assays were conducted to compare tRF-3001a expression between non-diabetic retinas and diabetic retinas following 2, 4, or 6 months of STZ injection (n = 6, ∗p < 0.05, Student’s t test). (B and C) Primary Müller cells, primary retinal ganglion cells (RGCs), retinal endothelial cells (ECs), pericytes, and RPEs were exposed to high glucose (HG, 25 mM) or oxidative stress (H2O2, 100 μM) or were left untreated (Ctrl) for 48 h. The levels of tRF-3001a expression were examined by qRT-PCR assays (n = 4, ∗p < 0.05, Student’s t test). (D) tRF-3001a expression in fibrovascular membranes of diabetic patients and idiopathic epiretinal membranes of non-diabetic patients was examined by qRT-PCR assays (n = 10, ∗p < 0.05, Student’s t test). (E) Western blots and quantitative analysis were conducted to assess the levels of ANG and Dicer expression in non-diabetic retinas and diabetic retinas following 2-, 4-, and 6-month diabetes induction (n = 6, ∗p < 0.05, one-way ANOVA followed by post hoc Bonferroni test). (F and G) Müller cells were transfected with ANG siRNA1-3, Dicer siRNA1-3, or negative control (NC) siRNA for 48 h. qRT-PCR assays were conducted to detect the levels of ANG and Dicer expression (n = 4, ∗p < 0.05, one-way ANOVA followed by post hoc Bonferroni test). (H and I) Müller cells were transfected with negative control (NC) siRNA, ANG siRNA, or Dicer siRNA, and exposed to high glucose (HG, 25 mM) for 48 h. qRT-PCR assays were conducted to detect the levels of tRF-3001 expression (n = 4, ∗p < 0.05, one-way ANOVA followed by post hoc Bonferroni test). See also Table S1.
Figure 2
Figure 2
tRF-3001a regulates Müller cell function following diabetic stress in vitro (A) Primary Müller cells were transfected with the negative control (NC) mimics, tRF-3001a mimics, NC inhibitors, or tRF-3001a inhibitors or were left untreated (Ctrl) for 24 h. The levels of tRF-3001a were determined by qRT-PCRs (n = 4, ∗p < 0.05 versus Ctrl, one-way ANOVA followed by Bonferroni test). (B–F) Primary Müller cells were transfected with NC mimics, tRF-3001a mimics, NC inhibitors, or tRF-3001a inhibitors or were left untreated (WT) for 6 h and then exposed to high glucose (25 mM) for 48 h. The group without high-glucose exposure was taken as the control (Ctrl) group. Cell viability was examined by CCK-8 assays (B, n = 4). Cell proliferation ability was examined by EdU staining and quantitated. EdU, green; DAPI, blue. Scale bar, 20 μm (C, n = 4). TUNEL assays were used to detect the apoptosis of Müller cells. TUNEL, green; DAPI, blue. Scale bar, 50 μm (D, n = 4). The dead or dying cells were detected by Calcein-AM/PI staining. Calcein-AM, green; PI, red. Scale bar, 20 μm (E, n = 4). Rhodamine 123 staining was used to detect the change of mitochondrial membrane potentials (ΔΨm) in Müller cells. Rhodamine 123, green; DAPI, blue. Scale bar, 20 μm (F, n = 4). ∗p < 0.05 versus Ctrl; #p < 0.05 between the marked groups. The significant difference was evaluated by one-way ANOVA followed by post hoc Bonferroni test. See also Figures S1, S2, and S3.
Figure 3
Figure 3
tRF-3001a regulates diabetes-induced retinal vascular dysfunction in vivo (A) STZ-induced diabetic C57BL/6J mice received intravitreal injections of negative control (NC) agomir, tRF-3001a agomir, NC antagomir, or tRF-3001a antagomir or were left untreated (DR) once a month for 6 months. The non-diabetic C57BL/6J mice were taken as the control (Ctrl) group. qRT-PCRs were conducted to determine the levels of tRF-3001a expression (n = 6). (B) The mice were infused with Evans blue dye for 2 h. The fluorescence signal of flat-mounted retina was observed under a 4× lens. Evans blue leakage was quantified following 2-, 4-, and 6-month diabetes induction. The representative images were shown at 6 months after diabetes induction (n = 6). Scale bar, 500 μm. (C) Retinal trypsin digestion was used to detect retinal acellular capillaries. Red arrow indicates acellular capillaries. Quantification analysis was averaged from 15 randomly selected fields per retina. The representative images are shown (n = 6). Scale bar, 10 μm. (D) qRT-PCR assays were conducted to detect the expression of VEGF, IL-6, IL-1β, ICAM-1, and TNF-α mRNA (n = 6). (E) ELISA assays were conducted to examine the expression of VEGF, IL-6, IL-1β, ICAM-1, and TNF-α protein in retinal lysates (n = 4). ∗p < 0.05 versus Ctrl; #p < 0.05 between the marked groups. The significant difference was evaluated by one-way ANOVA followed by post hoc Bonferroni test. See also Figures S4 and S5.
Figure 4
Figure 4
tRF-3001a regulates diabetes-induced retinal neuronal dysfunction in vivo (A) Electrophysiology was performed to detect retinal neuronal function in non-diabetic mice (Ctrl), STZ-induced diabetic mice injected with negative control (NC) agomir, tRF-3001a agomir, NC antagomir, and tRF-3001a antagomir following 2-, 4-, or 6-month diabetes induction. The representative images were shown at 4 months after diabetes induction (n = 6). The amplitudes and latency of b waves were statistically calculated (n = 6). (B and C) Immunofluorescence and quantitative analysis of GFAP staining (B) or GS staining (C) were conducted to detect retinal reactive gliosis along with the representative images (n = 6). Scale bar, 50 μm. (D and E) Immunofluorescence and quantitative analysis of NeuN staining (D) or TUJ1 staining (E) were conducted to detect RGC survival. The representative images are shown (n = 6). Scale bar, 50 μm. (F) Retinal whole mounts following TUJ1 staining were observed from the peripheral area. RGC survival rate was calculated by dividing the average number of TUJ1-positive cells in one field in the injured retina by that in the uninjured (Ctrl) retina (n = 6). Scale bar, 20 μm ∗p < 0.05 versus Ctrl; #p < 0.05 between the marked groups. The significant difference was evaluated by one-way ANOVA followed by post hoc Bonferroni test. See also Figures S6, S7, and S8.
Figure 5
Figure 5
tRF-3001a regulates diabetes-induced visual impairment in vivo Vision-related behavioral tests were used to evaluate the degree of visual impairment in non-diabetic mice (Ctrl), STZ-induced diabetic mice (WT), or STZ-induced diabetic mice injected with negative control (NC) agomir, tRF-3001a agomir, NC antagomir, or tRF-3001a antagomir at 6 months after diabetes induction. The schematic diagram for visual cliff test is shown (A). The statistical results display the number (left y axis) and percentage (right y axis) of cliff/safe side choosers (B, n = 6). The schematic diagram of dark-light preference test is shown (C). The statistical result shows the percentage of time in the dark chamber within 5 min (D, n = 6). The schematic diagram of Morris water maze test is shown (E). The statistical result shows the time required until the mice reached the visible platform for 8 days (F, n = 6). ∗p < 0.05 between the marked groups. The significant difference was evaluated by one-way ANOVA followed by post hoc Bonferroni test. See also Figure S9.
Figure 6
Figure 6
tRF-3001a-GSK3B signaling axis regulates retinal neurovascular dysfunction in vitro and in vivo (A and B) Müller cells were transfected with negative control (NC) mimics (Ctrl), tRF-3001a mimics, NC siRNA, GSK3B siRNA, tRF-3001a plus GSK3B overexpression vector, or tRF-3001a plus null vector for 24 h. Cell viability was examined by CCK-8 assays (A, n = 4). Cell proliferation was examined by EdU staining. EdU, green; DAPI, blue. Scale bar, 20 μm (B, n = 4). (C–G) STZ-induced diabetic mice received intravitreal injections of NC agomir, tRF-3001a agomir, NC shRNA, GSK3B shRNA, tRF-3001a plus GSK3B overexpression vector, or tRF-3001a plus null vector for 2 months. Retinal reactive gliosis (C; scale bar, 50 μm), RGC degeneration (D; scale bar, 50 μm), retinal vasopermeability (E and F; scale bar, 500 μm), and retinal acellular capillaries (G) were detected to evaluate the role of tRF-3001a-GSK3B signaling axis in retinal neurovascular dysfunction in vivo (n = 5). ∗p < 0.05 versus Ctrl group, #p < 0.05 between the marked groups; one-way ANOVA followed by post hoc Bonferroni test. See also Figures S10, S11, and S12.
Figure 7
Figure 7
Clinical implication of tRF-3001a-mediated signaling in neurovascular disease (A and B) Aqueous humor (AH) samples were collected from the patients with DR (n = 30 eyes) and the patients with cataract (Ctrl, n = 30 eyes). qRT-PCRs and ELISA assays were conducted to detect the levels of tRF-3001a and GSK3B expression. ∗p < 0.05 versus Ctrl group, Mann-Whitney U test. (C) AH samples were collected from DR patients before (Ctrl group) or after anti-VEGF treatment. qRT-PCRs were conducted to detect the levels of tRF-3001a expression (n = 20 eyes). ∗p < 0.05 versus Ctrl group; Mann-Whitney U test. (D and E) HRVECs or Müller cells were cultured with the AH samples from DR patients, AH samples plus negative control (NC) inhibitor, or AH samples plus tRF-3001a inhibitors or were left untreated (Ctrl) for 48 h. EdU assays were conducted to determine the role of tRF-3001a in cell proliferation (n = 4; ∗p < 0.05 versus Ctrl group, #p < 0.05 versus AH group; one-way ANOVA followed by post hoc Bonferroni test). (F–H) C57BL/6J mice received intravitreal injections of AH samples from DR patients, AH samples plus NC antagomir, or AH samples plus tRF-3001a antagomir or were left untreated (Ctrl) for 14 days. Retinal vasopermeability (F; scale bar, 500 μm), reactive gliosis (G; scale bar, 50 μm), and RGC degeneration (H; scale bar, 50 μm) were examined to evaluate the role of tRF-3001a in retinal neurovascular dysfunction (n = 5, ∗p < 0.05 versus Ctrl group, #p < 0.05 versus AH group, one-way ANOVA followed by post hoc Bonferroni test). To visualize whole retinal vasculature in (F), the tiles-canning technique was used whereby multiple overlapping images were acquired using a 4X objective with similar gain settings. The composite images were constructed by arraying the individual images in Photoshop software. The representative composite images and statistical results are shown. See also Table S2.

References

    1. Goedeke L., Perry R.J., Shulman G.I. Emerging pharmacological targets for the treatment of nonalcoholic fatty liver disease, insulin resistance, and type 2 diabetes. Annu. Rev. Pharmacol. 2019;59:65–87. doi: 10.1146/annurev-pharmtox-010716-104727. - DOI - PMC - PubMed
    1. Cole J.B., Florez J.C. Genetics of diabetes mellitus and diabetes complications. Nat. Rev. Nephrol. 2020;16:377–390. doi: 10.1038/s41581-020-0278-5. - DOI - PMC - PubMed
    1. Mauricio D., Alonso N., Gratacòs M. Chronic diabetes complications: the need to move beyond classical concepts. Trends Endocrinol. Metabol. 2020;31:287–295. doi: 10.1016/j.tem.2020.01.007. - DOI - PubMed
    1. Feldman E.L., Callaghan B.C., Pop-Busui R., Zochodne D.W., Wright D.E., Bennett D.L., Bril V., Russell J.W., Viswanathan V. Diabetic neuropathy. Nat. Rev. Dis. Prim. 2019;5:41. doi: 10.1038/s41572-019-0092-1. - DOI - PubMed
    1. Salas-Salvadó J., Becerra-Tomás N., Papandreou C., Bulló M. Dietary patterns emphasizing the consumption of plant foods in the management of type 2 diabetes: a narrative review. Adv. Nutr. 2019;10:S320–S331. doi: 10.1093/advances/nmy102. - DOI - PMC - PubMed

Publication types