. 2024 Feb 23;73(3):496-508.
doi: 10.1136/gutjnl-2023-330748.

Molecular portraits of patients with intrahepatic cholangiocarcinoma who diverge as rapid progressors or long survivors on chemotherapy

Affiliations

Molecular portraits of patients with intrahepatic cholangiocarcinoma who diverge as rapid progressors or long survivors on chemotherapy

Colm J O'Rourke et al. Gut. .

Abstract

Objective: Cytotoxic agents are the cornerstone of treatment for patients with advanced intrahepatic cholangiocarcinoma (iCCA), despite heterogeneous benefit. We hypothesised that the pretreatment molecular profiles of diagnostic biopsies can predict patient benefit from chemotherapy and define molecular bases of innate chemoresistance.

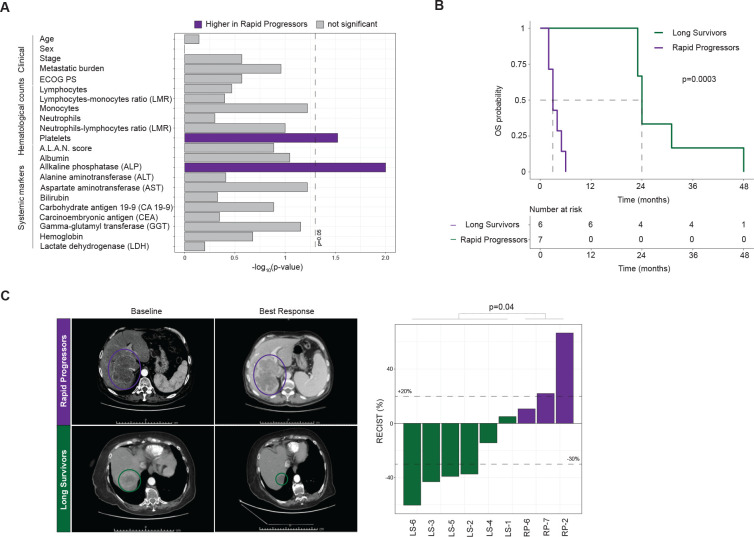
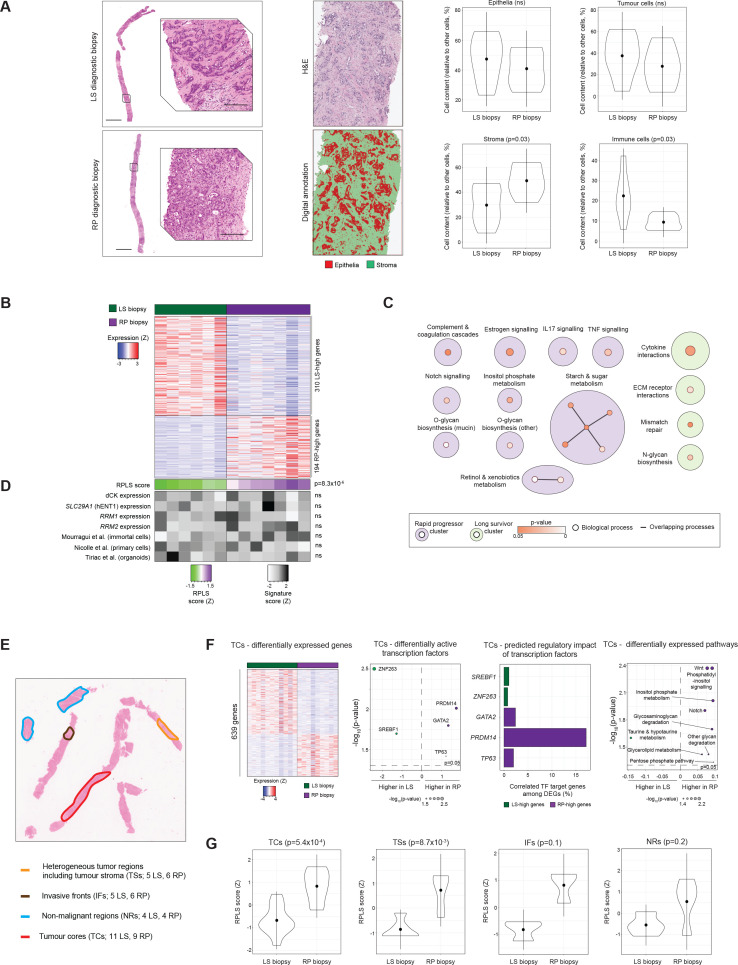
Design: We identified a cohort of advanced iCCA patients with comparable baseline characteristics who diverged as extreme outliers on chemotherapy (survival <6 m in rapid progressors, RP; survival >23 m in long survivors, LS). Diagnostic biopsies were characterised by digital pathology, then subjected to whole-transcriptome profiling of bulk and geospatially macrodissected tissue regions. Spatial transcriptomics of tumour-infiltrating myeloid cells was performed using targeted digital spatial profiling (GeoMx). Transcriptome signatures were evaluated in multiple cohorts of resected cancers. Signatures were also characterised using in vitro cell lines, in vivo mouse models and single cell RNA-sequencing data.

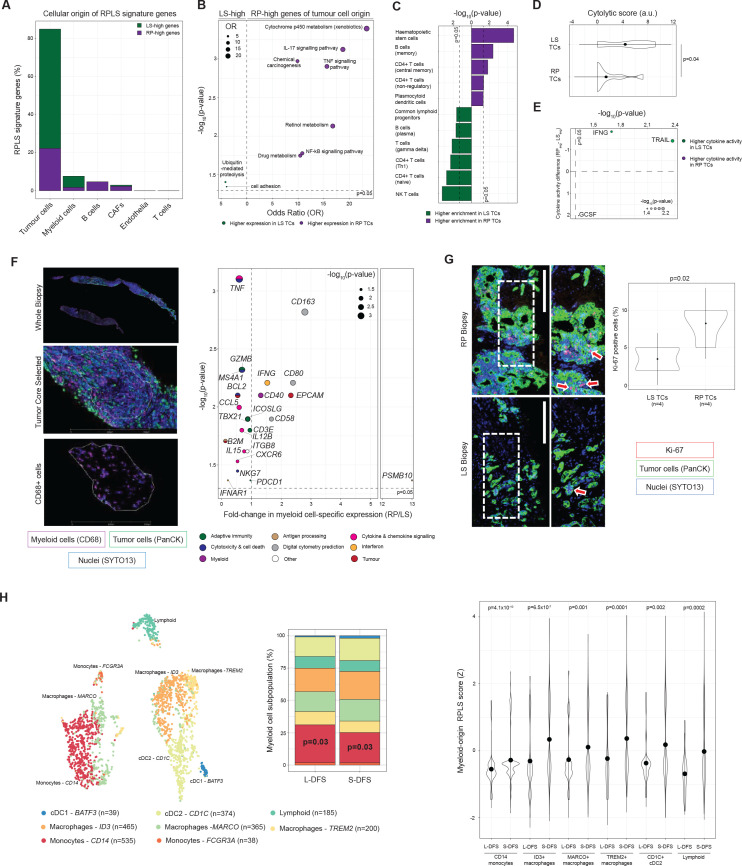
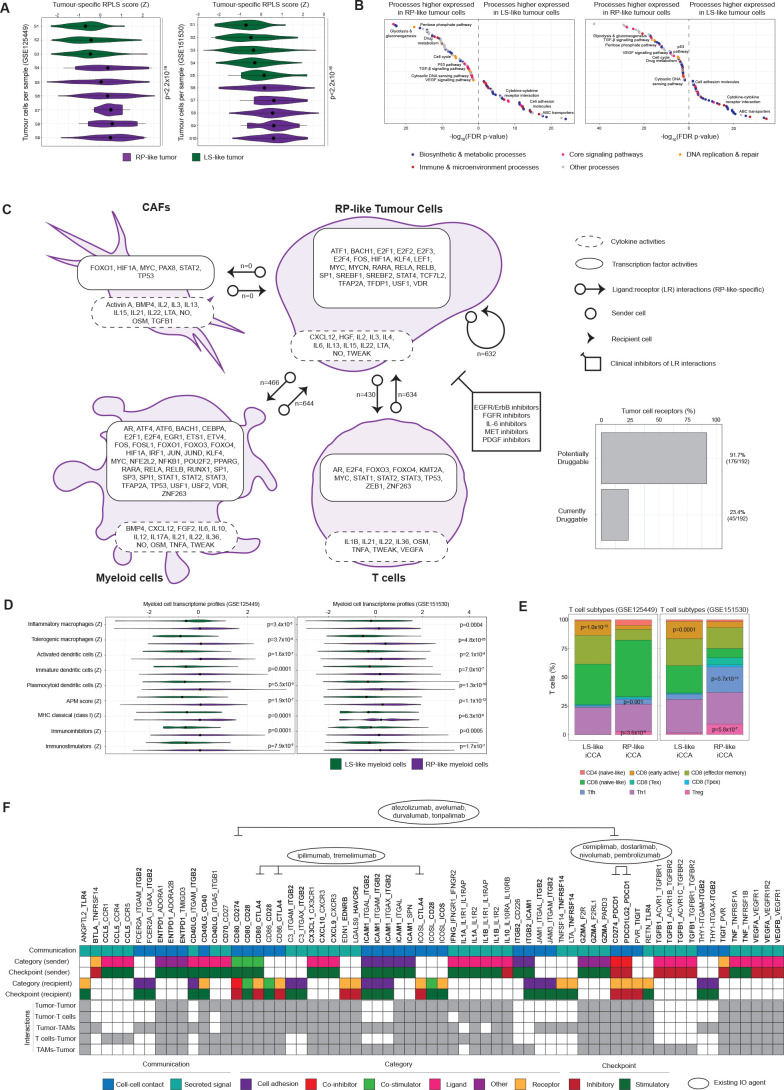
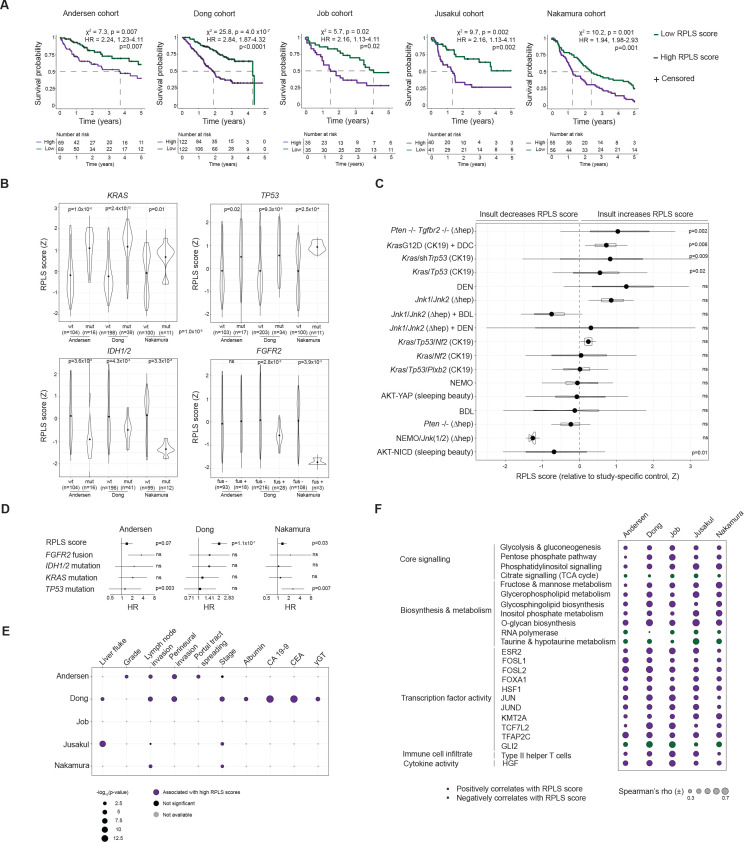
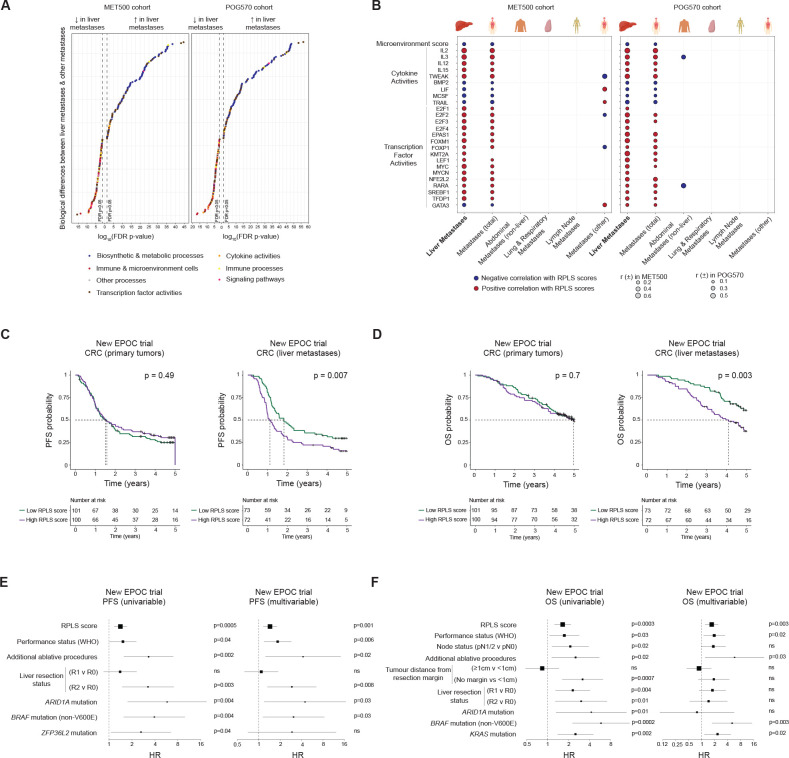
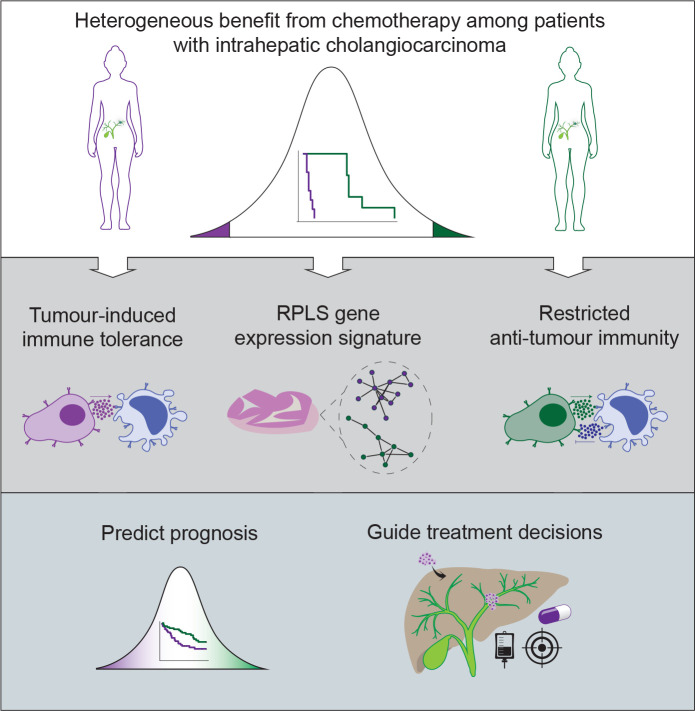
Results: Pretreatment transcriptome profiles differentiated patients who would become RPs or LSs on chemotherapy. Biologically, this signature originated from altered tumour-myeloid dynamics, implicating tumour-induced immune tolerogenicity with poor response to chemotherapy. The central role of the liver microenviroment was confrmed by the association of the RPLS transcriptome signature with clinical outcome in iCCA but not extrahepatic CCA, and in liver metastasis from colorectal cancer, but not in the matched primary bowel tumours.

Conclusions: The RPLS signature could be a novel metric of chemotherapy outcome in iCCA. Further development and validation of this transcriptomic signature is warranted to develop precision chemotherapy strategies in these settings.

Keywords: chemotherapy; cholangiocarcinoma; liver.


Conflict of interest statement

Competing interests: JBA is a member of the scientific advisory board at SEALD, Norway and reports scientific consultancies for QED Therapeutics and Flagship Pioneering. JBA has received research funding from Incyte. CB received honoraria as speaker (Astrazeneca, Incyte) and consultant (Incyte, Servier, Boehringer Ingelheim, Astrazeneca), received research funds (Avacta, Medannex, Servier) and her spouse is an employee of Astrazeneca. JML is receiving research support from Eisai, Bayer HealthCare Pharmaceuticals, Ipsen, and consulting fees from Eisai, Merck, Bristol-Myers Squibb, Eli Lilly, Roche, Genentech, Ipsen, Glycotest, AstraZeneca, Bayer HealthCare Pharmaceuticals, Omega Therapeutics, Mina Alpha, Boston Scientific, Exelixis, Bluejay and Captor Therapeutics. RM has received consulting and lecture fees from Servier and Roche and travel and education funding from MSD, Eli Lilly, Bayer, Roche, Astrazeneca. AL reports receiving consulting fees from Intercept Pharma, Alfa Sigma, Takeda, and Albireo Pharma, and speakers’ fees from Gilead, Abbvie, MSD, Intercept Pharma, AlfaSigma, GSK and Incyte.

Figures

Figure 1
Figure 1
Clinical characteristics and chemotherapy response of patients with intrahepatic cholangiocarcinoma in the RPLS cohort. (A) Kaplan-Meier survival curves with log-rank statistics for overall survivalin the RPLS cohort. (B) Barplot of statistical differences in baseline characteristics between rapid progressor (RP) and long survivor (LS) patients. (C) Representative baseline and best response CT images for an RP and an LS patient. Barplot of best radiological response (Response Evaluation Criteria in Solid Tumours (RECIST)1; Welch t-test). Disease was not measurable for one RP patient, while three RP patients had clinical progression without radiological confirmation (RP-1/RP-3/RP-4/RP-5). ALAN, actual neutrophil count; lymphocyte-monocyetesratio; neutrophil-lymphocytesratio; albumin.
Figure 2
Figure 2
Histopathological and transcriptomic profiles of diagnostic biopsies from the RPLS cohort. (A) Representative H&E images (scale bars: 2 mm—top; 200 µm—bottom), characterisation of the epithelial component of diagnostic biopsies in each region of interest, and differential composition in tumourous, stromal and immune cells following cell segmentation (LS: n=6; RP: n=7; Welch t-test). (B) Heatmap of 504 differentially expressed genes (≥2 fold change, p<0.05; Wilcoxon) between LS and RP biopsies. (C) KEGG pathway over-representation analysis of LS-high and RP-high genes using EnrichmentMap. Overlapping pathways are connected by lines and annotated under a common theme using AutoAnnotate. KEGG: Kyoto Encyclopaedia of Genes and Genomes. (D) Heatmap and differential expression analysis of the RPLS score and previously published metrics of gemcitabine sensitivity in the RPLS cohort. P values were derived by Wilcoxon test. (E) Representative H&E stain of a diagnostic biopsy, indicating histological regions targeted by macrodissection. (F) Differentially expressed genes (≥2 fold change, p<0.05; Wilcoxon), differentially active transcription factors (p<0.05, Wilcoxon test; DoRothEA), differentially expressed pathways (p<0.05, Wilcoxon test; ssGSEA of KEGG and Hallmarks gene lists), and differentially active cytokines (p<0.05, Wilcoxon test; CytoSig) between RP and LS tumour cores (TCs; 11 LS, 9 RP). (G) Differential expression of the bulk tissue RPLS signature in TCs, tumour stroma (TSs; 5 LS, 6 RP), invasive fronts (IFs; 3 LS, 3 RP) and non-malignant regions (NRs; 4 LS, 4 RP) from RP and LS biopsies (Wilcoxon test). LS, long survivor; RP, rapid progressor.
Figure 3
Figure 3
Cellular origins and tumour-immune dynamics associated with the RPLS signature. (A) Barplot of cell type-associations of RPLS signature genes. Genes were only assigned to cell types if their associations were supported by two independent single cell RNA-sequencing datasets. (B) KEGG pathway over-representation analysis of tumour-origin RPLS signature genes. (C) Differential enrichment (Wilcoxon test) of immune cell type signatures in rapid progressor (RP) and long survivor (LS) tumour cores (TCs) determined by cellular deconvolution (xCell). (D) Differential cytolytic scores (Wilcoxon test) between RP and LS TCs. (E) Differential cytokine activities (Wilcoxon test) between RP and LS TCs determined by CytoSig. (F) Representative multiplex immunofluorescence images of TCs undergoing RNA extraction from myeloid (CD68+) myeloid cells using the Digital Spatial Profiling (GeoMx) platform with regions of interest identifed. Volcano plot of differentially expressed genes (Immune Pathways Panel (NanoString) plus 5 custom targets derived from digital cytometry) in tumour-infiltrating myeloid cells from LS (n=6) and RP (n=6) TCs. P values were computed by Wilcoxon test. (G) Representative Ki-67 staining in an LS and RP TCs, including differential proliferation analysis (Welch t-test). (H) tSNE plot of myeloid subpopulations identified in immune-enriched single cell RNA-sequencing data from three resected iCCA. Frequency barplot (p values from χ2 test) comparing the abundance of myeloid subpopulations in patients without (long disease-free survival, L-DFS) and with (short disease-free survival, S-DFS) recurrence under adjuvant treatment with capecitabine. Differential expression (Wilcoxon test) of the myeloid-origin RPLS signature in myeloid subpopulations. iCCA, intrahepatic cholangiocarcinoma.
Figure 4
Figure 4
Modelling the RPLS signature in iCCA single cell RNA-sequencing data. (A) Annotation of tumours as long survivor (LS)-iike or rapid progressor (RP)-like based on tumour cell expression of the tumour-origin RPLS signature (ESCAPE tool, p values derived by Wilcoxon test). (B) Differentially expressed pathways and processes (ESCAPE with KEGG and Hallmarks gene lists) between LS-like and RP-like tumour cells. (C) Cell type-specific transcription factor activities (DoRothEA), cytokine activities (CytoSig) and ligand:receptor interactions (CellChat) unique to RP-like tumours in GSE125449 and GSE151530, including the potential and current druggability of tumour surface receptors. (D) Differential expression of myeloid cell type and functional signatures in LS-like and RP-like myeloid cells (ESCAPE, Wilcoxon test). (E) T cell subtype annotation using ProjectTILs (p values from Fisher’s exact test). (F) RP-specific ligand-receptor interactions tumours in GSE125449 and GSE151530 involving immunomodulatory targets (highlighted in bold; defined by CRI iAtlas). iCCA, intrahepatic cholangiocarcinoma.
Figure 5
Figure 5
Prognostic, clinicogenomic and transcriptomic associations of the RPLS signature in 653 resected iCCA. (A) Kaplan-Meier survival curves with log-rank statistics of resected iCCA stratified into high (>median) or low (
Figure 6
Figure 6
Pathobiological associations and predictive potential of the RPLS signature in liver metastases. (A) Differential expression of pathways and processes (ssGSEA with KEGG and Hallmarks gene lists) between liver metastases and other metastases in MET500 (n=490) and POG570 (n=438) cohorts (p values derived from Wilcoxon test). (B) Biological processes uniquely associated with the RPLS signature in liver metastases. (C, D) Kaplan-Meier survival curves with log-rank statistics of primary colorectal cancer tumours (n=204) and liver metastases (n=145) stratified by RPLS score (above and below median) for (C) progression-free survival and (D) overall survival in the New EPOC trial. (E–F) Univariable and multivariable Cox proportional hazards analysis of RPLS scores and other significant clinicogenomic variables for (E) progression-free and (F) overall survival. ns, not significant.
Figure 7
Figure 7
Graphical schematic of RPLS-associated chemosensitivity in iCCA. Heterogeneous benefit from chemotherapy is associated with tumour-induced tolerogenicity and restricted anti-tumour immunity. Pending further validation, the RPLS signature could clinically empower accurate prognostic prediction and guide treatment selection. iCCA, intrahepatic cholangiocarcinoma.

Comment in

References

    1. Bertuccio P, Malvezzi M, Carioli G, et al. . “Reply to: "global trends in mortality from Intrahepatic and extrahepatic cholangiocarcinoma"” J Hepatol 2019;71:1262–3. 10.1016/j.jhep.2019.08.033 - DOI - PubMed
    1. Vithayathil M, Khan SA. Current epidemiology of cholangiocarcinoma in Western countries. J Hepatol 2022;77:1690–8. 10.1016/j.jhep.2022.07.022 - DOI - PubMed
    1. Izquierdo-Sanchez L, Lamarca A, La Casta A, et al. . Cholangiocarcinoma landscape in Europe: diagnostic, prognostic and therapeutic insights from the ENSCCA registry. J Hepatol 2022;76:1109–21. 10.1016/j.jhep.2021.12.010 - DOI - PubMed
    1. Valle J, Wasan H, Palmer DH, et al. . Cisplatin plus gemcitabine versus gemcitabine for biliary tract cancer. N Engl J Med 2010;362:1273–81. 10.1056/NEJMoa0908721 - DOI - PubMed
    1. Oh D-Y, Ruth He A, Qin S, et al. . Durvalumab plus gemcitabine and cisplatin in advanced biliary tract cancer. NEJM Evidence 2022;1. 10.1056/EVIDoa2200015 - DOI - PubMed

Publication types