. 2023 Sep 27;14(1):6030.
doi: 10.1038/s41467-023-41442-z.

Proteomic and genetic analyses of influenza A viruses identify pan-viral host targets

Kelsey M Haas  1   2   3   4 Michael J McGregor  1   2   3   4 Mehdi Bouhaddou  1   2   3   4 Benjamin J Polacco  2   3   4 Eun-Young Kim  5 Thong T Nguyen  1 Billy W Newton  2   3 Matthew Urbanowski  6 Heejin Kim  5 Michael A P Williams  4   6   7 Veronica V Rezelj  4   8 Alexandra Hardy  8 Andrea Fossati  1   2   3   4 Erica J Stevenson  1   2   3   4 Ellie Sukerman  9 Tiffany Kim  5 Sudhir Penugonda  5 Elena Moreno  6   7   10   11 Hannes Braberg  2   3   4 Yuan Zhou  1   2   3   4 Giorgi Metreveli  6 Bhavya Harjai  1   2   3   4 Tia A Tummino  3   4   12   13 James E Melnyk  2   3   4 Margaret Soucheray  1   2   3   4 Jyoti Batra  1   2   3   4 Lars Pache  14 Laura Martin-Sancho  15   16 Jared Carlson-Stevermer  17   18 Alexander S Jureka  19   20 Christopher F Basler  6 Kevan M Shokat  2   3   4   21 Brian K Shoichet  3   4   12 Leah P Shriver  22   23 Jeffrey R Johnson  1   2   3   6 Megan L Shaw  6   24 Sumit K Chanda  15 Dan M Roden  25   26   27 Tonia C Carter  28 Leah C Kottyan  29   30   31 Rex L Chisholm  32 Jennifer A Pacheco  32 Maureen E Smith  32 Steven J Schrodi  33 Randy A Albrecht  6   7 Marco Vignuzzi  4   8 Lorena Zuliani-Alvarez  1   2   3   4 Danielle L Swaney  1   2   3   4 Manon Eckhardt  1   2   3   4 Steven M Wolinsky  5 Kris M White  4   6   7 Judd F Hultquist  34   35   36 Robyn M Kaake  37   38   39   40 Adolfo García-Sastre  41   42   43   44   45   46 Nevan J Krogan  47   48   49   50
Affiliations

Proteomic and genetic analyses of influenza A viruses identify pan-viral host targets

Kelsey M Haas et al. Nat Commun. .

Abstract

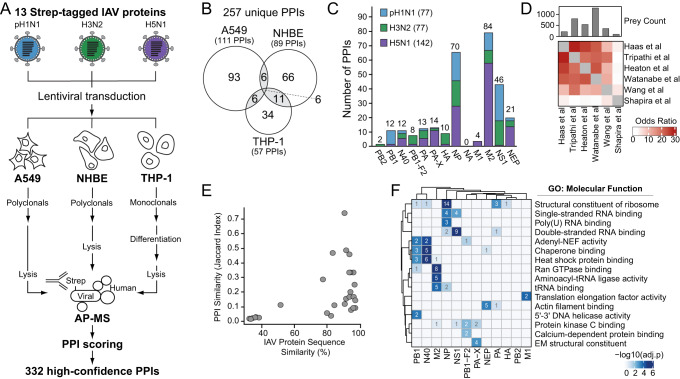
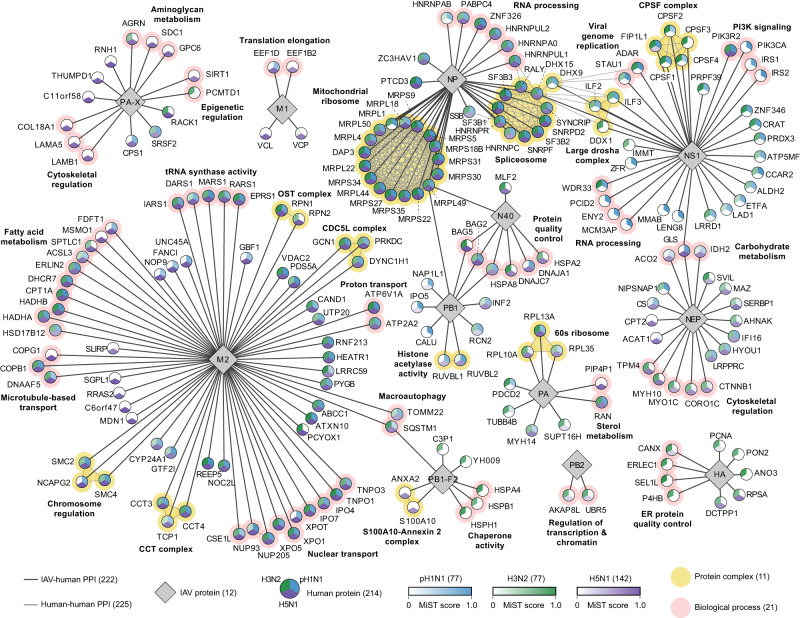
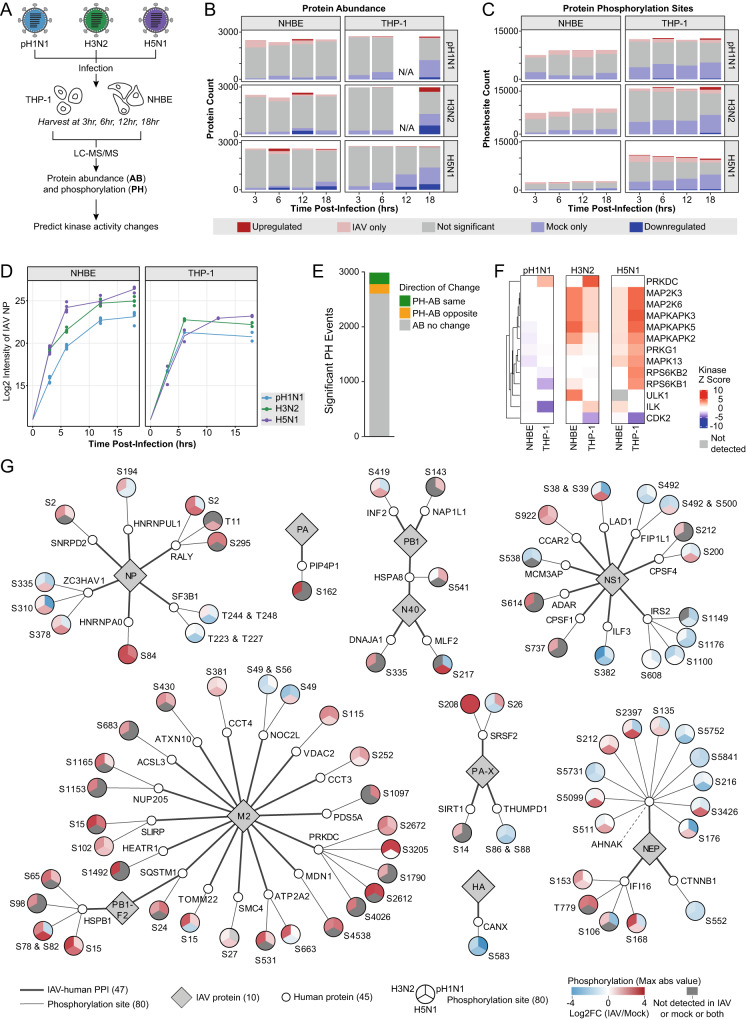
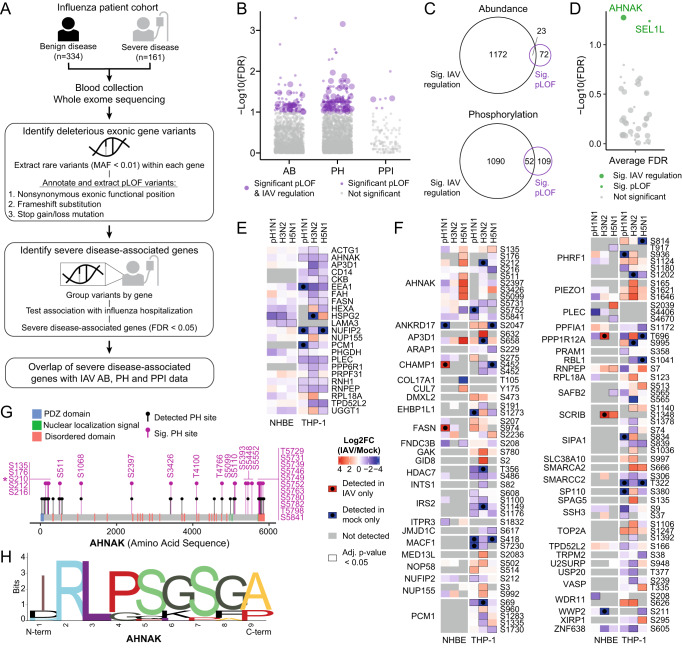
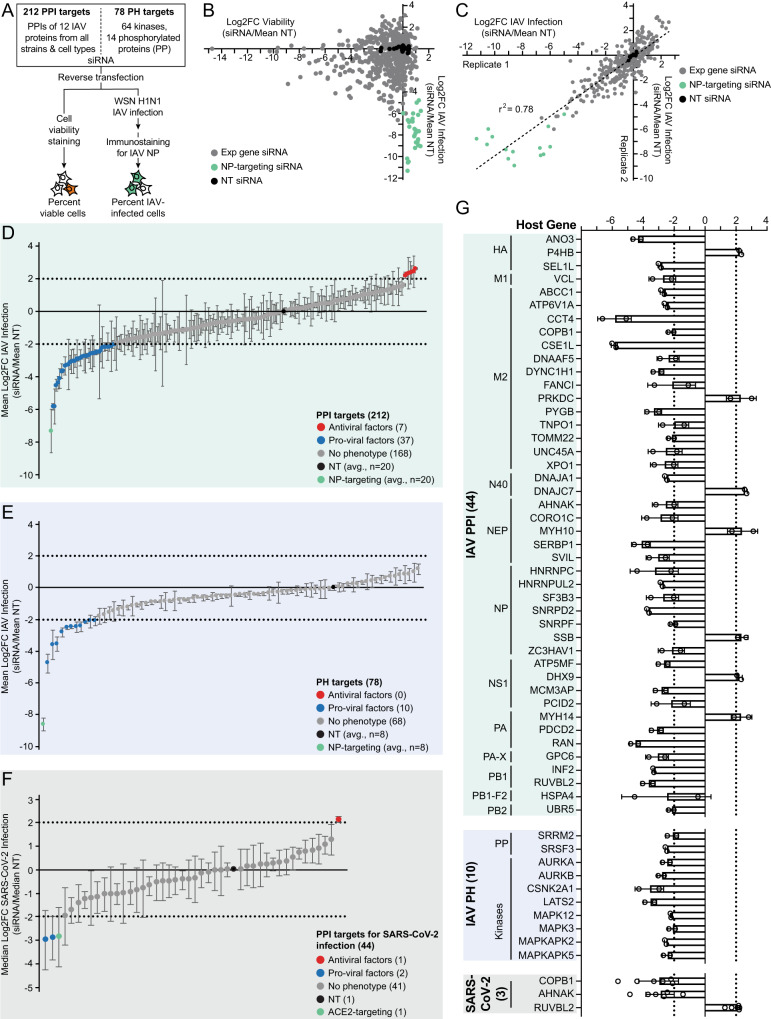
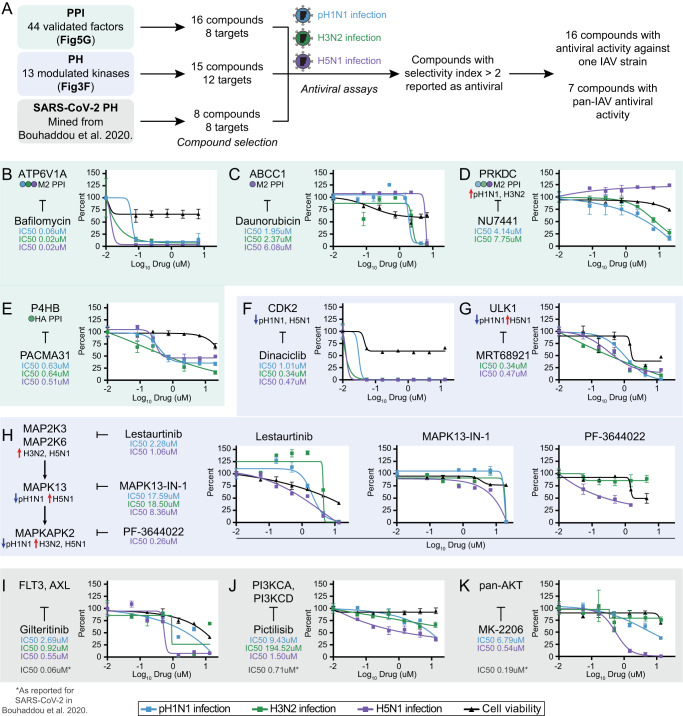
Influenza A Virus (IAV) is a recurring respiratory virus with limited availability of antiviral therapies. Understanding host proteins essential for IAV infection can identify targets for alternative host-directed therapies (HDTs). Using affinity purification-mass spectrometry and global phosphoproteomic and protein abundance analyses using three IAV strains (pH1N1, H3N2, H5N1) in three human cell types (A549, NHBE, THP-1), we map 332 IAV-human protein-protein interactions and identify 13 IAV-modulated kinases. Whole exome sequencing of patients who experienced severe influenza reveals several genes, including scaffold protein AHNAK, with predicted loss-of-function variants that are also identified in our proteomic analyses. Of our identified host factors, 54 significantly alter IAV infection upon siRNA knockdown, and two factors, AHNAK and coatomer subunit COPB1, are also essential for productive infection by SARS-CoV-2. Finally, 16 compounds targeting our identified host factors suppress IAV replication, with two targeting CDK2 and FLT3 showing pan-antiviral activity across influenza and coronavirus families. This study provides a comprehensive network model of IAV infection in human cells, identifying functional host targets for pan-viral HDT.


Conflict of interest statement

The Krogan Laboratory has received research support from Vir Biotechnology, F. Hoffmann-La Roche, and Rezo Therapeutics. N.J.K. has previously held financially compensated consulting agreements with the Icahn School of Medicine at Mount Sinai, New York and Twist Bioscience Corp. He currently has financially compensated consulting agreements with Maze Therapeutics, Interline Therapeutics, Rezo Therapeutics, and GEn1E Lifesciences, Inc. He is on the Board of Directors of Rezo Therapeutics and is a shareholder in Tenaya Therapeutics, Maze Therapeutics, Rezo Therapeutics, and Interline Therapeutics. The García-Sastre laboratory has received research support from Pfizer, Senhwa Biosciences, Kenall Manufacturing, Avimex, Johnson & Johnson, Dynavax, 7Hills Pharma, Pharmamar, ImmunityBio, Accurius, Nanocomposix, Hexamer, N-fold LLC, Model Medicines, Atea Pharma, Applied Biological Laboratories and Merck, outside of the reported work. A.G.-S. has consulting agreements for the following companies involving cash and/or stock: Vivaldi Biosciences, Contrafect, 7Hills Pharma, Avimex, Vaxalto, Pagoda, Accurius, Esperovax, Farmak, Applied Biological Laboratories, Pharmamar, Paratus, CureLab Oncology, CureLab Veterinary, Synairgen and Pfizer, outside of the reported work. A.G.-S. has been an invited speaker in meeting events organized by Seqirus, Janssen, Abbott and Astrazeneca. A.G.-S. is an inventor on patents and patent applications on the use of antivirals and vaccines for the treatment and prevention of virus infections and cancer, owned by the Icahn School of Medicine at Mount Sinai, New York, outside of the reported work. The Hultquist laboratory has received prior funding support from Gilead Sciences, and J.F.H. has a financially compensated consulting agreement with Merck. D.L.S. has a consulting agreement with Maze Therapeutics. M.B. is a financially compensated scientific advisor for GEn1E Life Sciences. K.M.S. has consulting agreements for the following companies involving cash and/or stock compensation: Black Diamond Therapeutics, BridGene Biosciences, Denali Therapeutics, Dice Molecules, eFFECTOR Therapeutics, Erasca, Genentech/Roche, Kumquat Biosciences, Kura Oncology, Merck, Mitokinin, Petra Pharma, Rezo Therapeutics, Revolution Medicines, Type6 Therapeutics, Vevo, Vicinitas and Wellspring Biosciences (Araxes Pharma). J.C.-S. is a former employee and stockholder of Synthego. While not directly relevant to this study, C.F.B. is a scientific advisor for Axion BioSystems, M.L.S. has a financially compensated consulting agreement with Calibr, and S.P. is employed by Roivant Sciences, Inc. S.P. also holds stock compensation from Roivant Sciences and AbbVie. The remaining authors declare no competing interests.

Figures

Fig. 1
Fig. 1. AP-MS identifies 332 pH1N1, H3N2 and H5N1 IAV-human PPIs.
A AP-MS experiment design. 13 2X-Strep-tagged proteins from pH1N1, H3N2 and H5N1 IAV were individually transduced by lentivirus to generate stable A549, NHBE and THP-1 cell lines. A549 and NHBE cells were cultured as polyclonal pools. THP-1 cells were cultured as monoclonal isolates and subsequently treated with Phorbol-12-myristate-13-acetate (PMA) to induce differentiation into a macrophage-like state. All cells were treated with doxycycline to induce IAV protein expression for 24 hours and subsequently lysed. Affinity-purified IAV proteins and co-purified human proteins were identified by MS and scored to assign interaction confidence. B Venn diagram of unique IAV-human PPIs identified in each cell type. The total 332 high-confidence PPIs were unified across virus strains, resulting in 257 unique PPIs by cell type and 29 PPIs that are shared in at least two of the three cell types (grey shading). C Bar graph of the unique IAV-human PPIs identified for each IAV protein and strain. PPI numbers reported are unified across cell types. D Identification correlation matrix comparing the human interacting proteins identified by AP-MS in this study with other published studies that used AP-MS with affinity-tagged IAV proteins exogenously expressed in cell lines,, AP-MS in the context of virus infection,, and an orthologous yeast two-hybrid approach. E Comparison of shared protein interactions (PPI similarity) by Jaccard index against IAV protein sequence similarity. PPIs reported are unified across cell types. F Heatmap of gene ontology (GO) molecular function enrichments among the human interacting proteins of indicated IAV proteins, unified across all strains and cell types and clustered by correlation of enrichment profiles. GO terms were curated from the top 3 non-redundant terms with at least 2 genes for at least one IAV protein. Increasing shading intensity reflects increasing significance of the enrichment term. Number of proteins per enriched cluster are shown in white if significant (adjusted p-value < 0.002; one-sided Fisher’s exact test), and grey if not significant (adjusted p-value > 0.002; one-sided Fisher’s exact test).
Fig. 2
Fig. 2. IAV PPI networks from three cell types identify strain-specific and pan-IAV-human interactions.
High-confidence IAV-human PPIs between 12 IAV proteins (grey diamonds) and 214 human proteins (circular nodes) identified from three IAV strains unified across the three cell types. Human protein nodes are split into three sections and colored by the IAV strain for which the interaction was identified: pH1N1 (blue), H3N2 (green) and H5N1 (purple). Color shading is proportional to MiST PPI confidence score (scale at bottom; not identified represented by white color), enabling visualization of high-confidence interactions that scored above our MiST score thresholds and interactions with additional IAV strain(s) detected in our AP-MS data that fell below our MiST score thresholds. For PPIs that are shared between multiple IAV proteins or cell types, the maximum MiST score from either IAV protein or cell type is reported in the network for each strain. IAV-human PPIs are depicted (dark grey lines), and human-human PPIs are identified (light grey lines) as curated in the CORUM database. Human protein complexes (yellow halo) are labeled as described in CORUM, and biological processes (pink halo) are labeled as described by GO terms.
Fig. 3
Fig. 3. Global proteomic profiling highlights 13 modulated kinases in IAV infection.
A Experimental design workflow for global proteomic profiling of protein abundance (AB) and phosphorylation (PH) changes in NHBE and PMA-differentiated THP-1 cells infected in biological duplicate with pH1N1, H3N2 or H5N1 IAV (MOI 2, four time points post-infection with time-matched mocks). BD AB data are not available (N/A) for pH1N1 and H3N2 IAV at the 12-hour time point in THP-1 cells, as these samples did not pass MS quality control. Bar chart plotting the total number of (B) proteins from the AB dataset and (C) phosphorylation sites from the PH dataset quantified at each time point (light red=significantly increased; light blue=significantly decreased; dark red=only detected in IAV infection; dark blue=only detected in mock infection; grey=no significant change). D Log2 intensity of IAV NP AB detected over the time course of pH1N1, H3N2 and H5N1 IAV infection in NHBE and THP-1 cells. EG All represented data corresponds to 18 hours (pH1N1, H3N2) and 12 hours (H5N1) post-IAV infection. E Correlation of the PH and AB data for all peptides where significant changes in both protein PH and AB could be measured (green=PH-AB change in the same direction; yellow=PH-AB change in the opposite direction; grey=no significant AB changes). Correlation data is represented as a total across all virus strains and cell types. F Heatmap of predicted kinase activity (kinase Z score) with FDR < 0.05 from IAV-infected NHBE and THP-1 cells (red=increased activity; blue=decreased activity; grey=not detected). G IAV-human PPI map of 10 IAV proteins (grey diamonds) interacting with 45 human proteins (small white circles) that possess significantly changing phosphorylation sites (adjusted p-value < 0.05; two-sided t-test). Significantly changing phosphorylation sites (emanating large circular nodes) are stratified by IAV strain (pie sections) and colored by the maximum log2 fold change (log2FC) (IAV/mock; red=increase, blue=decrease, grey=not detected). Phosphorylation sites detected across multiple cell lines are represented by the maximum absolute value, non-infinite fold change.
Fig. 4
Fig. 4. Patient exome sequencing identifies gene variants encoding proteins that are regulated in AB and PH during IAV infection.
A Schematic representation of sample collection and data analysis for identifying genes with pLOF variants associated with severe influenza disease from an influenza patient cohort. Genes with pLOF variants plotted against the false discovery rate (-log10(FDR)) from the severe-disease association test for (B) each of the AB, PH and PPI datasets or (D) the average FDR across the three AB, PH, and PPI datasets (purple and green circles=genes with significant pLOF variants (FDR < 0.1); grey=genes with pLOF variants below threshold (FDR > 0.1); large circles=genes with significant protein AB or PH changes (adjusted p-value < 0.05; two-sided t-test); small circles=genes detected in AB or PH proteomic datasets with no significant changes). C Venn diagram of the overlap of proteomic datasets with significant changes in AB (top, left) or PH (bottom, left), and significant genes with pLOF variants (corresponds to the total number of purple circles in B). Heatmap of log2FC in infection vs mock (log2FC (IAV/Mock)) from NHBE and THP-1 cells at 18 hours (pH1N1, H3N2) and 12 hours (H5N1) post-IAV infection (reported in Supplementary Data 2) for (E) AB of 23 significantly changing proteins, and (F) PH of 52 changing phosphorylated proteins, that have significant pLOF variants (from the union in C) (red=increase, blue=decrease, grey=not detected; red box with black circle=only detected in IAV infection, blue box with black circle=only detected in mock infection; black box outline=significant change (adjusted p-value < 0.05; two-sided t-test)). G AHNAK phosphorylation sites detected and significantly changed in the PH data (black pins=detected no significant change; pink pins=significantly changed (adjusted p-value < 0.05; two-sided t-test); asterisk=AHNAK S210). H Multiple sequence alignment sequence LOGO (S210P/Q, middle) for phosphorylation disruption mutations in AHNAK created with WebLogo version 2.8.2 using motifs identified by pLOF analysis as likely to be loss of phosphorylation.
Fig. 5
Fig. 5. siRNA knockdown identifies 54 pro-viral and antiviral factors of IAV and SARS-CoV-2 infection.
A Arrayed siRNA screen approach in A549 cells reverse-transfected in n = 2 biologically independent samples with gene-targeting, non-targeting (NT) or IAV NP-targeting siRNA, and infected with Influenza A/WSN/1933 H1N1 (MOI 0.1, 24 hours). Cell viability (live-cell staining) and percent IAV infection (%NP-positive (%NP + ) cells; immunostaining for IAV NP) were quantified by flow cytometry. Correlation plots comparing: B the cell viability against IAV infection for each siRNA from each biological duplicate; or C the variation in IAV infection between the biological duplicates. Log2FC was calculated by normalizing %viable or %NP+ cells for each siRNA against the mean of multiple replicate-matched NT siRNA (siRNA/mean NT) (green dots=IAV NP-targeting siRNA, black dots=NT siRNA, grey dots=experimental gene-targeting siRNA). Distribution of log2FC in IAV infection for (D) 212 PPI targets and (E) 78 PH targets, plotted as the mean of n = 2 biologically independent samples per target. The log2FC in IAV infection was calculated for each siRNA against the mean replicate-matched NT siRNA (blue dots=pro-viral factors (mean log2FC < -2), red dots=antiviral factors (mean log2FC > 2), grey dots=no/weak phenotype; green dot=IAV NP-targeting siRNA; black dot=NT siRNA; error bars represent standard deviation). F Distribution of log2FC in SARS-CoV-2 infection for 44 IAV PPI targets plotted as the median of six replicates (n = 2 biologically independent samples, each in n = 3 technical replicates) per target. The log2FC in SARS-CoV-2 infection was calculated for each siRNA against a replicate-matched NT siRNA (blue dots=pro-viral factors (median log2FC < -2), red dots=antiviral factors (median log2FC > 2), grey dots=no/weak phenotype; green dot=ACE2-targeting siRNA; black dot=NT siRNA; error bars represent median absolute deviations (MAD)). G Bar chart of pro-viral and antiviral factors for IAV and SARS-CoV-2 screens plotted as the mean log2FC in IAV infection (data re-plotted from D and E; error bars represent standard deviation) and the median log2FC in SARS-CoV-2 infection (data re-plotted from F; error bars represent MAD).
Fig. 6
Fig. 6. Host-directed compounds targeting IAV and SARS-CoV-2 host factors identify inhibitors of pH1N1, H3N2 and H5N1 IAV infection.
A Compounds targeting eight IAV PPI factors and 12 IAV-modulated kinases were manually curated by literature search and selected based on target specificity and drug availability. 8 kinase-targeting compounds with antiviral activity against SARS-CoV-2 were included. In total, 37 unique compounds were screened against pH1N1, H3N2 and H5N1 IAV infection. Compounds with selectivity index (SI) [CC50/IC50] > 2 were classified as having antiviral activity (Supplementary Data 5, see also Source Data). BK A549 cells were pre-treated with compound at the indicated doses (2 hr) and infected with pH1N1 (MOI 0.5), H3N2 (MOI 0.5) or H5N1 (MOI 0.05) IAV for 24 hr. Percent IAV-infected cells were quantified by immunostaining for IAV NP followed by high throughput imaging (blue line=pH1N1; green line=H3N2; purple line=H5N1). Percent alive cells were quantified by MTT assay in uninfected A549 cells (black line). Data points represent the mean across n = 3 biologically independent samples. Schematics mark the target with corresponding PPI or PH dataset and IAV strain, and the corresponding compound (at left). Compounds are annotated with IC50 values for IAV strains in which SI > 2. Error bars represent standard error of mean (SEM). BD Dose-response curves for M2 PPI-targeting compounds, including: ATP6V1A-targeting compound bafilomycin A1; ABCC1-targeting compound daunorubicin; and PRKDC-targeting compound NU7441. PRKDC is also a kinase identified in the IAV PH data. E Dose-response curve for HA PPI P4HB-targeting compound PACMA31. FG Dose-response curves for PH kinase-targeting compounds, including: CDK2-targeting compound dinaciclib; and ULK1-targeting compound MRT68921. H Dose-response curves for members of the MAPK pathway (pathway schematic at left), including MAP2K3, MAP2K6, MAPK13 and MAPKAPK2, each annotated with corresponding compounds. PF-3644022 was not tested against pH1N1. IK Dose-response curves for SARS-CoV-2-mined antiviral compounds targeting three kinase pathways: FLT3 and AXL targeted by gilteritinib; PI3KCA and PI3KCD targeted by pictilisib; and AKT1, AKT2 and AKT3 (pan-AKT) targeted by MK-2206. SARS-CoV-2 IC50 values are included as previously reported, where SARS-CoV-2 infection was quantified by RT-qPCR of SARS-CoV-2 N protein in compound-treated A549-ACE2 cells.

References

    1. Putri WCWS, Muscatello DJ, Stockwell MS, Newall AT. Economic burden of seasonal influenza in the United States. Vaccine. 2018;36:3960–3966. - PubMed
    1. Tokars JI, Olsen SJ, Reed C. Seasonal Incidence of Symptomatic Influenza in the United States. Clin. Infect. Dis. 2018;66:1511–1518. - PMC - PubMed
    1. Kelly H, et al. The age-specific cumulative incidence of infection with pandemic influenza H1N1 2009 was similar in various countries prior to vaccination. PLoS One. 2011;6:e21828. - PMC - PubMed
    1. Dawood FS, et al. Estimated global mortality associated with the first 12 months of 2009 pandemic influenza A H1N1 virus circulation: a modelling study. Lancet Infect. Dis. 2012;12:687–695. - PubMed
    1. Centers for Disease Control and Prevention (CDC Update: influenza activity--United States, 2003-04 season. MMWR Morb. Mortal. Wkly. Rep. 2004;53:284–287. - PubMed

Publication types

Substances