. 2023 Sep 27;14(1):6039.
doi: 10.1038/s41467-023-41621-y.

Lung extracellular matrix modulates KRT5+ basal cell activity in pulmonary fibrosis

Affiliations

Lung extracellular matrix modulates KRT5+ basal cell activity in pulmonary fibrosis

Richard J Hewitt et al. Nat Commun. .

Abstract

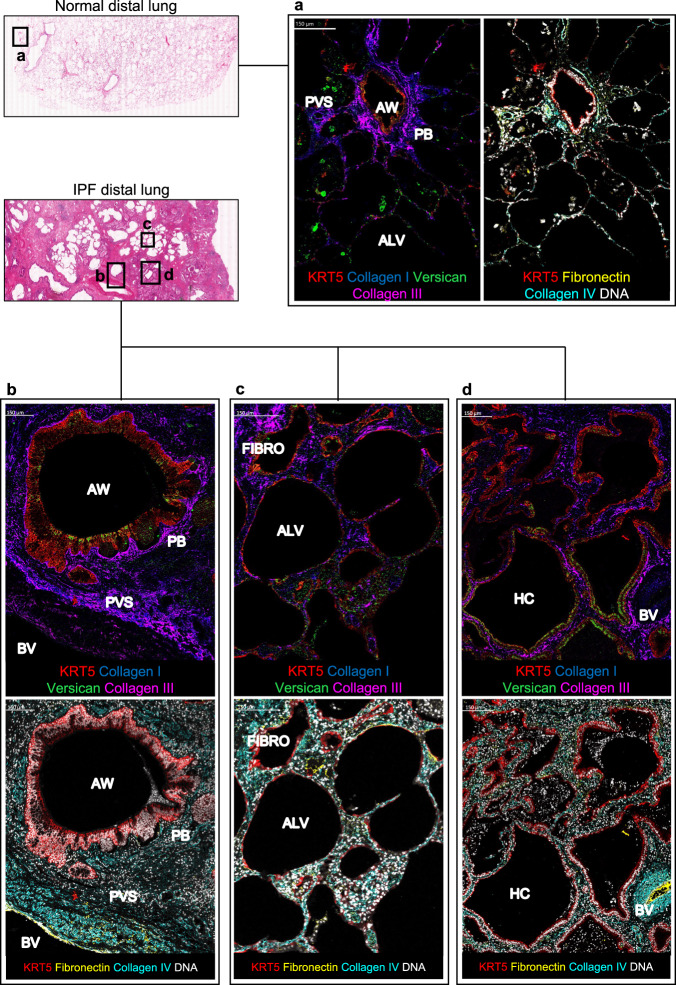
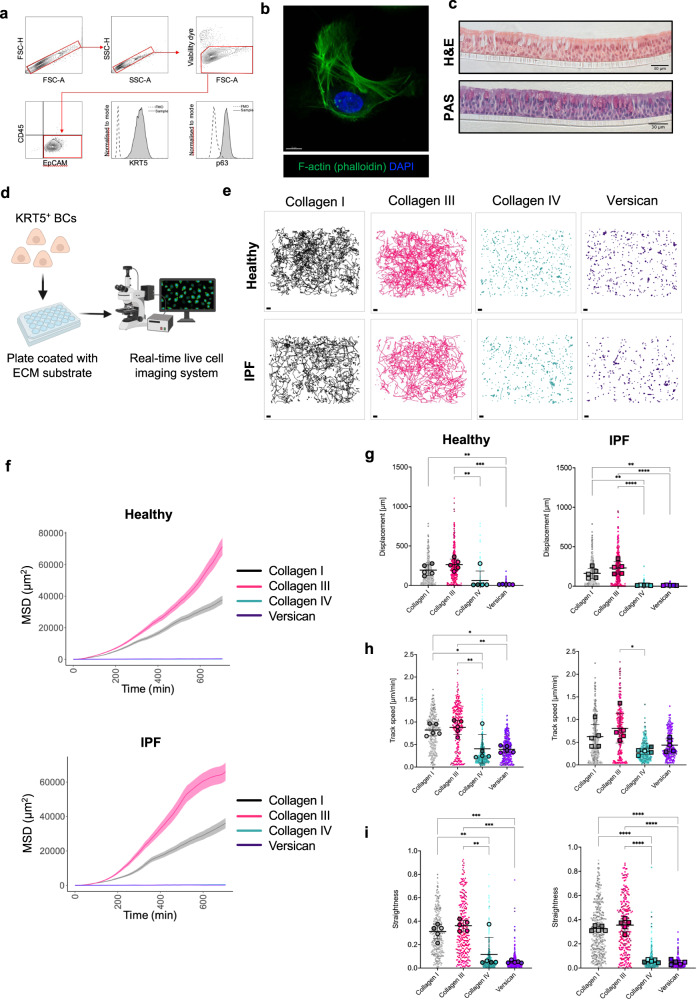
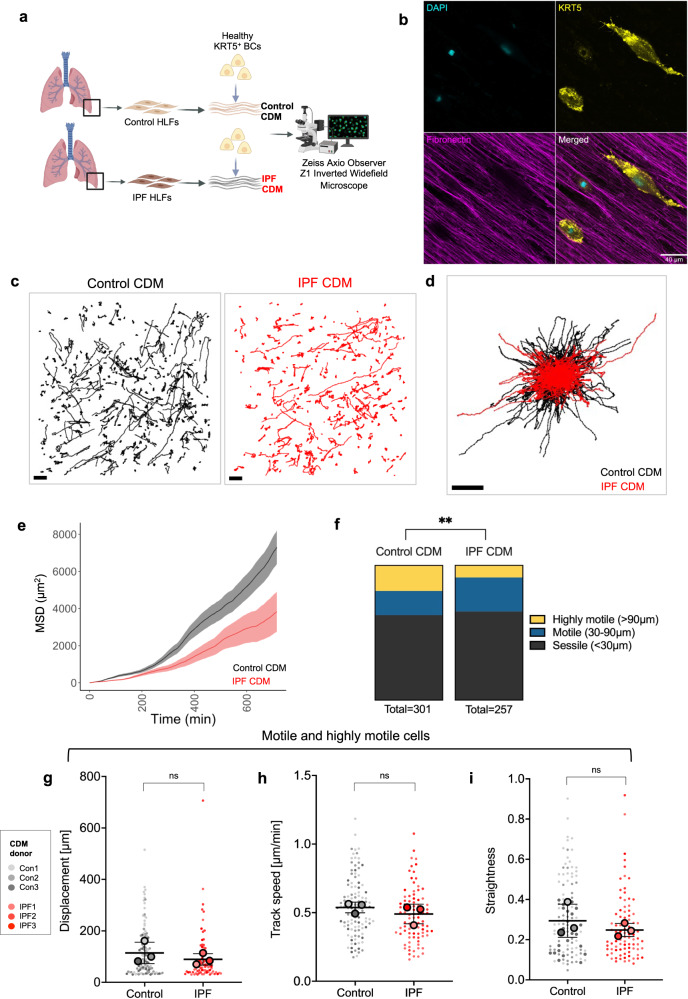
Aberrant expansion of KRT5+ basal cells in the distal lung accompanies progressive alveolar epithelial cell loss and tissue remodelling during fibrogenesis in idiopathic pulmonary fibrosis (IPF). The mechanisms determining activity of KRT5+ cells in IPF have not been delineated. Here, we reveal a potential mechanism by which KRT5+ cells migrate within the fibrotic lung, navigating regional differences in collagen topography. In vitro, KRT5+ cell migratory characteristics and expression of remodelling genes are modulated by extracellular matrix (ECM) composition and organisation. Mass spectrometry- based proteomics revealed compositional differences in ECM components secreted by primary human lung fibroblasts (HLF) from IPF patients compared to controls. Over-expression of ECM glycoprotein, Secreted Protein Acidic and Cysteine Rich (SPARC) in the IPF HLF matrix restricts KRT5+ cell migration in vitro. Together, our findings demonstrate how changes to the ECM in IPF directly influence KRT5+ cell behaviour and function contributing to remodelling events in the fibrotic niche.


Conflict of interest statement

R.J.H. received, unrelated to the submitted work, consultancy fees from Boehringer Ingelheim. P.L.M. received, unrelated to the submitted work, industry-academic funding from AstraZeneca via his institution and speaker and consultancy fees from Boehringer Ingelheim Trevi and Hoffman-La Roche. A.J.B. received, unrelated to the submitted work, consultancy fees and/or industry/academic funding from Ammax, Devpro, and Ionis pharmaceuticals, via his institution. A.G.N. is or has been a scientific advisor relating to IPF trials for Medical Quantitative Image Analysis, Galapagos, Boehringer Ingelheim and Roche, as well as receiving payment for educational activities relating to interstitial lung disease from Boehringer Ingelheim and UpToDate. T.M.M. received, unrelated to the submitted work, consultancy fees in relation to pulmonary fibrosis from Abbvie, Agomab, Apellis, Astra Zeneca, Bayer, Biogen Idec, Blade Therapeutics, BMS, Boehringer Ingelheim, Bridge Therapeutics, Carthronix, Chieisi, CohBar, CSLBehring, Daewoong, Daiatchi, DevPro, Endeavor, Fibrogen, Galapagos, Galecto, GlaxoSmithKline, Insilico, IQVIA, Kinevent, Pliant, Pfizer, Puretech, Qureight, Redx, Remedy Cell, Respivant Sciences, Roche, Shinogi, Surrozen, Theravance, Three Lakes Partners, Trevi, UCB, United Therapeutics, Veracyte, Vicore. The remaining authors declare no competing interests.

Figures

Fig. 1
Fig. 1. Distinct regional collagen organisation in the fibrotic lung influences KRT5+ BC distribution.
a Lung tissue sections from control (n = 5) and IPF (n = 8) donors were imaged using a ZEISS 880 2-photon microscope with spectral detection, and linear unmixing of autofluorescence and second harmonic generation (SHG) signals. Schematic created with BioRender.com. Representative images of distal lung tissue from b control (n = 5), and c IPF (n = 8) donors with overview (upper panels) and regions quantitively analysed (lower panels). White arrows marking single KRT5+ BCs within IPF matrix in c. Regions included alveolar (ALV), honeycomb cyst (HC), fibrotic (FIBRO), airway (AW), peribronchial (PB) and perivascular (PVS). d KRT5+ BCs counted per image area; each data point represents the average of 2–6 images per area per control (n = 4) and IPF patient (n = 8 for PB, PVS, ALV, FIBRO and n = 6 for HC). Data plotted as mean ± SEM. e Principal component analysis (PCA) of collagen intensity, density, orientation and GLCM parameters for each region for controls (CTRL) vs. IPF patients. Quantitative image analysis per region showing f collagen density (Control PB vs. Control ALV, P value = 0.0007; IPF PB vs. IPF PVS, P value = 0.0017; IPF PB vs. IPF FIBRO, P value = 0.020; IPF PB vs. IPF ALV, P value < 0.0001; IPF ALV vs. IPF HC P = 0.0295) g coherency (IPF PB vs. IPF FIBRO, P value = 0.0044; IPF PB vs. IPF PVS, P value = 0.0012) and h entropy (Control PVS vs. Control ALV, P value = 0.0011; IPF PVS vs. IPF HC, P value = 0.0386; IPF PVS vs. IPF ALV, P value = 0.0034; IPF ALV vs. IPF FIBRO, P value < 0.0001, IPF FIBRO vs. IPF HC, P value = 0.0018). Each data point represents the average of 2–6 images per area per control (n = 5) and IPF patient (n = 8 for PB, PVS, ALV, FIBRO and n = 6 for HC). Data plotted as mean ± SEM. Ordinary one-way ANOVA with Tukey’s multiple comparisons test ****P < 0.0001, ***P < 0.001, **P < 0.01, *P < 0.05. Spearman correlation analysis between i collagen density and KRT5+ BC numbers and j collagen coherency and KRT5+ BC numbers in distal lung tissue from IPF patients. Each data point represents the average of 2–6 images per area per IPF patient (n = 8 for PB, PVS, ALV, FIBRO and n = 6 for HC). Two-tailed P value reported. Linear regression of correlation analysis with best- fit line and 95% confidence bands shown. Source data are provided as a Source Data file.
Fig. 2
Fig. 2. ECM landscape of normal and fibrotic lung revealed by high-dimensional imaging mass cytometry.
a Imaging mass cytometry (IMC) of distal lung tissue from normal control (n = 1, H&E overview shown). Left panel; distribution of ECM components; collagen I (blue), collagen III (magenta) and versican (green). Right panel; fibronectin (yellow) and collagen IV (turquoise) in relation to KRT5+ BCs (red) and nuclear DNA marker (white). Representative image demonstrating key regions; airway (AW), peribronchial (PB) and alveolar (ALV). bd IMC of distal lung tissue from a patient with IPF (n = 1, H&E overview shown) showing distinct regions; b peribronchial and perivascular space (PVS), c alveolar and fibrotic interstitium (FIBRO), and d honeycomb cyst (HC). Upper panel; collagen I (blue), collagen III (magenta), versican (green) and KRT5+ BCs (red). Lower panel; fibronectin (yellow), collagen IV (turquoise), KRT5+ BCs (red) and nuclear DNA marker (white). Scale bar, 150 μm.
Fig. 3
Fig. 3. KRT5+ BC migration is directly modulated by ECM proteins.
a Flow cytometry confirmed expression of airway BC markers KRT5 and p63 in primary airway epithelial cells in submerged culture (passage 3). b Representative Airyscan maximum intensity projection image of KRT5+ BC demonstrating normal BC morphology and cytoskeletal arrangement on collagen I (n = 1 healthy control, n = 1 IPF patient); F-actin phalloidin stain (green) and DAPI (blue). Scale bar, 10 μm. c Normal capacity of BCs to undergo mucociliary differentiation shown here with representative H&E (c, upper) and PAS (c, lower) stained sections of agarose embedded air-liquid interface (ALI) cultures (n = 1 healthy control, n = 1 IPF patient, in duplicate). d Schematic of cell migration experimental design. Created with BioRender.com. e Individual cell track trajectories from all healthy (e, upper panels) and IPF (e, lower panels) donors plotted according to ECM ligand. Scale bars, 100 μm. f mean square displacement (MSD) of all KRT5+ BC tracks per ECM ligand (mean ± SEM). gi Beeswarm SuperPlots showing migration data for KRT5+ BCs from healthy controls (n = 5) and patients with IPF (n = 5) cultured on collagen I (grey), collagen III (magenta), collagen IV (green) and versican (purple); g displacement over 12 h (healthy on collagen I vs. versican, P value = 0.0093; healthy on collagen III vs. versican, P value = 0.0005; healthy on collagen III vs. collagen IV, P value = 0.0040; IPF on collagen I vs. versican, P value = 0.001; IPF on collagen I vs. collagen IV, P value = 0.0014; IPF on collagen III vs. versican, P value < 0.0001; IPF on collagen III vs. collagen IV, P value < 0.0001). h mean track speed (healthy on collagen I vs. versican, P value = 0.0132; healthy on collagen I vs. collagen IV, P value = 0.0164; healthy on collagen III vs. versican, P value = 0.0049; healthy on collagen III vs. collagen IV, P value = 0.0061; IPF on collagen III vs. collagen IV, P value = 0.0122) and i straightness ratio (healthy on collagen I vs. versican, P value = 0.0007; healthy on collagen I vs. collagen IV, P value = 0.0083; healthy on collagen III vs. versican, P value = 0.0001; healthy on collagen III vs. collagen IV, P value = 0.0012; IPF on collagen I vs. versican, P value < 0.0001; IPF on collagen I vs. collagen IV, P value < 0.0001, IPF on collagen III vs. versican, P value < 0.0001, IPF on collagen III vs. collagen IV, P value < 0.0001). Each small dot (healthy) or square (IPF) represents cell-level data which is colour coded according to biological replicate. The larger circles (healthy) and squares (IPF) represent the mean value per biological replicate. Summary statistics with mean and standard deviation are superimposed on the plot. Sample-level means compared using a one-way ANOVA with Tukey’s multiple comparison test, ****P < 0.0001, **P < 0.01, *P < 0.05. Source data are provided as a Source Data file.
Fig. 4
Fig. 4. Interaction with a 3D cell-derived matrix induces gene expression changes in migratory KRT5+ BCs.
a Schematic of experimental design for KRT5+ BC migration on CDM. Created with BioRender.com. b Images showing generation of CDM from primary HLFs (n = 1, in duplicate) b,i pre- and b,ii-iii post- decellularization; F-actin (phalloidin, green), DAPI (blue), collagen I (red) and fibronectin (purple). c Individual cell track trajectories from healthy n = 4 (black) or IPF n = 4 (red) KRT5+ BCs plotted from centroid; Scale bar, 100 μm. d Mean square displacement of all healthy KRT5+ BCs (black) vs. IPF KRT5+ BCs (red) on IPF CDMs (mean ± SEM). Beeswarm SuperPlot showing e displacement over 12 h, f mean track speed, and g straightness ratio for KRT5+ cells from healthy controls (n = 4, ≥2 replicates per donor) and IPF patients (n = 4, ≥2 replicates per donor) tracked over IPF HLF CDM. Each small dot represents cell-level data which is colour coded according to biological replicate. The larger circles represent the mean value per biological replicate. Summary statistics with mean and standard deviation are superimposed on the plot. Sample-level means compared using a one-way ANOVA with Tukey’s multiple comparison test. h Schematic of experimental design to assess gene expression changes induced by culture of healthy (n = 3) or IPF (n = 3) KRT5+ BCs on collagen I (2D) vs. IPF CDM (3D). i Principal component analysis of gene array data; unit variance scaling was applied to rows; SVD with imputation was used to calculate principal components. Prediction ellipses are such that with probability 0.95, a new observation from the same group will fall inside the ellipse. j Heatmap with hierarchical clustering of normalised gene expression. Rows and columns using correlation distance and average linkage. Rows are centred and unit variance scaling is applied. k Volcano plots showing gene expression changes when healthy (left) or IPF (right) KRT5+ BCs were cultured on IPF CDM vs. collagen I. Upregulated genes (red), downregulated genes (blue). Significance defined as log fold change >2 or <2, P < 0.05. P values were calculated based on a Student’s t test of the replicate normalised gene expression values (2^(- Delta CT)) for each gene in control and test groups. The P value calculation was based on parametric, unpaired, two-sample equal variance, two-tailed distribution. Housekeeping genes used - ACTB, B2M and RPLP0. Source data are provided as a Source Data file.
Fig. 5
Fig. 5. IPF fibroblast-derived matrix restricts KRT5+ BC migration.
a Schematic of experimental design for KRT5+ BC migration on CDM from control or IPF HLFs. Created with BioRender.com. b Images showing KRT5+ BC interacting with fibronectin fibres; KRT5 (yellow), DAPI (turquoise) and fibronectin (purple). c Individual cell track trajectories for all healthy KRT5+ cells on n = 3 control CDMs (black) or n = 3 IPF CDMs (red); Scale bar, 100 μm. d Cell track trajectories plotted from centroid; Scale bar, 100 μm. e Mean square displacement (MSD) over time of all healthy KRT5+ BCs on n = 3 control (black) on n = 3 IPF (red) CDMs (mean ± SEM). f Contingency analysis of cell proportions according to displacement distance for CDM type, **P value = 0.0013, calculated using a Chi-squared test. gi Beeswarm SuperPlots showing g displacement over 12 h, h mean track speed, and i straightness ratio for motile and highly motile KRT5+ BCs from healthy controls tracked over CDMs from control (n = 3, ≥2 replicates per donor) or IPF HLFs (n = 3, ≥2 replicates per donor). Each small dot represents cell-level data which is colour coded according to biological replicate. The larger circles represent the mean value per biological replicate. Summary statistics with mean and standard deviation are superimposed on the plot. Sample-level means compared using a one-way ANOVA with Tukey’s multiple comparison test. Source data are provided as a Source Data file.
Fig. 6
Fig. 6. IPF fibroblast-derived matrix has a distinct matrisome.
a Schematic of experimental design for MS-proteomics of CDMs from control (n = 3 in duplicate) and IPF (n = 3 in duplicate) HLFs. Created with BioRender.com. b GO Biological Pathways using DAVID v6.8 functional annotation tool for 154 matrisome proteins identified in CDMs (one-sided Fisher’s exact test, Benjamini–Hochberg adjusted P value). c Radar plot of protein abundance according to matrisome categories identified in control (black) and IPF (red) CDMs. d PCA of 154 matrisome proteins identified in control and IPF CDMs. Unit variance scaling is applied to rows; SVD with imputation is used to calculate principal components. Prediction ellipses are such that with probability 0.95, a new observation from the same group will fall inside the ellipse. e Heatmap with hierarchical clustering of normalised abundance of each protein identified. Rows and columns using correlation distance and average linkage. Rows are centred and unit variance scaling is applied. f Volcano plot showing significant differentially expressed proteins between IPF CDMs and control CDMs, upregulated proteins (red), downregulated proteins (blue). One-way ANOVA, Benjamini–Hochberg adjusted P value, significance defined as a fold change >2 or <2, P < 0.05. g Venn diagram showing shared GO biological processes for significantly differentially expressed proteins. h Protein-protein interaction network using STRING v11 using matrisome proteins with an abundance ratio >2 or <2, P < 0.05. Source data are provided as a Source Data file.
Fig. 7
Fig. 7. SPARC restricts KRT5+ BC migration.
a Individual cell track trajectories for healthy KRT5+ BCs on collagen I (blue) or collagen I and SPARC (green), Scale bar, 100 μm b Cell tracks plotted from centroid; Scale bar, 100 μm. c Mean square displacement (MSD) over time of all healthy KRT5+ BCs on collagen I (blue) or collagen I and SPARC (green) (mean ± SEM). df Beeswarm SuperPlots showing migration data for KRT5+ BCs from healthy controls (n = 6, in triplicate) cultured in wells with no coating (magenta), collagen I (blue) or collagen I plus SPARC 20 µg/ml (green); d displacement over 12 h (BCs on no coating vs. collagen I, P value = 0.0021; BCs on collagen I vs. collagen I plus SPARC, P value = 0.0205), e mean track speed (BCs on no coating vs. collagen I plus SPARC, P value = 0.0166), and f straightness ratio (BCs on no coating vs. collagen I, P value < 0.0001; BCs on no coating vs. collagen I plus SPARC, P value = 0.0132; BCs on collagen I vs. collagen I plus SPARC, P value = 0.0108). Each small dot represents cell-level data which is colour coded according to biological replicate. The larger circles represent the mean value per biological replicate. Summary statistics with mean and standard deviation are superimposed on the plot. Sample-level means compared using a one-way ANOVA with Tukey’s multiple comparison test, ****P < 0.0001, **P < 0.01, *P < 0.05. Source data are provided as a Source Data file.

References

    1. Adams TS, et al. Single-cell RNA-seq reveals ectopic and aberrant lung-resident cell populations in idiopathic pulmonary fibrosis. Sci. Adv. 2020;6:eaba1983. doi: 10.1126/sciadv.aba1983. - DOI - PMC - PubMed
    1. Habermann AC, et al. Single-cell RNA sequencing reveals profibrotic roles of distinct epithelial and mesenchymal lineages in pulmonary fibrosis. Sci. Adv. 2020;6:eaba1972. doi: 10.1126/sciadv.aba1972. - DOI - PMC - PubMed
    1. Reyfman, P. A. et al. Single-cell transcriptomic analysis of human lung provides insights into the pathobiology of pulmonary fibrosis. Am. J. Respir. Crit. Care Med.199, 1517–1536 (2019). - PMC - PubMed
    1. Seibold MA, et al. The idiopathic pulmonary fibrosis honeycomb cyst contains a mucocilary pseudostratified epithelium. PloS One. 2013;8:e58658. doi: 10.1371/journal.pone.0058658. - DOI - PMC - PubMed
    1. Plantier L, et al. Ectopic respiratory epithelial cell differentiation in bronchiolised distal airspaces in idiopathic pulmonary fibrosis. Thorax. 2011;66:651–657. doi: 10.1136/thx.2010.151555. - DOI - PubMed

Publication types