. 2023 Sep 27;14(1):6015.
doi: 10.1038/s41467-023-41448-7.

FEAST: A flow cytometry-based toolkit for interrogating microglial engulfment of synaptic and myelin proteins

Affiliations

FEAST: A flow cytometry-based toolkit for interrogating microglial engulfment of synaptic and myelin proteins

Lasse Dissing-Olesen et al. Nat Commun. .

Abstract

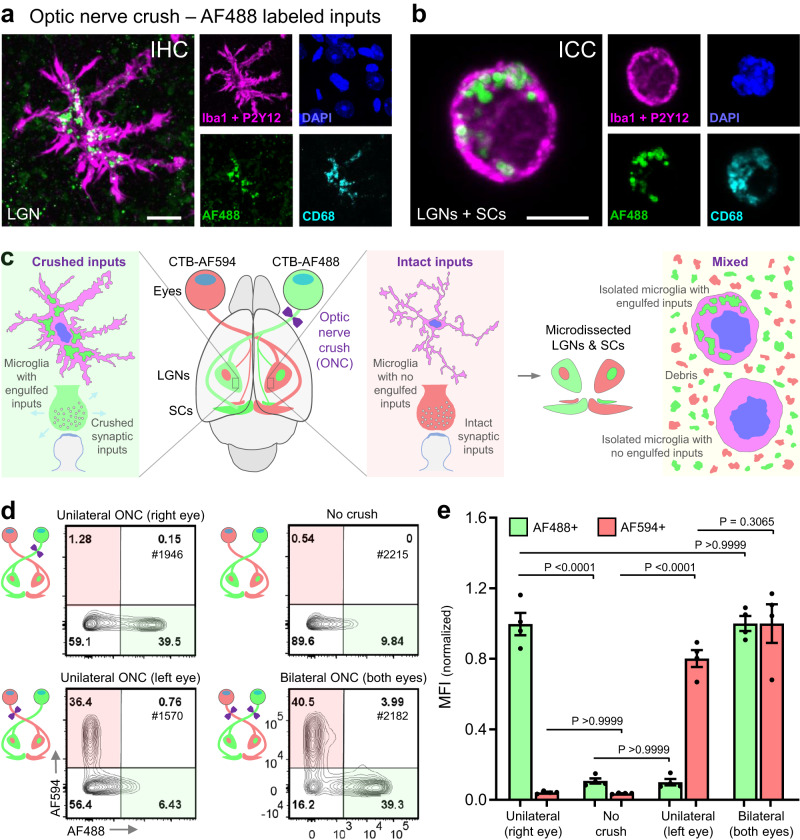
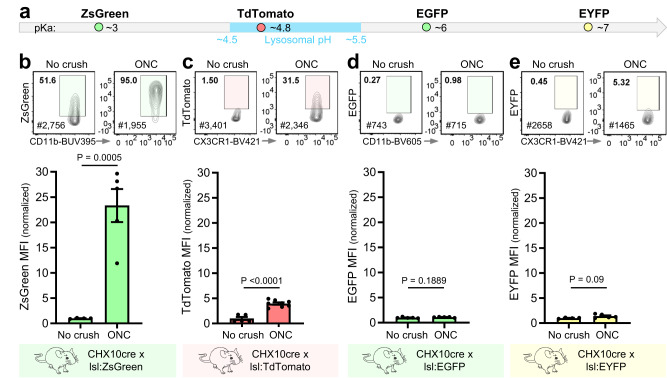
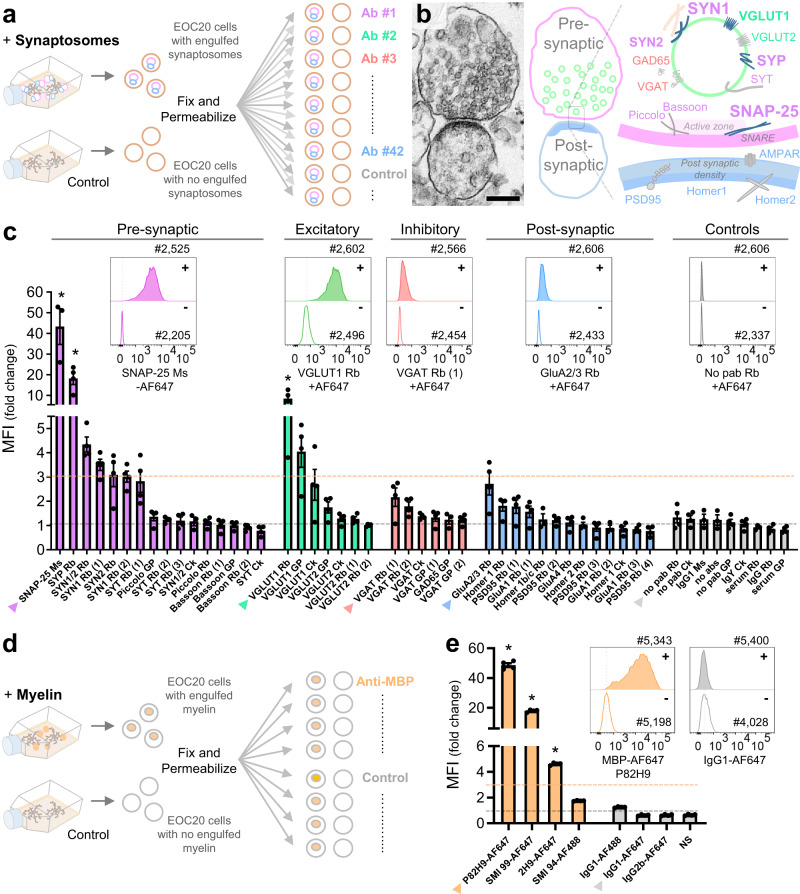
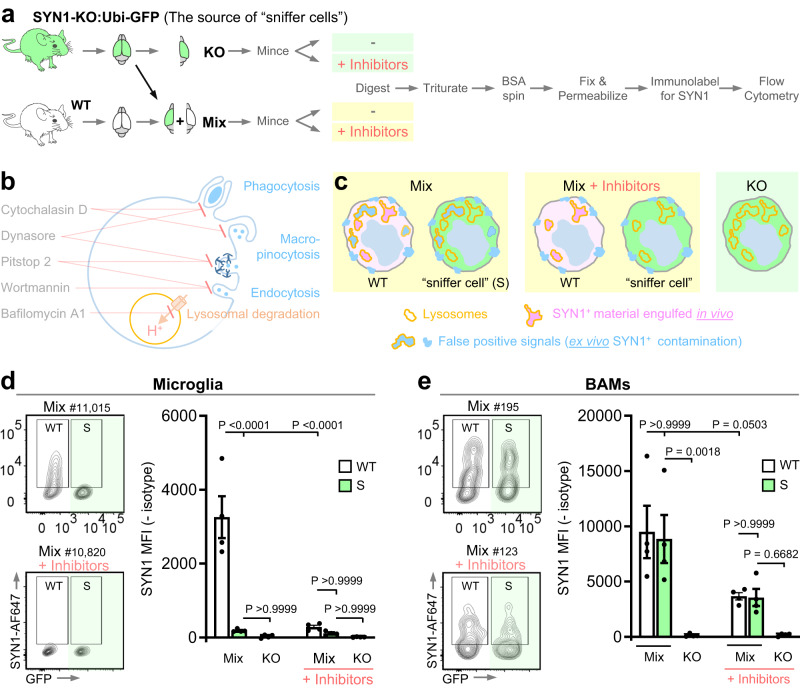
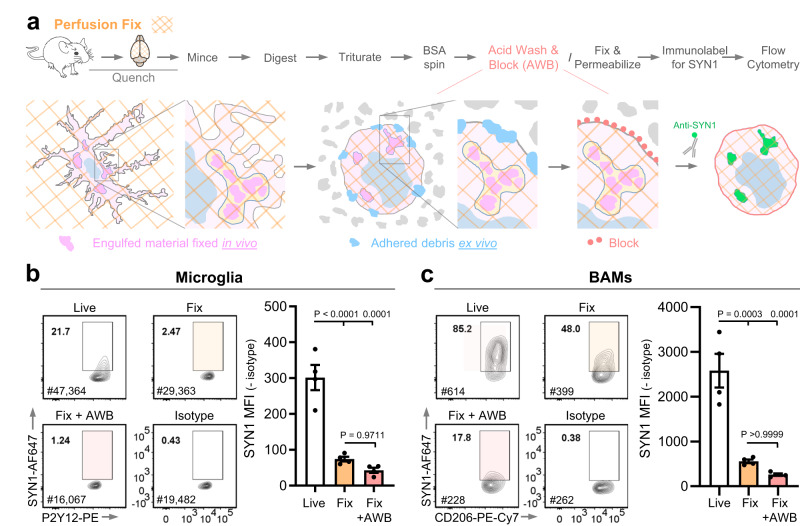
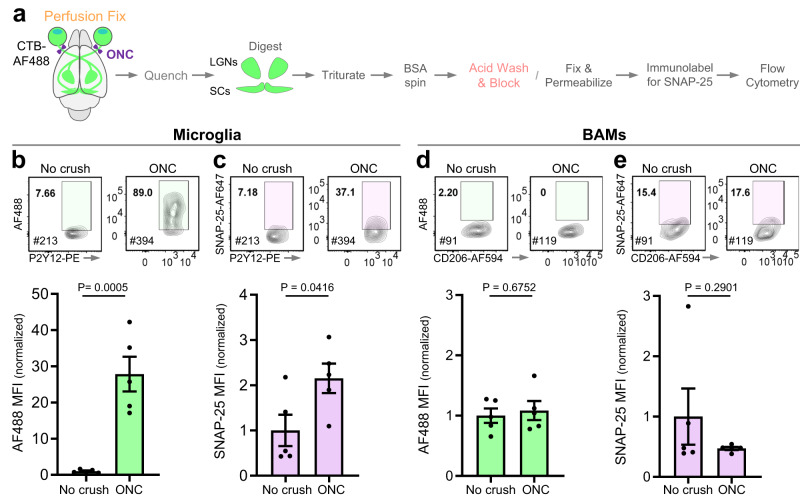
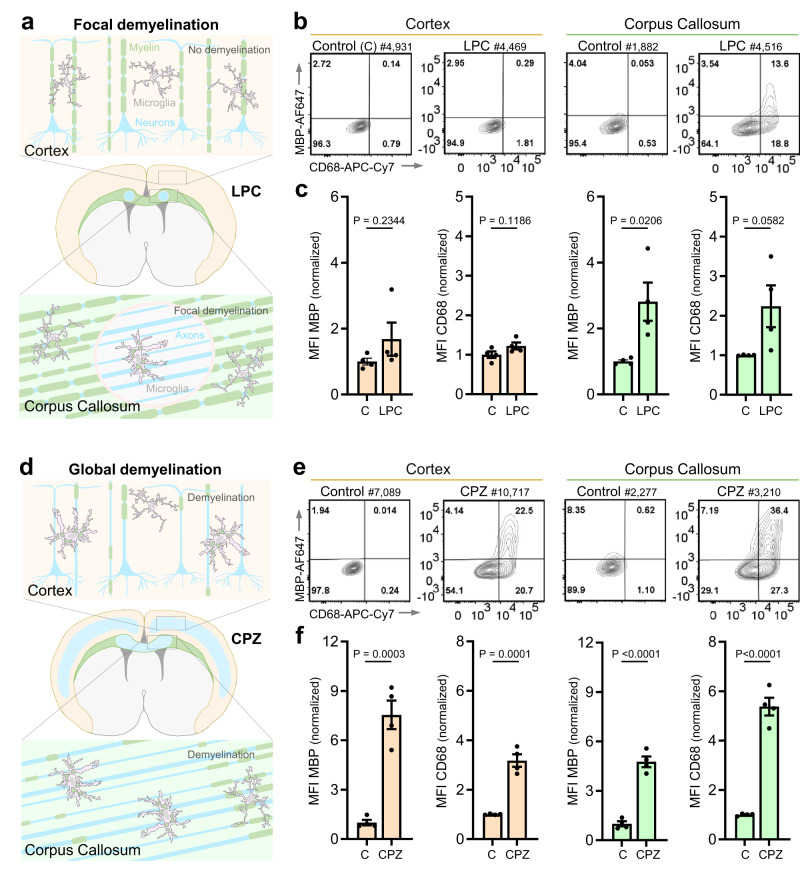
Although engulfment is a hallmark of microglia function, fully validated platforms that facilitate high-throughput quantification of this process are lacking. Here, we present FEAST (Flow cytometric Engulfment Assay for Specific Target proteins), which enables interrogation of in vivo engulfment of synaptic material by brain resident macrophages at single-cell resolution. We optimize FEAST for two different analyses: quantification of fluorescent material inside live cells and of engulfed endogenous proteins within fixed cells. To overcome false-positive engulfment signals, we introduce an approach suitable for interrogating engulfment in microglia from perfusion-fixed tissue. As a proof-of-concept for the specificity and versatility of FEAST, we examine the engulfment of synaptic proteins after optic nerve crush and of myelin in two mouse models of demyelination (treatment with cuprizone and injections of lysolecithin). We find that microglia, but not brain-border associated macrophages, engulf in these contexts. Our work underscores how FEAST can be utilized to gain critical insight into functional neuro-immune interactions that shape development, homeostasis, and disease.


Conflict of interest statement

The authors declare no competing interests.

Figures

Fig. 1
Fig. 1. Microglia engulfment of fluorescently labeled synaptic inputs following optic nerve crush.
a Immunohistochemistry of a microglial cell in the lateral geniculate nucleus (LGN) following bilateral optic nerve crush (ONC) of Alexa Fluor 488 (AF488)-labeled retinal ganglion cell (RGC) inputs. Microglia - IBA-1 and P2RY12, magenta; nuclei - DAPI, blue; and lysosomes - CD68, cyan. Representative image of hundreds of microglia examined. Scale bar represents 10 µm. b Immunocytochemistry of a microglial cell isolated from micro-dissected LGNs and superior colliculi (SCs) following ONC of AF488-labeled RGC inputs. Representative image of hundreds of microglia examined. Scale bar represents 5 µm. c Schematic of RGC labeling and selective engulfment of crushed inputs following unilateral ONC. RGCs in each eye were labeled by intravitreal injection of cholera toxin subunit-B conjugated with either AF594 (CTB-594) or AF488 (CTB-AF488), resulting in robust labeling of their projections to the LGN and SC. The inputs from either the right or left eye were then crushed, and microglia were isolated from micro-dissected, pooled LGNs and SCs for quantification of engulfed AF488 and AF594 by flow cytometry. d Representative flow cytometry plots of microglia isolated from LGNs/SCs following unilateral ONC of either the inputs from the right (AF488-labeled) or the left (AF594-labeled) eye when no crush was conducted or following bilateral ONC. Plots are representative of 4 mice per condition quantified in (e). e Mean fluorescent intensity (MFI) of AF488 and AF594 contained in microglia from ONC or No crush conditions. Microglia were isolated from the LGNs/SCs by Dounce homogenization at 4 °C, enriched by Percoll centrifugation 3 days after ONC, and gated on the following markers: live, single cells, CD45+, CD11b+, CX3CR1+, CD206-. MFIs for AF488 or AF594 are normalized to the average MFI value for bilateral ONC for each respective color. Error bars indicate standard error of the mean. n = 4 mice per condition (two females and two males, except for No crush, four females). Statistical analysis: One-way ANOVA, Bonferroni’s multiple comparisons test. Source data provided.
Fig. 2
Fig. 2. In vivo engulfment of different fluorescent proteins following optic nerve crush.
a pKa values for fluorescent proteins (ZsGreen, TdTomato, EGFP, and EYFP) used to label retinal ganglion cells by crossing CHX-10-cre mice with lox-stop-lox (lsl) reporter mice. b MFI of ZsGreen contained in microglia from CHX10cre+lsl:ZsGreen mice. n = 5 (2 females and 3 males) for ONC and n = 4 (4 males) for No crush. c MFI of TdTomato contained in microglia from CHX10cre+lsl:TdTomato mice. n = 8 for ONC (2 females and 6 males) and n = 5 (5 females) for No crush. d MFI of EGFP contained in microglia from CHX10cre+lsl:EGFP mice. n = 5 for ONC (4 females and 1 male) and n = 5 for No crush (4 females and 1 male). e MFI of engulfed EYFP contained in microglia from CHX10cre+lsl:EYFP mice. n = 5 (5 males) for ONC and n = 4 (2 females and 2 males) for No crush. b–e Microglia were isolated from LGNs/SCs by Dounce homogenization at 4 °C and enriched by Percoll centrifugation 3 days after bilateral ONC. Microglia are gated on live, single cells, CD45+, CD11b+, CX3CR1+, Ly-6C- or CD206-. MFI values are normalized to the mean MFI of the No crush controls. The gates for positive microglia on the flow cytometric plots (5% contour plots) are based on the fluorescent signal from WT cortical microglia (<1% cells in positive gate) for each experiment. Error bars indicate standard error of the mean. Statistical analysis: unpaired two-tailed t test. Source data provided.
Fig. 3
Fig. 3. Engulfment screen for antibodies against specific synaptic proteins and myelin basic protein.
a Experimental schematic depicting the screen for antibodies against synaptic proteins. Flasks with EOC20 cells were incubated with synaptosomes (+) or media (-) for 60 min. Cells were then harvested, surface labeled, fixed, permeabilized, and stained intracellularly with one of 42 different antibodies against synaptic proteins or appropriate isotype controls before being analyzed by flow cytometry. b Scanning electron microscopy image of a synaptosome containing pre- and post-synaptic elements used in the engulfment screen (left). Representative image of tens of synaptosomes examined. Scale bar represents 200 nm. Diagram of the synaptic proteins targeted in the engulfment screen (right). Proteins for which the engulfed MFI ratio was above three-fold are highlighted in bold. c MFI (fold change) for each antibody tested in the engulfment screen. The MFI for cells incubated with synaptosomes was divided by the MFI of untreated cells. The orange dotted line indicates an arbitrary threshold of three-fold change that was used to select candidate antibodies for further validation. Histograms depict the staining of engulfed material corresponding to antibodies with the highest fold change in each category (also indicated with an arrowhead on the bar graph). n = 4 batches of cultured cells from four independent experiments, except for SNAP-25 Ms, SYN1/2 Ck, GAD65 GP, Homer 1b/c Rb, GluA1 Rb (2), and IgG1 MS for which n = 3. d Experimental schematic depicting a screen for antibodies against myelin basic protein (MBP). Flasks of EOC20 cells were incubated with myelin debris (+) or media (-) for 120 min and then processed for intracellular staining against MBP. e MFI (fold change) for each of the four different antibody clones against MBP and their respective isotype controls. Histograms for clone P82H9 and its IgG1 isotype control are displayed. n = 4 batches of cultured cells from four independent experiments. c, e Error bars indicate the standard error of the mean. Statistical analysis: One-way ANOVA, Bonferroni’s multiple comparisons test comparing each antibody with its corresponding control. Non-significant p values (P ≥ 0.05) are not shown while * indicates P values < 0.0001. Source data provided.
Fig. 4
Fig. 4. Assessment of false-positive signal in microglia and border macrophages using “sniffer cells”.
a Experimental schematic for assessment and abrogation of false-positive signal using “sniffer cells” and inhibitors of engulfment and lysosomal degradation. “Sniffer cells” for false SYN1 signal were introduced by mixing brain tissue from SYN1-KO mice (crossed with Ubi-GFP mice for identification) with brain tissue from WT mice. The samples were incubated with or without the cocktail of inhibitors and enzymatically digested with collagenase IV at 37 °C. Samples were then processed for flow cytometric analysis of SYN1. b Overview of the pharmacological inhibitor cocktail targeting engulfment and lysosomal degradation indicating the respective cellular processes targeted by each inhibitor. c SYN1-KO “sniffer cells” (shown in green) were introduced to reveal false-positive signals due to ex vivo SYN1+ contamination. The difference between WT cells and “sniffer cells” in the mixed samples without inhibitors is that the SYN1 signal in WT cells can be due to a combination of SYN1+ material engulfed in vivo (true signal, shown in pink) and ex vivo SYN1+ contamination (false-positive signal, shown in blue). In contrast, any SYN1 signal in the “sniffer cells” can only be due to ex vivo SYN1+ contamination and represents a false-positive signal. Treatment with the inhibitor cocktail is designed to reduce/prevent false-positive signals due to ex vivo engulfment, while SYN1 signal from in vivo engulfment (true signal) should be unaffected. SYN1 signal was assessed in both microglia (d) and BAMs (e). The flow cytometry plots show the SYN1 signal for WT and “sniffer cells” (S) in the mixed samples (separated on the x-axis based on GFP expression). The gates for SYN1+ cells are based on the fluorescence of their respective isotype controls (<1% cells in positive gate). Cells were gated on live, single cells, CD45+, CD11b+, CD64+, and GR1- and microglia were further gated on CX3CR1high and P2Y12high while BAMS were gated on CD206high and CD38high. n = 4 mice, all males, per condition. The mean fluorescent intensity (MFI) for SYN1 with isotype controls subtracted is depicted for all microglia (d) and BAMs (e) independent of the gating shown on the plots. Error bars indicate standard error of the mean. Statistical analysis: One-way ANOVA, Bonferroni’s multiple comparisons test. Source data provided.
Fig. 5
Fig. 5. Harvesting cells from perfusion-fixed tissue to reduce false-positive signal.
a Experimental schematic. Cells are harvested from perfusion-fixed tissue (fixed/cross-linked tissue is illustrated with an orange diagonal grid pattern). Residual paraformaldehyde is quenched prior to enzymatic digestion with Collagenase IV for 2 h at 37 °C. SYN1+ material engulfed in vivo prior to perfusion-fixation will be cross-linked inside the lysosomes (shown in light pink), while SYN1+ debris adhering to cells ex vivo (shown in blue) will detach after acid wash. Re-adherence of the debris is prevented with a blocking step (illustrated in red) prior to fluorescent immuno-labeling of SYN1 and analysis by flow cytometry. SYN1 signal was assessed in both microglia (b) and BAMs (c). The flow cytometry plots are displayed for SYN1 signal in cells harvested from live tissue, from fixed tissue with and without the acid wash and blocking step (AWB), and for the isotype control. The gates for SYN1+ cells are based on the fluorescence of their respective isotype controls (<1% cells in positive gate). Cells were gated on DAPI (to identify nucleated cells), single cells, CD45+, CD68+, GR1- and microglia were further gated on CX3CR1high and P2Y12high while BAMS were gated on CD206high and CD38high. The MFI for SYN1 with the isotype control subtracted is depicted for all microglia (b) and BAMs (c) independent of the gates shown on the plots. n = 4 mice, all females, per condition. Error bars represent standard error of the mean. Statistical analysis: One-way ANOVA, Bonferroni’s multiple comparisons test. Source data provided.
Fig. 6
Fig. 6. Engulfment of endogenous synaptic proteins in the optic nerve crush paradigm by cells harvested from perfusion-fixed tissue.
a Experimental schematic depicting isolation of cells from perfusion-fixed tissue and assessment of engulfment following optic nerve crush (ONC). Prior to bilateral ONC, retinal ganglion cells in both eyes were labeled by intravitreal injection of cholera toxin subunit-B conjugated with AF488 (CTB-AF488) to facilitate the micro-dissection of the lateral geniculate nuclei and superior colliculi (LGNs/SCs). AF488 and SNAP-25 signals were compared between no crush and ONC for both microglia (bc) and BAMs (de). Flow cytometry plots display AF488 and SNAP-25 signals in microglia and BAMs. The gates for AF488+ cells were based on the fluorescent signal from WT cortical cells while the gates for SNAP-25+ cells were based on the fluorescence of their respective isotype controls (<1% cells in positive gates). Cells were gated on DAPI (to identify nucleated cells), single cells, CD45+, CD68+, and GR1-. Microglia were further gated on CX3CR1high and P2Y12high, while BAMS were gated on CD206high and CD38high. The MFI for AF488 and SNAP-25 was normalized to the mean MFI of no crush controls and depicted for all microglia (bc) and BAMs (de) independent of the gates shown on the plots. n = 5 mice (3 females and 2 males) per condition. Error bars depict standard error of the mean. Statistical analysis: unpaired two-tailed t test. Source data provided.
Fig. 7
Fig. 7. Myelin engulfment following focal or global demyelination by cells harvested from perfusion-fixed tissue.
a Experimental schematic of the focal demyelination paradigm. Bilateral injection of lysolecithin (LPC) into localized areas of the corpus callosum (shown in green) results in focal demyelination (indicated in light blue) with no demyelination in the cortex (shown in light orange). b Microglia were harvested from perfusion-fixed tissue 7 days after injection of LPC. Flow cytometry plots display MBP and CD68 signal in microglia for both the cortex and the corpus callosum in control (non-injected) and LPC-injected mice. c MFI of MBP and CD68 signals in all microglia from cortex or corpus callosum (normalized to control). d Experimental schematic of the global demyelination paradigm. Treatment with cuprizone (CPZ, in diet) results in demyelination of both the cortex (shown in light orange with demyelination indicated in light blue) and the corpus callosum (shown in green with demyelination indicated in light blue). e Microglia were harvested from perfusion-fixed tissue after 3 weeks of CPZ treatment. Flow cytometry plots display MBP and CD68 signal in all microglia from cortex or corpus callosum in control (fed control diet) and CPZ-treated mice. f MFI of MBP and CD68 signal in all microglia from cortex or corpus callosum (normalized to control). Microglia were gated on DAPI (to identify nucleated cells), single cells, CD45+, CD68+, GR1-, CX3CR1high, and P2Y12high. n = 4 mice per condition: (c) 4 males and (f) 2 females and 2 males. Error bars indicate standard error of the mean. Statistical analysis: unpaired two-tailed t-test. Source data provided.

References

    1. Hong S, Dissing-Olesen L, Stevens B. New insights on the role of microglia in synaptic pruning in health and disease. Curr. Opin. Neurobiol. 2016;36:128–134. doi: 10.1016/j.conb.2015.12.004. - DOI - PMC - PubMed
    1. Wilton DK, Dissing-Olesen L, Stevens B. Neuron-glia signaling in synapse elimination. Annu. Rev. Neurosci. 2019;42:107–127. doi: 10.1146/annurev-neuro-070918-050306. - DOI - PubMed
    1. Aguzzi A, Barres BA, Bennett ML. Microglia: scapegoat, saboteur, or something else. Science. 2013;339:156–161. doi: 10.1126/science.1227901. - DOI - PMC - PubMed
    1. Bennett ML, Bennett FC. The influence of environment and origin on brain resident macrophages and implications for therapy. Nat. Neurosci. 2020;23:157–166. doi: 10.1038/s41593-019-0545-6. - DOI - PubMed
    1. Schafer, D. P., Lehrman, E. K., Heller, C. T. & Stevens, B. An engulfment assay: a protocol to assess interactions between CNS phagocytes and neurons. J. Vis. Exp.10.3791/51482 (2014). - PMC - PubMed

Publication types

Substances