. 2023 Sep 27;14(1):6043.
doi: 10.1038/s41467-023-41321-7.

A global-temporal analysis on Phytophthora sojae resistance-gene efficacy

Affiliations

A global-temporal analysis on Phytophthora sojae resistance-gene efficacy

Austin G McCoy et al. Nat Commun. .

Abstract

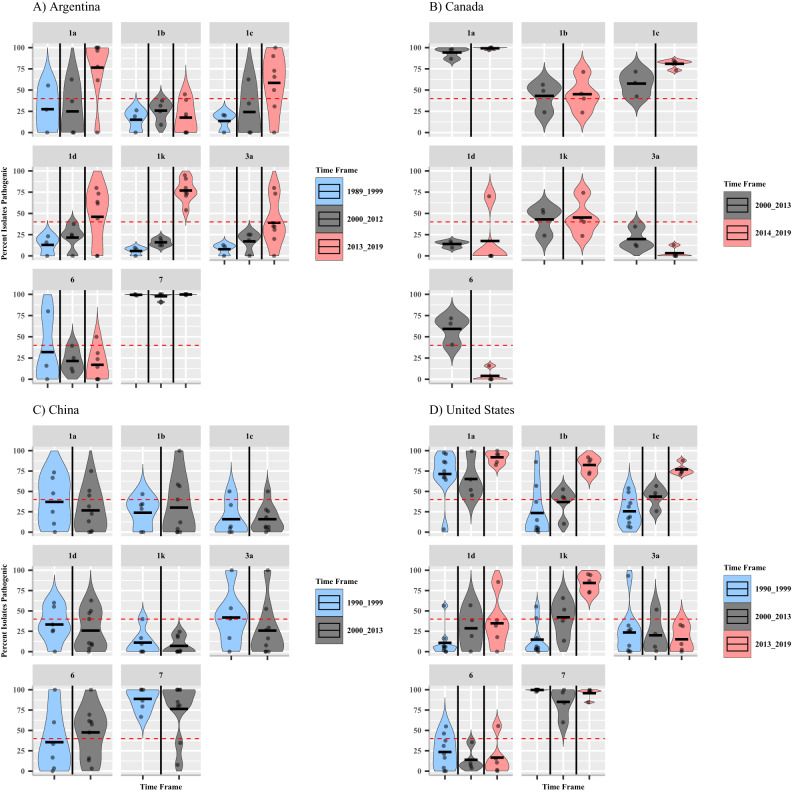
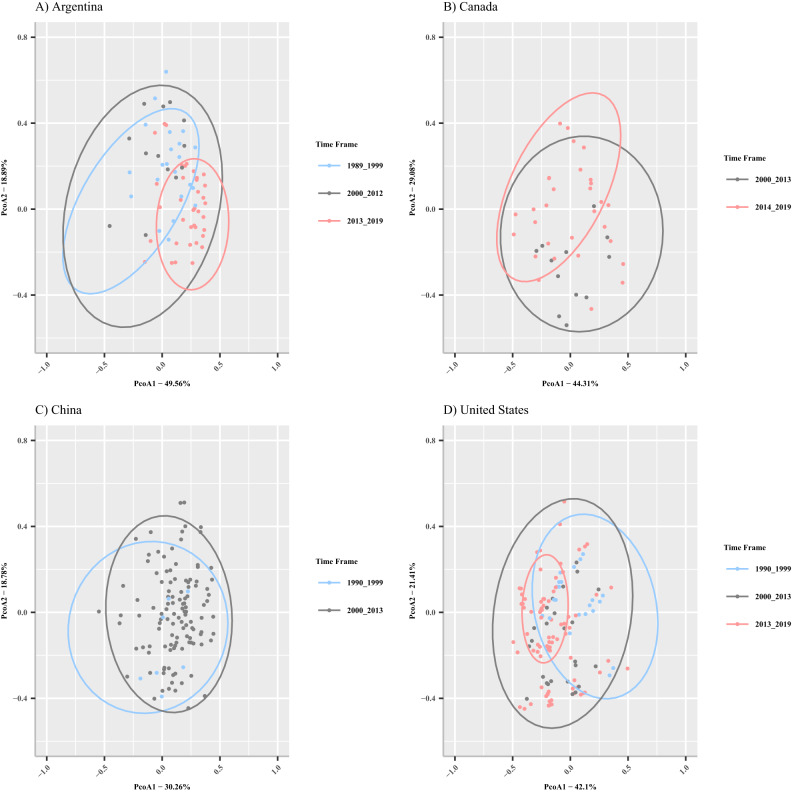
Plant disease resistance genes are widely used in agriculture to reduce disease outbreaks and epidemics and ensure global food security. In soybean, Rps (Resistance to Phytophthora sojae) genes are used to manage Phytophthora sojae, a major oomycete pathogen that causes Phytophthora stem and root rot (PRR) worldwide. This study aims to identify temporal changes in P. sojae pathotype complexity, diversity, and Rps gene efficacy. Pathotype data was collected from 5121 isolates of P. sojae, derived from 29 surveys conducted between 1990 and 2019 across the United States, Argentina, Canada, and China. This systematic review shows a loss of efficacy of specific Rps genes utilized for disease management and a significant increase in the pathotype diversity of isolates over time. This study finds that the most widely deployed Rps genes used to manage PRR globally, Rps1a, Rps1c and Rps1k, are no longer effective for PRR management in the United States, Argentina, and Canada. This systematic review emphasizes the need to widely introduce new sources of resistance to P. sojae, such as Rps3a, Rps6, or Rps11, into commercial cultivars to effectively manage PRR going forward.


Conflict of interest statement

The authors declare no competing interests.

Figures

Fig. 1
Fig. 1. Pathotype complexity of all isolates by timepoint for each country.
Panel A Argentina, 1989–1999 n = 174 isolates, 2000–2012 n = 65 isolates, 2013–2019 n = 210 isolates. 1989–1999 and 2000–2012 t-test (t = −1.775, df = 97.46, 95% CI = −0.906:0.051, p = 0.079), 2000–2013 and 2013–2019 t-test (t = −7.9205, df = 94.767, 95% CI = −2.367:−1.418, p = 4.485 × 10−12), 1989–1999 and 2013–2019 t-test (t = −15.614, df = 374.61, 95% CI = −2.613:−2.029, p = <2.2 × 10−16). Panel B Canada, 2000–2013 n = 253 isolates, 2014–2019 n = 394 isolates. 2000–2013 and 2014–2019 t-test (t = −2.562, df = 536.52, 95% CI = −0.462:−0.061, p = 0.01067). Panel C China, 1990–1999 n = 97 isolates, 2000–2013 n = 790 isolates. 1990–1999 and 2000–2013 t-test (t = −1.545, df = 119.9, 95% CI = −0.678:0.083, p = 0.1249). Panel D United States, 1990–1999 n = 1115 isolates, 2000–2013 n = 956 isolates, 2013–2019 n = 1067 isolates. 1990–1999 and 2000–2013 t-test (t = −1.278, df = 1998.1, 95% CI = −0.237:0.05, p = 0.2014), 2000–2013 and 2013–2019 t-test (t = −24.954, df = 1894.5, 95% CI = −1.89:−1.62, p < 2.2 × 10−16), 1990–1999 and 2013–2019 t-test (t = −28.021, df = 2168.7, 95% CI = −1.984:−1.725, p < 2.2 × 10−16). Blue coloring denotes the studies performed in the 1990s (1989–1999, or 1990–1999), gray denotes the studies performed between 2000 and 2013, and red coloring denotes studies performed between 2013 and 2019 for each respective country. Dots indicate individual isolates pathotype complexity. Median pathotype complexity is depicted by the black bar within the box. Whiskers depict the first and third quartiles of data. Mean pathotype complexity is shown as a black circle within the boxplot. Outliers are defined as a black dot outside of the first and third quartiles. Asterisks indicate statistically significant differences between the means of groups at α = 0.05. Source data are provided as a Source Data file.
Fig. 2
Fig. 2. Resistance gene efficacy for each Rps gene and timepoint interaction by country.
Facets denote the Rps genes tested; the Y-axis is the percent of isolates that are pathogenic on a given gene at a specific time frame from each study. Panel A Argentina, 1989–1999 n = 174 isolates, 2000–2012 n = 65 isolates, 2013–2019 n = 210 isolates. Panel B Canada, 2000–2013 n = 253 isolates, 2014–2019 n = 394 isolates. Panel C China, 1990–1999 n = 97 isolates, 2000–2013 n = 790 isolates. Panel D United States, 1990–1999 n = 1115 isolates, 2000–2013 n = 956 isolates, 2013–2019 n = 1067 isolates. Blue coloring denotes the studies performed in the 1990s (1989–1999, or 1990–1999), gray denotes the studies performed between 2000 and 2013, and red coloring denotes studies performed between 2013 and 2019 for each respective country. Dots within violin plots represent percent efficacy for each Rps gene by reported years isolates were recovered from included studies within each time frame. The black bar represents the mean percent pathogenic for each time frame and Rps gene within a county. The red dashed line is at 40%, indicating when the management efficacy of a gene to the population is reduced. Source data are provided as a Source Data file.
Fig. 3
Fig. 3. Principal Coordinates Analysis (PCoA) of the sampled virulence phenotype in P. sojae populations for each country colored by timepoint.
Panel A Argentina, 1989–1999 n = 174 isolates, 2000–2012 n = 65 isolates, 2013–2019 n = 210 isolates. Panel B Canada, 2000–2013 n = 253 isolates, 2014–2019 n = 394 isolates. Panel C China, 1990–1999 n = 97 isolates, 2000–2013 n = 790 isolates. Panel D United States, 1990–1999 n = 1115 isolates, 2000–2013 n = 956 isolates, 2013–2019 n = 1067 isolates Blue coloring denotes the studies performed in the 1990s (1989–1999 or 1990–1999), gray denotes the studies performed between 2000 and 2013, red coloring denotes studies performed between 2013 and 2019 for each respective country. Dots represent the Jaccard distance matrices values for each isolate within each country and time frame, respectively. 95% data ellipses are shown for each timepoint. Source data are provided as a Source Data file.

References

    1. United States Department of Agriculture Foreign Agriculture Service. World Agricultural Production. Circular Series WAP 8-22, pp. 1–47 https://apps.fas.usda.gov/psdonline/app/index.html#/app/downloads (Department of Agriculture, Washington, 2022).
    1. United Nations. World Population Projected to Reach 9.8 Billion in 2050, and 11.2 Billion in 2100. https://www.un.org/en/desa/world-population-projected-reach-98-billion-2... (UN, 2017).
    1. Vogel JT, et al. Soybean yield formation physiology—a foundation for precision breeding based improvement. Front. Plant Sci. 2021;12:719706. - PMC - PubMed
    1. Ning Y, Liu W, Wang GL. Balancing immunity and yield in crop plants. Trends Plant Sci. 2017;22:1069–1079. - PubMed
    1. Tyler BM. Phytophthora sojae: root rot pathogen of soybean and model oomycete. Mol. Plant Pathol. 2007;8:1–8. - PubMed

Publication types