

Single-cell transcriptomics delineates the immune cell landscape in equine lower airways and reveals upregulation of FKBP5 in horses with asthma
- PMID: 37758813
- PMCID: PMC10533524
- DOI: 10.1038/s41598-023-43368-4
Single-cell transcriptomics delineates the immune cell landscape in equine lower airways and reveals upregulation of FKBP5 in horses with asthma
Abstract
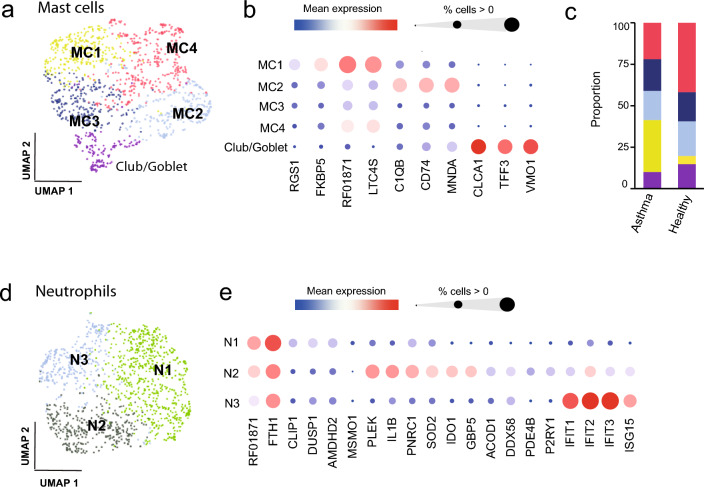
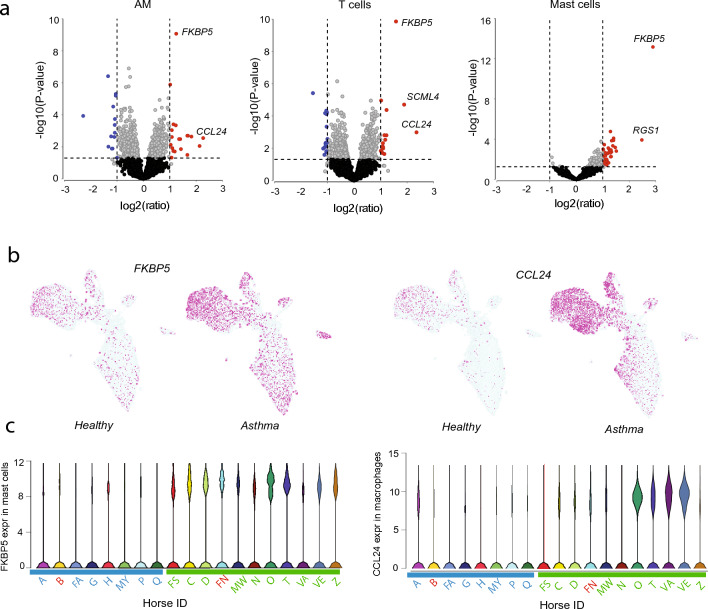
Equine asthma (EA) is a heterogenous, complex disease, with a significant negative impact on horse welfare and performance. EA and human asthma share fundamental similarities, making EA a useful model for studying the disease. One relevant sample type for investigating chronic lung inflammation is bronchoalveolar lavage fluid (BALF), which provides a snapshot of the immune cells present in the alveolar space. To investigate the immune cell landscape of the respiratory tract in horses with mild-to-moderate equine asthma (mEA) and healthy controls, single-cell RNA sequencing was conducted on equine BALF cells. We characterized the major immune cell populations present in equine BALF, as well as subtypes thereof. Interestingly, the most significantly upregulated gene discovered in cases of mEA was FKBP5, a chaperone protein involved in regulating the activity of the glucocorticoid receptor.
© 2023. Springer Nature Limited.
Conflict of interest statement
The authors declare no competing interests.
Figures


Similar articles
-
Bronchoalveolar lavage fluid cytokine, cytology and IgE allergen in horses with equine asthma.Vet Immunol Immunopathol. 2020 Feb;220:109976. doi: 10.1016/j.vetimm.2019.109976. Epub 2019 Nov 19. Vet Immunol Immunopathol. 2020. PMID: 31786444
-
Cytokine mRNA expression in the bronchoalveolar lavage cells from horses affected by different equine asthma subtypes.J Equine Vet Sci. 2024 Apr;135:105033. doi: 10.1016/j.jevs.2024.105033. Epub 2024 Feb 27. J Equine Vet Sci. 2024. PMID: 38423374
-
Bronchoalveolar lavage fluid from both lungs in horses: Diagnostic reliability of cytology from pooled samples.Vet J. 2019 Feb;244:28-33. doi: 10.1016/j.tvjl.2018.12.002. Epub 2018 Dec 6. Vet J. 2019. PMID: 30825891
-
Airway Diagnostics: Bronchoalveolar Lavage, Tracheal Wash, and Pleural Fluid.Vet Clin North Am Equine Pract. 2020 Apr;36(1):87-103. doi: 10.1016/j.cveq.2019.12.006. Vet Clin North Am Equine Pract. 2020. PMID: 32145836 Review.
-
Mild-moderate equine asthma: A scoping review of evidence supporting the consensus definition.Vet J. 2022 Aug;286:105865. doi: 10.1016/j.tvjl.2022.105865. Epub 2022 Jul 8. Vet J. 2022. PMID: 35817389
Cited by
-
Characterization of the single cell landscape in normal and osteoarthritic equine joints.Ann Transl Med. 2024 Oct 20;12(5):88. doi: 10.21037/atm-24-40. Epub 2024 Oct 15. Ann Transl Med. 2024. PMID: 39507442 Free PMC article.
-
Exploring a pico-well based scRNA-seq method (HIVE) for simplified processing of equine bronchoalveolar lavage cells.PLoS One. 2025 Jan 24;20(1):e0317343. doi: 10.1371/journal.pone.0317343. eCollection 2025. PLoS One. 2025. PMID: 39854349 Free PMC article.
References
-
- Ramseyer A, et al. Effects of genetic and environmental factors on chronic lower airway disease in horses. J. Vet. Intern. Med. 2007;21:149–156. - PubMed
-
- Holcombe SJ, et al. Stabling is associated with airway inflammation in young Arabian horses. Equine Vet. J. 2010;33:244–249. - PubMed
-
- Rettmer H, Hoffman AM, Lanz S, Oertly M, Gerber V. Owner-reported coughing and nasal discharge are associated with clinical findings, arterial oxygen tension, mucus score and bronchoprovocation in horses with recurrent airway obstruction in a field setting: Coughing and nasal discharge in equine recurrent airway obstruction. Equine Vet. J. 2015;47:291–295. - PubMed
Publication types
MeSH terms
LinkOut - more resources
Full Text Sources
Medical
Miscellaneous
