

DNA methylation at quantitative trait loci (mQTLs) varies with cell type and nonheritable factors and may improve breast cancer risk assessment
- PMID: 37758816
- PMCID: PMC10533818
- DOI: 10.1038/s41698-023-00452-2
DNA methylation at quantitative trait loci (mQTLs) varies with cell type and nonheritable factors and may improve breast cancer risk assessment
Abstract
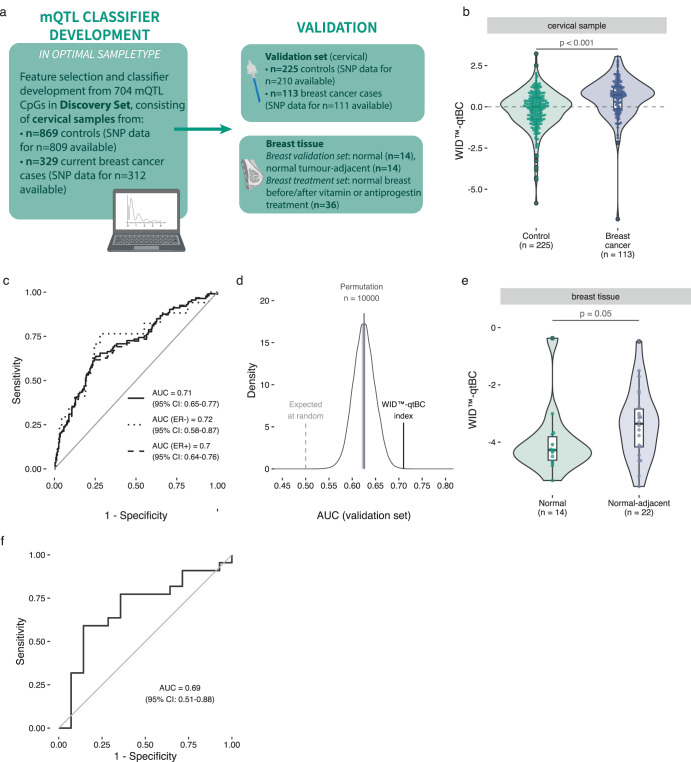
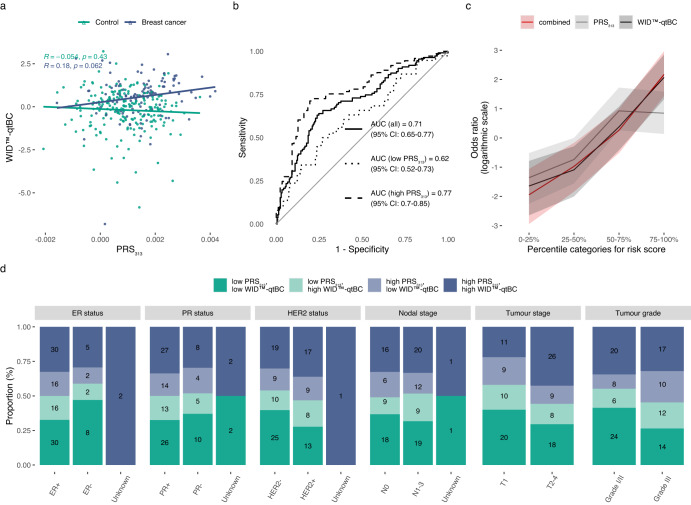
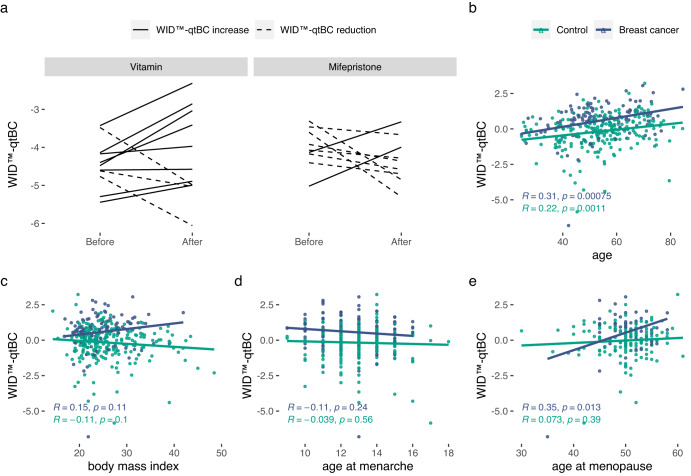
To individualise breast cancer (BC) prevention, markers to follow a person's changing environment and health extending beyond static genetic risk scores are required. Here, we analysed cervical and breast DNA methylation (n = 1848) and single nucleotide polymorphisms (n = 1442) and demonstrate that a linear combination of methylation levels at 104 BC-associated methylation quantitative trait loci (mQTL) CpGs, termed the WID™-qtBC index, can identify women with breast cancer in hormone-sensitive tissues (AUC = 0.71 [95% CI: 0.65-0.77] in cervical samples). Women in the highest combined risk group (high polygenic risk score and WID™-qtBC) had a 9.6-fold increased risk for BC [95% CI: 4.7-21] compared to the low-risk group and tended to present at more advanced stages. Importantly, the WID™-qtBC is influenced by non-genetic BC risk factors, including age and body mass index, and can be modified by a preventive pharmacological intervention, indicating an interaction between genome and environment recorded at the level of the epigenome. Our findings indicate that methylation levels at mQTLs in relevant surrogate tissues could enable integration of heritable and non-heritable factors for improved disease risk stratification.
© 2023. Nature Publishing Group UK.
Conflict of interest statement
C.H. and M.W. are shareholders of Sola Diagnostics GmbH, which holds an exclusive licence to the intellectual property that protects the commercialisation of the WID™-qtBC test. N.H. receives Honoraria for consulting and/or lectures (which are outside the remit of this work) from Astra Zeneca, Daiichi-Sankyo, Gilead, Lilly, MSD, Novartis, Pierre Fabre, Pfizer, Roche, Sanofi, Sandoz, and Seagen. All other authors declare no competing interests.
Figures
Similar articles
-
Incorporation of DNA methylation quantitative trait loci (mQTLs) in epigenome-wide association analysis: application to birthweight effects in neonatal whole blood.Clin Epigenetics. 2022 Dec 1;14(1):158. doi: 10.1186/s13148-022-01385-6. Clin Epigenetics. 2022. PMID: 36457128 Free PMC article.
-
Genetic regulation of methylation in human endometrium and blood and gene targets for reproductive diseases.Clin Epigenetics. 2019 Mar 14;11(1):49. doi: 10.1186/s13148-019-0648-7. Clin Epigenetics. 2019. PMID: 30871624 Free PMC article.
-
Identification of methylation quantitative trait loci (mQTLs) influencing promoter DNA methylation of alcohol dependence risk genes.Hum Genet. 2014 Sep;133(9):1093-104. doi: 10.1007/s00439-014-1452-2. Epub 2014 Jun 3. Hum Genet. 2014. PMID: 24889829 Free PMC article.
-
A Genome-Wide mQTL Analysis in Human Adipose Tissue Identifies Genetic Variants Associated with DNA Methylation, Gene Expression and Metabolic Traits.PLoS One. 2016 Jun 20;11(6):e0157776. doi: 10.1371/journal.pone.0157776. eCollection 2016. PLoS One. 2016. PMID: 27322064 Free PMC article.
-
The impact of methylation quantitative trait loci (mQTLs) on active smoking-related DNA methylation changes.Clin Epigenetics. 2017 Aug 17;9:87. doi: 10.1186/s13148-017-0387-6. eCollection 2017. Clin Epigenetics. 2017. PMID: 28824732 Free PMC article.
Cited by
-
Association between methylation quantitative trait loci and colorectal cancer risk, survival and cancer recurrence.Br J Cancer. 2025 Jun 12. doi: 10.1038/s41416-025-03064-8. Online ahead of print. Br J Cancer. 2025. PMID: 40506516
-
Validation of blood-based detection of breast cancer highlights importance for cross-population validation.Nat Commun. 2025 Mar 5;16(1):2164. doi: 10.1038/s41467-025-57265-z. Nat Commun. 2025. PMID: 40044645 Free PMC article. No abstract available.
-
Functionally enriched epigenetic clocks reveal tissue-specific discordant aging patterns in individuals with cancer.Commun Med (Lond). 2025 Apr 2;5(1):98. doi: 10.1038/s43856-025-00739-4. Commun Med (Lond). 2025. PMID: 40175686 Free PMC article.
-
Systems epigenetic approach towards non-invasive breast cancer detection.Nat Commun. 2025 Apr 2;16(1):3082. doi: 10.1038/s41467-024-53696-2. Nat Commun. 2025. PMID: 40175335 Free PMC article.
References
Grants and funding
LinkOut - more resources
Full Text Sources
