. 2023 Oct;622(7982):359-366.
doi: 10.1038/s41586-023-06564-w. Epub 2023 Sep 27.

Assembloid CRISPR screens reveal impact of disease genes in human neurodevelopment

Affiliations

Assembloid CRISPR screens reveal impact of disease genes in human neurodevelopment

Xiangling Meng et al. Nature. 2023 Oct.

Abstract

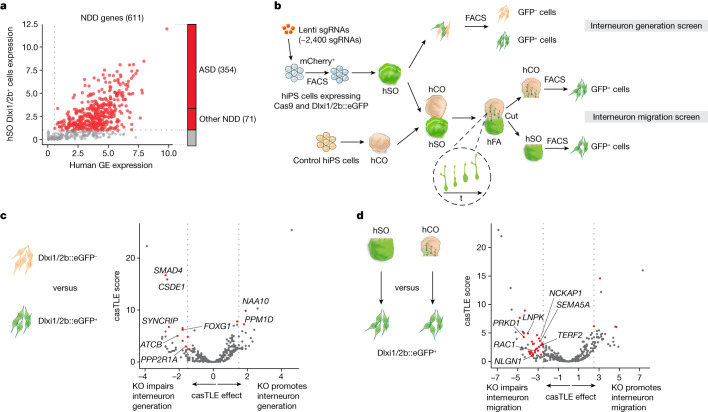
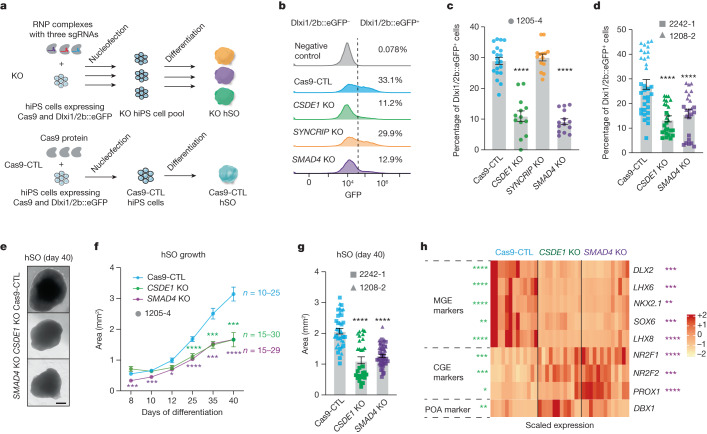
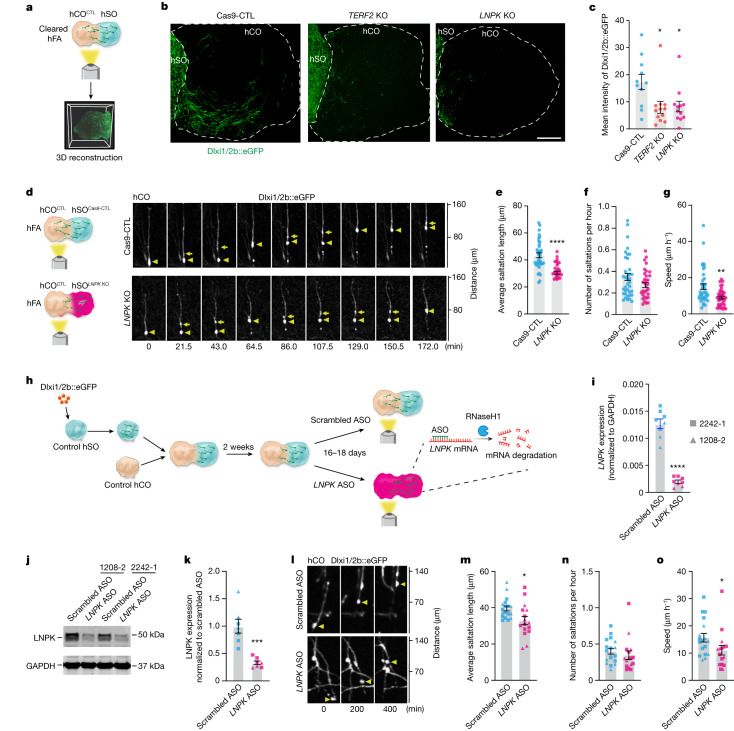
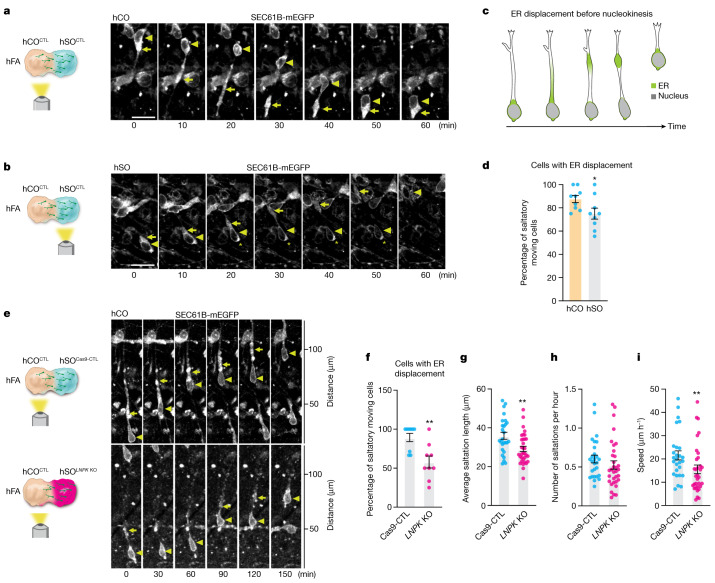
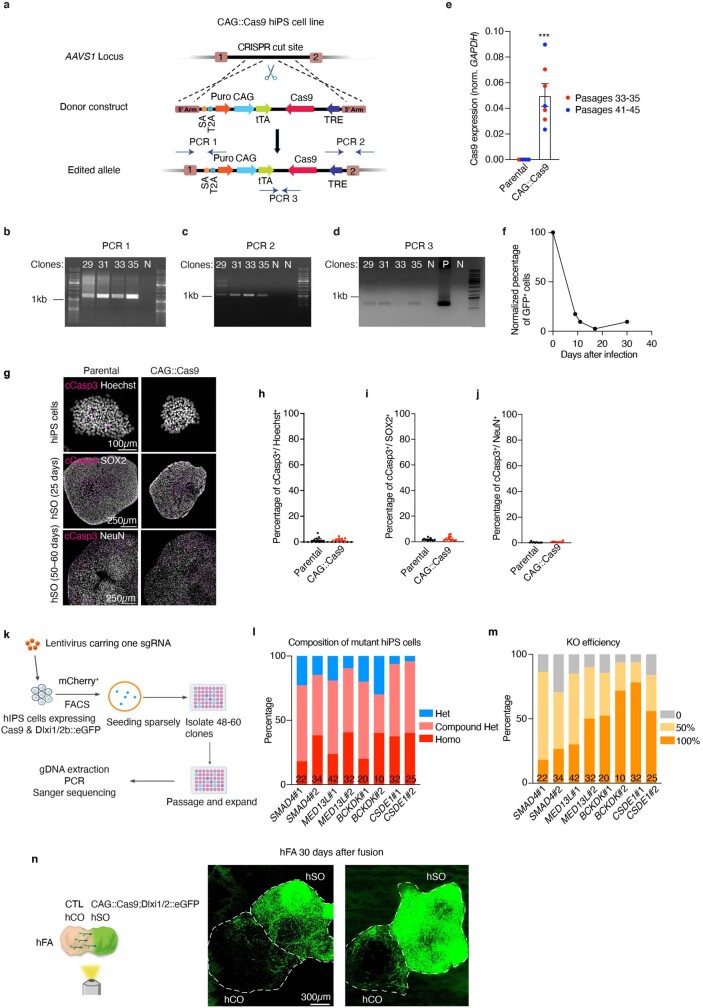
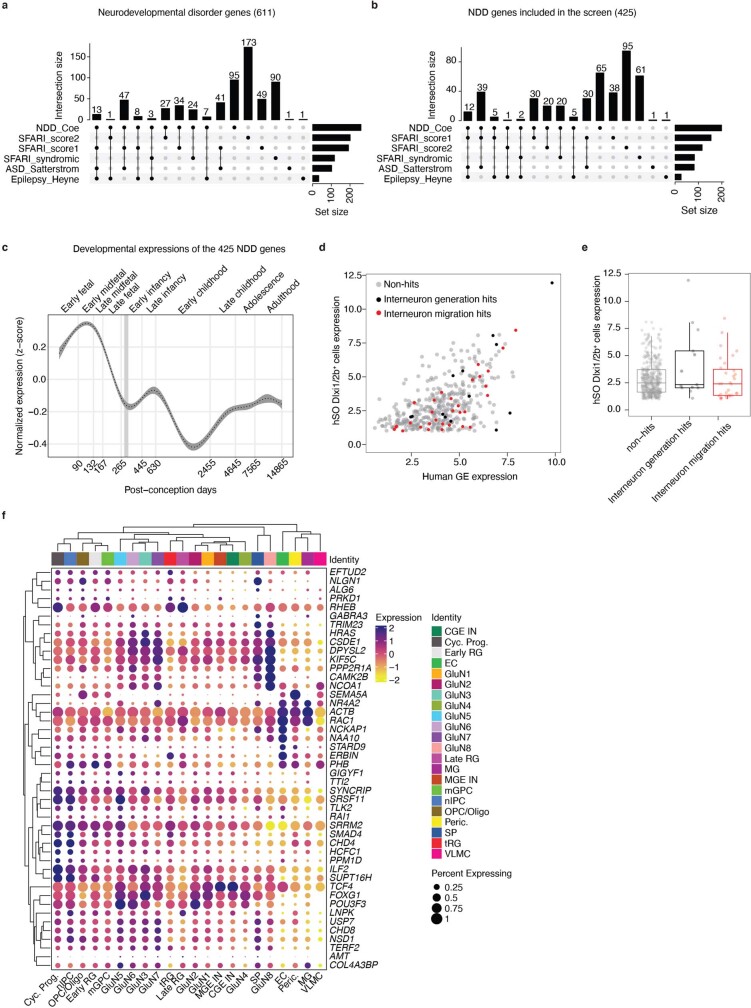
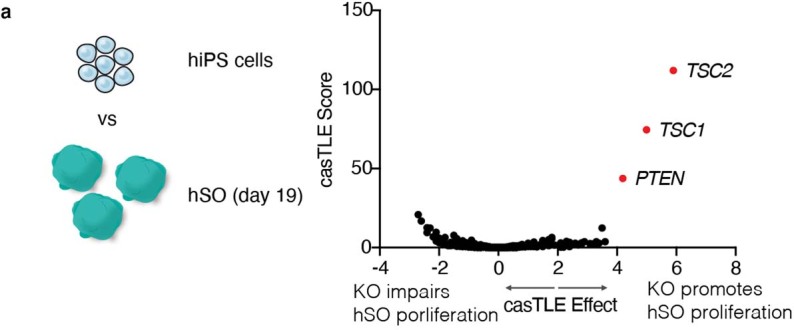
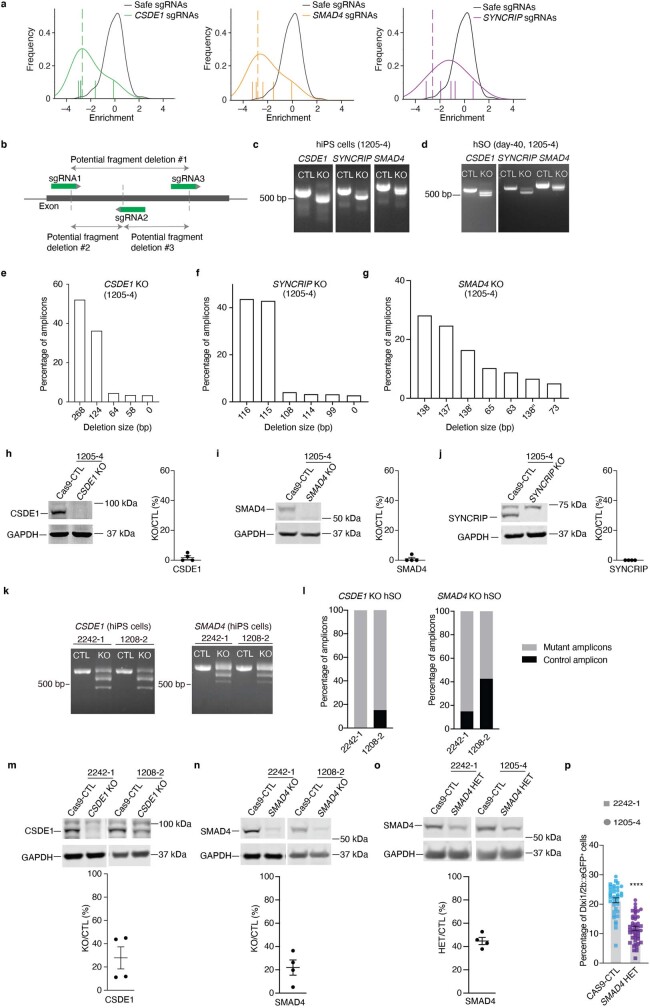
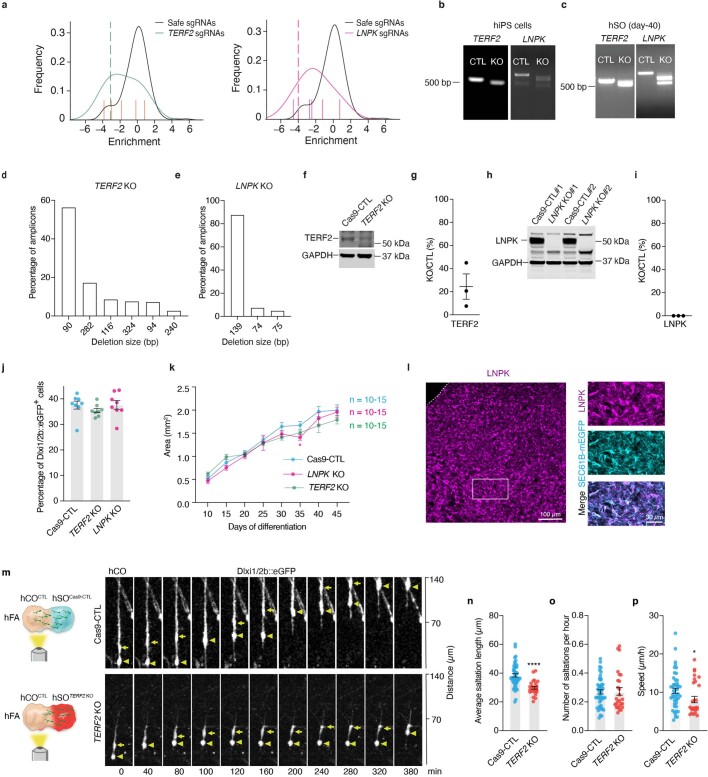
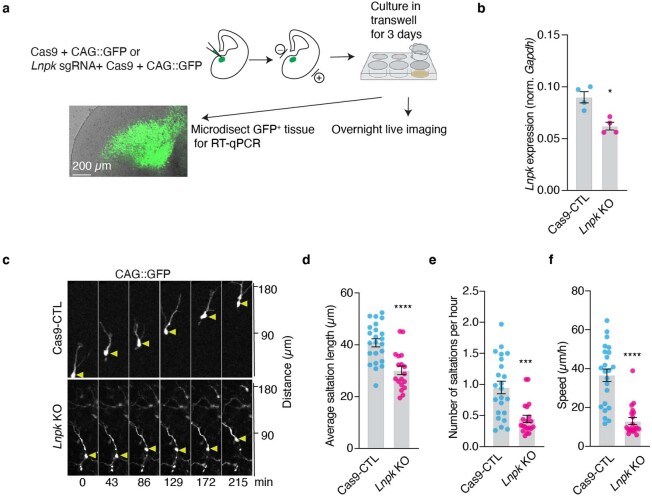
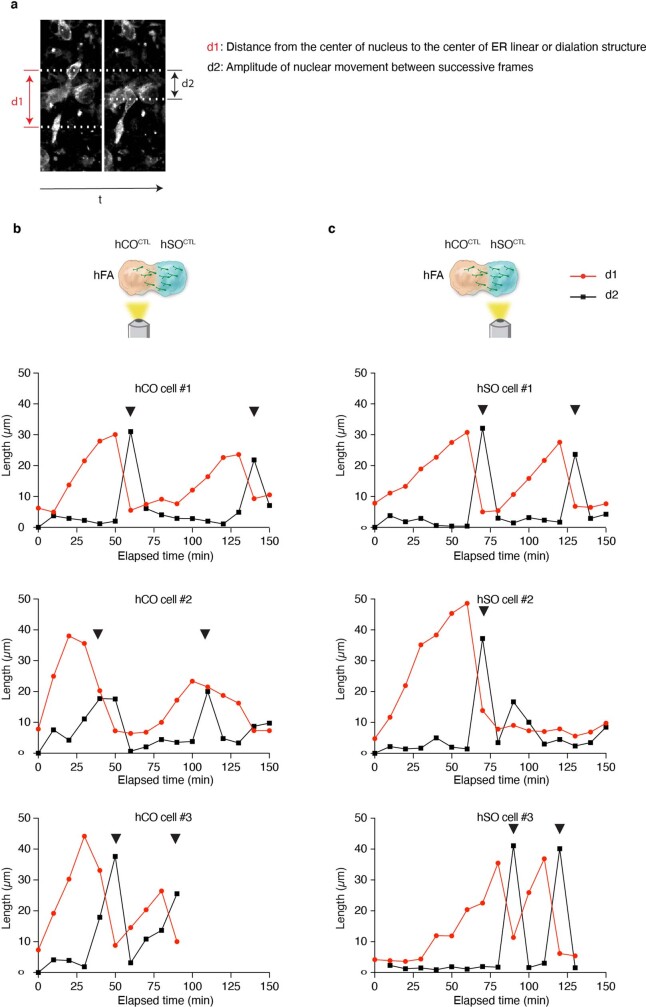
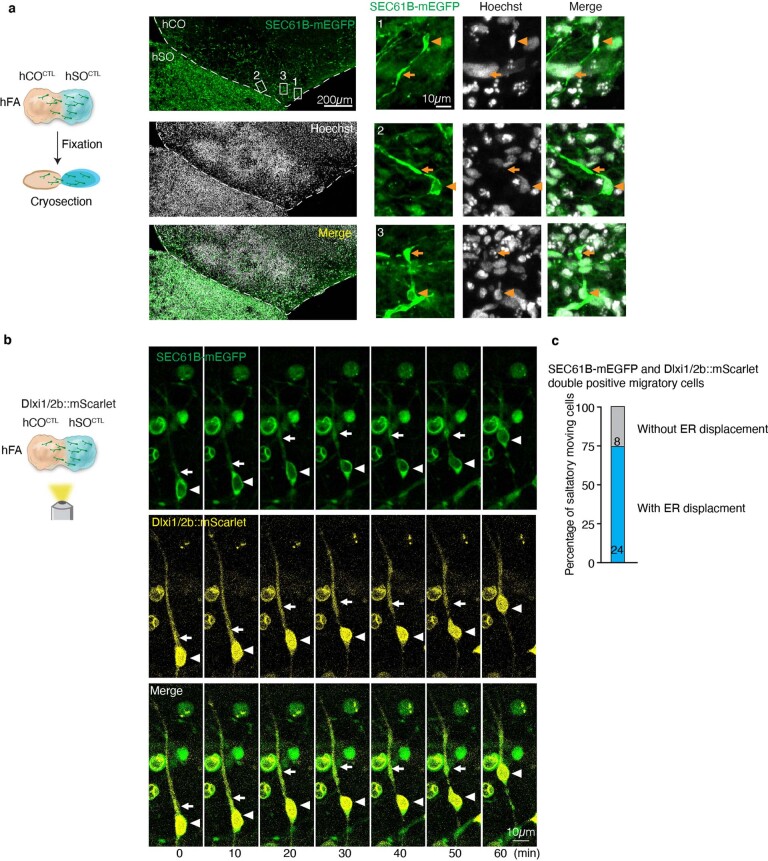
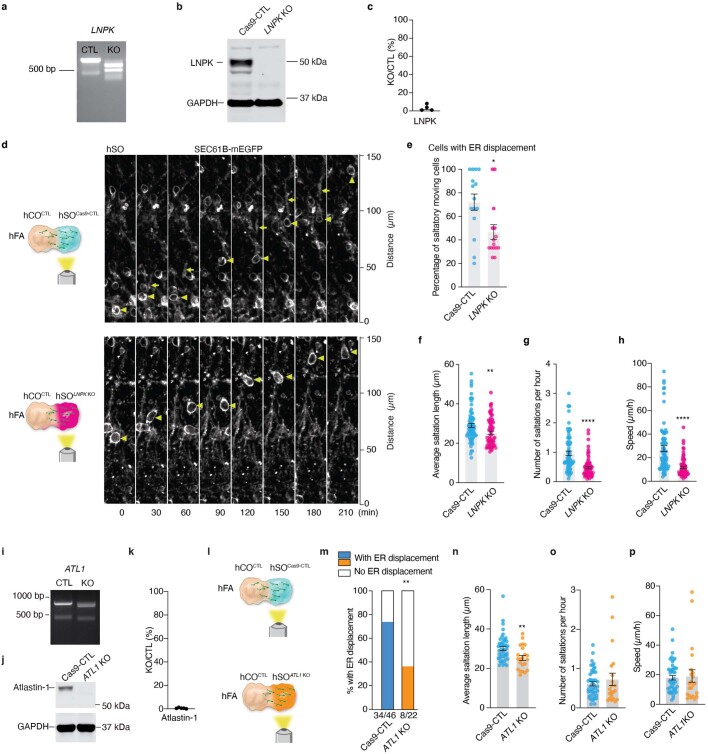
The assembly of cortical circuits involves the generation and migration of interneurons from the ventral to the dorsal forebrain1-3, which has been challenging to study at inaccessible stages of late gestation and early postnatal human development4. Autism spectrum disorder and other neurodevelopmental disorders (NDDs) have been associated with abnormal cortical interneuron development5, but which of these NDD genes affect interneuron generation and migration, and how they mediate these effects remains unknown. We previously developed a platform to study interneuron development and migration in subpallial organoids and forebrain assembloids6. Here we integrate assembloids with CRISPR screening to investigate the involvement of 425 NDD genes in human interneuron development. The first screen aimed at interneuron generation revealed 13 candidate genes, including CSDE1 and SMAD4. We subsequently conducted an interneuron migration screen in more than 1,000 forebrain assembloids that identified 33 candidate genes, including cytoskeleton-related genes and the endoplasmic reticulum-related gene LNPK. We discovered that, during interneuron migration, the endoplasmic reticulum is displaced along the leading neuronal branch before nuclear translocation. LNPK deletion interfered with this endoplasmic reticulum displacement and resulted in abnormal migration. These results highlight the power of this CRISPR-assembloid platform to systematically map NDD genes onto human development and reveal disease mechanisms.


Conflict of interest statement

Stanford University holds several patents on organoids and assembloids with S.P.P. listed as an inventor.

Figures

Fig. 1
Fig. 1. CRISPR screens of NDD genes reveal regulators of human interneuron generation and migration.
a, A total of 425 genes (labelled in red) out of 611 NDD genes showing expression in hSO Dlxi1/2b::eGFP+ cells and human postconception weeks 8–9 ganglionic eminences were included in the CRISPR screens. Among these, 354 genes are associated with ASD and 71 genes are associated with other NDDs. b, Schematic describing the interneuron generation and migration CRISPR screens. The inset highlights how hSO-derived interneurons migrate into the hCO side of the hFA. hSO were derived from the 1205-4 hiPS cell line and hCO were derived from the 2242-1 hiPS cell line. c, Volcano plot of the casTLE-estimated maximum gene perturbation effect size and associated casTLE score for the interneuron generation screen. Genes with at least two sgRNAs having effects equal to or less than −1.57 or equal to or more than +1.57, roughly twice the standard deviation (s.d.) of negative controls, were selected as candidates (red), with labels for cell cycle genes and genes that were subsequently validated. d, Volcano plot of the casTLE-estimated maximum gene perturbation effect size and associated casTLE score for the interneuron migration screen. Genes with at least two sgRNAs having effects equal to or less than −2.5 or equal to or more than +2.5, roughly twice the s.d. of negative controls were selected as candidates (red), with labels for cytoskeleton and cell migration genes and genes that were subsequently validated.
Fig. 2
Fig. 2. CSDE1 and SMAD4 regulate human interneuron generation.
a, Schematic showing the generation of KO cell pools. Premixed Cas9 protein and sgRNAs (three sgRNAs per gene, ribonucleoprotein (RNP) complex) were nucleofected into CAG::Cas9;Dlxi1/2b::eGFP hiPS cells, followed by differentiation and flow cytometry analysis. Cas9-CTL, cells received Cas9 protein alone. b, Percentages of Dlxi1/2b::GFP+ cells by flow cytometry analysis in day 45 hSO. Negative control: hSO without GFP expression. The x axis shows GFP intensity and the y axis shows counts. c,d, Percentage of Dlxi1/2b::GFP+ cells in hSO engineered from hiPS cell line 1205-4 (c, day 45 hSO, Cas9-CTL, n = 20, CSDE1 KO, n = 13, SYNCRIP1 KO, n = 14 and SMAD4 KO, n = 14, from two nucleofections and differentiations) or from 2242-1 and 1208-2 hiPS cell lines (d, day 40 hSO Cas9-CTL, n = 34; CSDE1 KO, n = 27 and SMAD4 KO, n = 25, from two differentiations). Each organoid was processed as one sample. e, Bright field images of hSO. Scale bar, 400 µm. f, Area of hSO (from four differentiations). g, Comparison of day 40 hSO size derived from 2242-1 and 1208-2 hiPS cell lines (Cas9-CTL, n = 37; CSDE1 KO, n = 30 and SMAD4 KO, n = 47, from two differentiations). h, Heatmap showing the differential expression of transcription factors in 35–40 days Cas9-CTL and KO hSO examined by RT–qPCR (n = 12–13, from seven differentiations and three hiPS cell lines); two-tailed Mann–Whitney test with Benjamini–Hochberg adjusted P value. Stars represent comparisons between Cas9-CTL and CSDE1 (left) or SMAD4 (right) KO. Data are presented as mean ± s.e.m. (standard error of mean, c,d,f,g); one-way ANOVA (c, F3,57 = 78.64; d, F2,83 = 20.70; g, F2,111 = 38.74) or mixed model two-way ANOVA (f, genotype as factor, F2,81 = 45.29) using Dunnett’s multiple comparison test. ****P < 0.0001. Supplementary Table 5 shows sample size and P values for f and h. Source data
Fig. 3
Fig. 3. Deletion of TERF2 and LNPK impairs interneuron migration in hFA.
a, Schematic showing CUBIC-cleared hFA imaging and 3D reconstruction. b, Representative images of 2D projections from reconstructed 3D images of hFA. Scale bar, 400 μm. c, Mean intensity of GFP (Cas9-CTL, n = 11 hFA; TERF2 KO, n = 12 hFA and LNPK KO, n = 12 hFA, from two differentiations). Cas9-CTL versus TERF2 KO: *P = 0.0225; Cas9-CTL versus LNPK KO: *P = 0.0428, Kruskal–Wallis test with Dunn’s multiple comparisons test. d, Saltatory migration of Dlxi1/2b::eGFP+ cells in the hCO side of hFA. eg, Saltation length (e), number of saltations (f) and speed of movement (g) of Dlxi1/2b::eGFP+ cells (n = 38 cells for each from 11 Cas9-CTL and 13 LNPK KO hFA from four differentiations). Two-tailed unpaired t-test, ****P< 0.0001 (e). Two-tailed Mann–Whitney test, P = 0.1332 (f) and **P = 0.0021 (g). h, The experimental design using an ASO to acutely delete LNPK and observe the effects on interneuron migration. i, Quantification of LNPK mRNA. ****P < 0.0001, two-tailed unpaired t-test (n = 8 hFA from three differentiations). j,k, Representative western blotting images (j) or analysis (k) (n = 8 hFA from three differentiations). ***P = 0.0006, two-tailed Mann–Whitney test. l, Representative time-lapse images showing saltatory migration of Dlxi1/2b::eGFP+ cells. mo, Saltation length (m), number of saltations (n) and speed of movement (o) of Dlxi1/2b::eGFP+ cells (scrambled ASO, n = 18 cells from nine hFA; LNPK ASO, n = 16 cells from eight hFA. Each from four differentiations of two hiPS cell lines). Two-tailed unpaired t-test, *P = 0.0109 (m). Two-tailed Mann–Whitney test, P = 0.2037 (n) and *P = 0.0229 (o). Data are presented as mean ± s.e.m (c,eg,i,k,mo). Source data
Fig. 4
Fig. 4. Deletion of LNPK impairs ER forward migration during nucleokinesis.
a,b, Representative time-lapse sequences of SEC61B-mEGFP+ cells moving in a saltatory pattern in the hCO (a) and hSO (b) sides of the hFA (hCO is unlabelled). Images were taken at 59–80 days after hFA generation. Triangles mark the nucleus and arrows mark the linear or dilated structure of the ER in the leading branch during migration. Scale bar, 20 μm. The star in b indicates that this cell also shows aggregation of ER signal at the rear of the soma. c, A schematic depiction of ER displacement during interneuron migration. d, Percentages of saltatory moving cells imaged in the hCO or hSO sides of the hFA (at 59–80 days postassembly) showing ER displacement (n = 9 hFA for each from two differentiations). *P = 0.041, two-tailed Mann–Whitney test. e, Representative time-lapse sequences of SEC61B-mEGFP+ cells in unlabelled hCO that migrated from Cas9-CTL or LNPK KO hSO (in the SEC61B-mEGFP hiPS parental cell line) moving in a saltatory pattern. f, Percentage of SEC61B-mEGFP+ saltatory moving cells in the hCO side of the hFA showing ER displacement (hFA at 30–40 days after assembly. n = 9 hFA for each from four differentiations). **P = 0.004, two-tailed unpaired t-test. gi, Saltation length (g), number of saltations (h) and speed of movement (i) of SEC61B-mEGFP+ cells in f (Cas9-CTL, n = 27 cells; LNPK KO, n = 33 cells). Two-tailed unpaired t-test, **P = 0.0031 (g). Two-tailed Mann–Whitney test, P = 0.1312 (h) and **P = 0.0079 (i). Data are presented as mean ± s.e.m. (d,fi). Source data
Extended Data Fig. 1
Extended Data Fig. 1. Generation and validation of the CAG::Cas9 hiPS cell line.
A, Schematic showing the strategy to generate the CAG::Cas9 hiPS cell line. Dashed lines indicate homologous recombination sites. PCR 1–3 indicate the three pairs of primers designed to confirm the insertion of the entire donor. bd, PCR confirming the successful amplification of the targeted DNA as shown in (a). “N”: negative control (PCR product from a control hiPS cell line). “P”: positive control (PCR product from the donor plasmid). In total, 35 clones were screened, and 3 clones (Clone #29, #31, and #35) were positive in all PCR reactions. e, Cas9 expression in CAG::Cas9 hiPS cells compared to the parental cells (n = 7 independent hiPS cell samples) by real-time-qPCR. *** P = 0.0006, two-tailed Mann-Whitney test. f, Genome editing efficiency in CAG::Cas9 hiPS cells. CAG::Cas9 hiPS cells were infected with a lentivirus harbouring GFP and a sgRNA against GFP. Infected cells were split into two groups with or without doxycycline (DOX) supplementation to inhibit Cas9 expression. Cells were subjected to flow cytometry to examine the percentage of GFP+ cells. The percentage of GFP+ cells (–DOX)/percentage of GFP+ cells ( +DOX) at each time point was plotted. g, Representative immunofluorescence images of hiPS cells and hSO for the quantifications in hj. hj, Percentage of cCasp3+ cells of Hoechst+ hiPS cells (h, n = 9 colonies from 3 passages) and percentage of cCasp3+ cells of SOX2+ (i, n = 12 organoids from 3 differentiations) or NeuN+ (j, n = 12 organoids from 4 differentiations) cells in hSO. h, j, Two-tailed Mann-Whitney test; h, P = 0.4742; j, P = 0.063; i, P = 0.1933, two-tailed unpaired t-test. k, Schematic showing experimental design for examining the deletion state of mutations in the CAG::Cas9;Dlxi1/2b::eGFP hiPS cells following transduction with a lentivirus expressing an individual sgRNA. l, Analysis of deletion state of mutant hiPS cells transduced by lentiviruses carrying 8 distinct sgRNAs. Homo: homozygous mutation. Het: heterozygous mutation. The number at the bottom of each column indicates the number of mutant clones we acquired for each sgRNA. m, Analysis of the KO efficiency of mutations reported in (l). If one allele had an in-frame deletion/insertion of less than 21 bp, its KO efficiency was assumed to be 0. n, Representative live images of hFA at 30 days after assembly. Day 45 CAG::Cas9;Dlxi1/2b::eGFP hSO were assembled with day 60 unlabeled hCO. The dashed lines indicate the boundary of hCO and hSO. Data are presented as mean ± s.e.m. (e, hj). Source data
Extended Data Fig. 2
Extended Data Fig. 2. Summary of NDD genes and the genes included in the screen.
a, Sources of the 611 NDD genes. b, Sources of the 425 NDD genes included in the screens. c, Expression trajectories in the human cerebral cortex of the selected 425 NDD genes using the BrainSpan dataset. Displayed are fitted (generalized additive model; denoted with dashed line) z-score normalized expression data with 99% confidence interval shown in grey (n = 425 genes; n = 419 cortical samples). d, e, Expression in hSO Dlxi1/2b::eGFP+ cells of screen hit genes compared with non-hit genes. e, Boxplot (horizontal line denotes median; lower and upper hinges correspond to the first and third quartiles; whiskers extend 1.5 times the interquartile range with outliers shown outside this range) representation of expression levels; non-hits (n = 392 genes) versus interneuron generation hits (n = 13 genes): P = 0.2013; non-hits versus interneuron migration hits (n = 33 genes): P = 0.404; two-sided Wilcoxon tests. f, Expression of screen hits summarized by cell cluster based on a single-cell RNA sequencing atlas of developing human cortex.
Extended Data Fig. 3
Extended Data Fig. 3. Early neural differentiation genes captured in the screen.
a, Volcano plot of the casTLE-estimated maximum gene perturbation effect size and associated casTLE score for neural differentiation at 19 days of hSO differentiation. Three genes with notable effects are labelled in red.
Extended Data Fig. 4
Extended Data Fig. 4. Confirmation of the KO efficiency for the selected candidate genes: CSDE1 and SMAD4.
a, Estimation of gene perturbation effect sizes. Log2 fold change enrichments, normalized to the median of negative ‘safe’-targeting controls, of sgRNAs between the Dlxi1/2::eGFP+ and Dlxi1/2::eGFP samples are plotted in the indicated color; the distribution of safe-targeting sgRNA controls in black. The dashed line is the casTLE-estimated maximum effect size. b, Schematic showing 3 sgRNAs designed to target an exon of the gene of interest to generate multiple fragment deletions. cd, Genotype analysis of hiPS cells (c) or day–40 hSO (d) showing the PCR amplicon of individual candidate genes. These experiments have been repeated 3 times. eg, Amplicon sequencing results from genomic DNA extracted from day–40 hSO derived from CSDE1 KO (e), SYNCRIP KO (f) or SMAD4 KO (g) cells. The percentage of each amplicon that is more than 2% is presented. In (g), 138, 138’ and 138” indicate three different amplicons that showed a 138 bp deletion. hj, Representative western blotting images and quantifications for KO cell pools generated from the 1205-4 hiPS cell line (h, i, n = 4, ~day 40 hSO, 2 differentiations; j, n = 4, hiPS cells). GAPDH was used as a loading control. k, Genotype analysis of hiPS cells showing the PCR amplicon of CSDE1 or SMAD4. These experiments have been repeated 3 times. l, Amplicon sequencing results from genomic DNA extracted from day 40 hSO. mo, Representative western blotting images and quantification of CSDE1 (m) and SMAD4 (n, o) abundance in day 40 hSO (n = 4 differentiations for each). GAPDH was used as a loading control. p, Percentage of Dlxi1/2b::GFP+ cells in ~day–40 hSO (Cas9-CTL, n = 37, SMAD4 HET, n = 46, from 3 differentiations). Two-tailed Mann-Whitney test. **** P < 0.0001. Data are presented as mean ± s.e.m. (hj, mp). Source data
Extended Data Fig. 5
Extended Data Fig. 5. Confirmation of KO efficiency of TERF2 and LNPK and effects of TERF2 loss on interneuron saltatory migration.
a, Estimation of gene perturbation effect sizes. Log2 fold change enrichments, normalized to the median of negative ‘safe’-targeting controls, of sgRNAs between the Dlxi1/2::eGFP+ and Dlxi1/2::eGFP samples are plotted in the indicated color; the distribution of safe-targeting sgRNA controls is shown in black. The dashed line is the casTLE-estimated maximum effect size. bc, Genotype analysis of hiPS cells (b) or day 40 hSO (c) showing the PCR amplicon of individual candidate genes. These experiments have been repeated 3 times. de, NGS analysis of amplicons amplified from genomic DNA extracted from day 40 hSO derived from TERF2 KO (d) and LNPK KO (e) cells. The percentage of each amplicon that is more than 2% is presented. In (d), TERF2 116’ has an additional 21 bp insertion. fi, Representative western blotting images and quantifications showing TERF2 (f, g) and LNPK (h, i) abundance in KO and Cas9-CTL hSO (day 60–80, n = 3 samples). GAPDH was used as a loading control. j, Percentage of Dlxi1/2b::GFP+ cells in day–57 hSO (n = 8 from 2 differentiations). Each organoid was processed as one sample. Kruskal-Wallis test (P = 0.1316). k, hSO size over time (from 4 differentiations). mixed model two-way ANOVA (genotype as factor, F2,42 = 3.329) using Dunnett’s multiple comparison test. * P = 0.0324. l, Left, a representative immunofluorescence image showing LNPK expression in hSO. Right, inset showing LNPK co-localizes with SEC61B-mEGFP in hSO derived from SEC61B-mEGFP hiPS cells. This experiment has been repeated 3 times. m, Saltatory migration of Dlxi1/2b::eGFP+ cells in the hCO side of the Cas9-CTL and TERF2 KO hFA. Triangles mark the nucleus and arrows mark the dilation that moves before nuclear translocation. np, Saltation length, number of saltations, and speed of movement of Dlxi1/2b::eGFP+ cells in the hCO side of the hFA (Cas9-CTL, n = 47 cells from 14 hFA; TERF2 KO, n = 26 cells from 8 hFA, from 3-4 differentiations). n, **** P < 0.0001, two-tailed unpaired t-test. o, p, Two-tailed Mann-Whitney test. o, P = 0.5497, p, * P = 0.0267. Data are presented as mean ± s.e.m. (g, i, j, k, np). Source data
Extended Data Fig. 6
Extended Data Fig. 6. Loss of Lnpk affects mouse interneuron migration.
a, Schematic illustrating the experimental design for investigating the role of LNPK in mouse interneuron migration. b, Quantification of Lnpk mRNA expression in the microdissected tissue (n = 4, each datapoint represents microdissected slices from 2-3 embryos). Data are presented as mean ± s.e.m.; two-tailed Mann-Whitney test. * P = 0.0286. c, Representative time-lapse sequences of live cell imaging showing the saltatory migration of GFP+ cells in slices electroporated with pCAG-IRES-GFP and CAS9 protein or pre-mixed sgRNAs-Cas9 complex targeting mouse Lnpk. Triangles mark the nucleus. df, Quantification of the saltation length (d, two-tailed unpaired t-test; **** P < 0.0001), number of saltations (e, two-tailed Mann-Whitney test; *** P = 0.0002), and speed of movement of electroporated cells (f, two-tailed Mann-Whitney test; **** P < 0.0001). Data are presented as mean ± s.e.m.; Cas9-CTL, n = 23 cells; Lnpk KO, n = 20 cells; from 10 embryos). Source data
Extended Data Fig. 7
Extended Data Fig. 7. ER is displaced prior to nuclear translocation in migrating human neural cells.
a, Example image showing measurements to study ER displacement and nuclear translocation. bc, Relation of nuclear and ER movement in example migrating SEC61B-mEGFP+ cells in hFA (related to Fig. 4c). Black triangles indicate nuclear translocations.
Extended Data Fig. 8
Extended Data Fig. 8. Other patterns of ER dynamics in saltatory moving cells.
ab, Time-lapse sequences of a SEC61B-mEGFP+ cell in hSO (a) or hCO (b) moving in a saltatory pattern. The hFA is generated by assembly of SEC61B-mEGFP hSO with unlabeled hCO. Triangles mark the nucleus and arrows mark ER localization at the leading branch or the trailing process during saltatory movement. The cell in (a) showed no detectable ER displacement. The cell in (b) has partial ER signal “left behind” the nucleus after nuclear translocation.
Extended Data Fig. 9
Extended Data Fig. 9. Migration-related ER displacement in fixed hFA and Dlxi1/2b::mScarlet+ cells.
a, Left: Immunofluorescence cryosection images of hFA obtained by assembly of unlabeled hCO with SEC61B-mEGFP hSO. Right: Inset showing the ER distribution in SEC61B-mEGFP+ cells migrated into the hCO. Triangles mark the nucleus and arrows mark the linear or dilated structure of the ER in the leading branch. From 2 experiments in n = 7 hFA. b, Representative time-lapse sequences showing ER displacement during the saltatory movement of a SEC61B-EGFP+ cell that was co-labelled with Dlxi1/2b::mScarlet (at ~60 days post-assembly). Triangles mark the nucleus and arrows mark the linear or dilated structure of the ER during migration (n = 5 hFA). c, Percentage of SEC61B-mEGFP and Dlxi1/2b::mScarlet double positive migratory cells showing ER displacement. Live images were taken from both hCO and hSO sides (n = 5 hFA).
Extended Data Fig. 10
Extended Data Fig. 10. Deletion of LNPK or ATL1 impaired ER displacement and saltation length of hSO saltatory migrating cells.
A, Genotype analysis of genomic DNA extracted from hSO showing the PCR amplicon of LNPK. b, Representative western blotting image showing LNPK expression in LNPK KO and Cas9-CTL hSO derived from the SEC61B-mEGFP hiPS cells. GAPDH was used as a loading control. c, Quantification of LNPK abundance (n = 4, from 3 differentiations). d, Representative time-lapse sequences of SEC61B-mEGFP+ cells moving in a saltatory pattern in hSO assembled with an unlabeled hCO. ER displacement was detectable in the last three steps of the four in Cas9-CTL, but not in the LNPK KO. e, Percentage of SEC61B-mEGFP+ saltatory moving cells in the hSO side of the hFA showing ER displacement (hFA at 29–52 days after assembly. n = 15 hFA from one differentiation). * P = 0.0218, two-tailed Mann-Whitney test. fh, Quantification of saltation length, number of saltations, and speed of movement of SEC61B-mEGFP+ cells in (d) (Cas9-CTL, n = 73 cells; LNPK KO, n = 68 cells). f, ** P = 0.0042, g, h **** P < 0.0001, two-tailed Mann-Whitney test. i, PCR analysis of hiPS cells showing the amplicon of ATL1. j, Representative western blotting image showing atlastin-1 abundance. GAPDH was used as a loading control. k, Quantification of atlatin-1 abundance (n = 5 from 4 differentiations). l, Schematic illustrating experimental design for performing live imaging on the hSO side of the hFA to observe saltatory migration. m, Percentage of saltatory migrating SEC61B-mEGFP+ cells showing ER displacement (Cas9-CTL, n = 46 cells from 12 hFA from 3 differentiations, 34 cells displayed ER displacement; ATL1 KO, n = 22 cells from 9 hFA from 2 differentiations, 8 cells displayed ER displacement; two-sided Chi-square test, ** P = 0.0029). np, Quantification of saltation length (n, ** P = 0.0067), number of saltations (o, P = 0.5891), and speed of movement (p, P = 0.2646) of SEC61B-mEGFP+ cells in (m) (Cas9-CTL, n = 46 cells, from 3 differentiations; ATL KO, n = 22 cells from 2 differentiations); two-tailed Mann-Whitney test. Data are presented as mean ± s.e.m. (c, e, fh, k, np). Source data

References

    1. Ma T, et al. Subcortical origins of human and monkey neocortical interneurons. Nat. Neurosci. 2013;16:1588–1597. doi: 10.1038/nn.3536. - DOI - PubMed
    1. Kepecs A, Fishell G. Interneuron cell types are fit to function. Nature. 2014;505:318–326. doi: 10.1038/nature12983. - DOI - PMC - PubMed
    1. Anderson SA, Marin O, Horn C, Jennings K, Rubenstein JL. Distinct cortical migrations from the medial and lateral ganglionic eminences. Development. 2001;128:353–363. doi: 10.1242/dev.128.3.353. - DOI - PubMed
    1. Kim JY, Paredes MF. Implications of extended inhibitory neuron development. Int. J. Mol. Sci. 2021;22:5113. doi: 10.3390/ijms22105113. - DOI - PMC - PubMed
    1. Contractor A, Ethell IM, Portera-Cailliau C. Cortical interneurons in autism. Nat. Neurosci. 2021;24:1648–1659. doi: 10.1038/s41593-021-00967-6. - DOI - PMC - PubMed

MeSH terms