. 2023 Oct;622(7983):552-561.
doi: 10.1038/s41586-023-06569-5. Epub 2023 Sep 27.

Spatial atlas of the mouse central nervous system at molecular resolution

Affiliations

Spatial atlas of the mouse central nervous system at molecular resolution

Hailing Shi et al. Nature. 2023 Oct.

Erratum in

Abstract

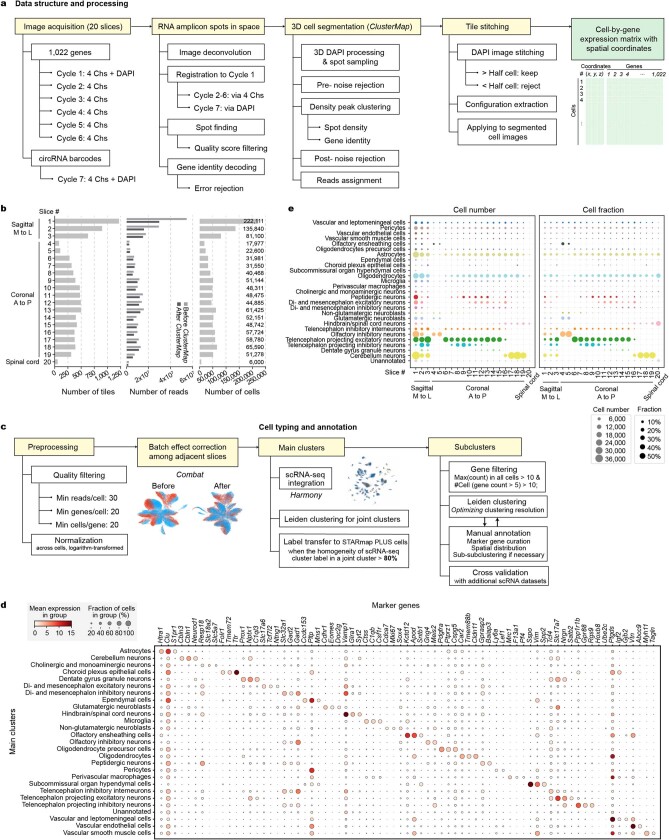
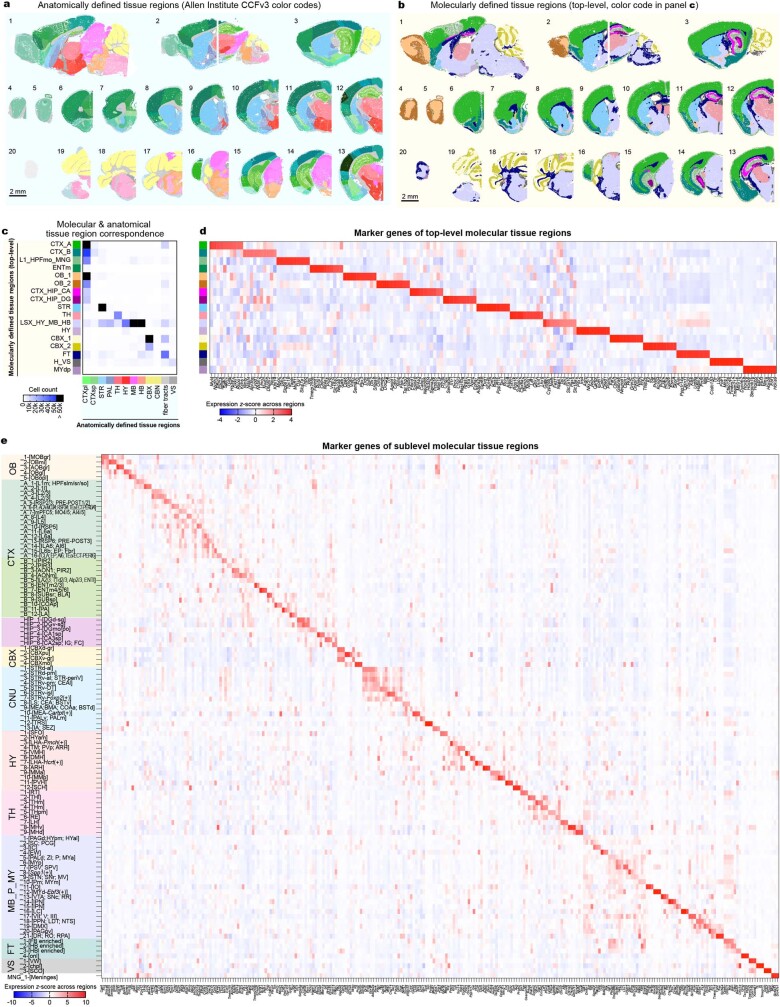
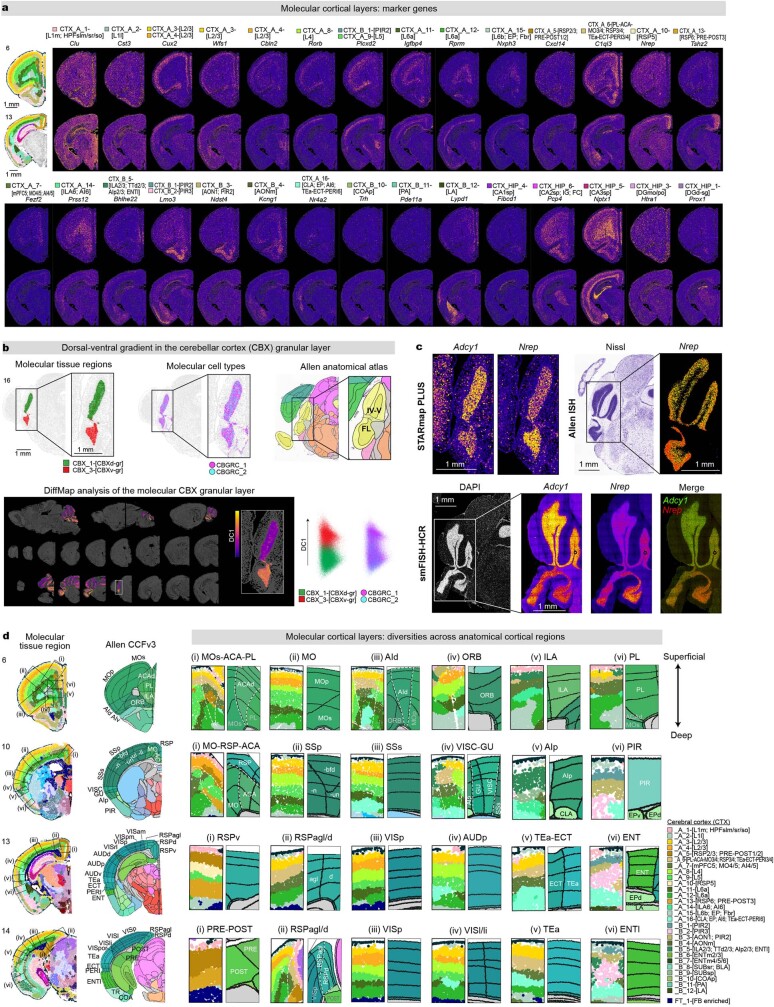
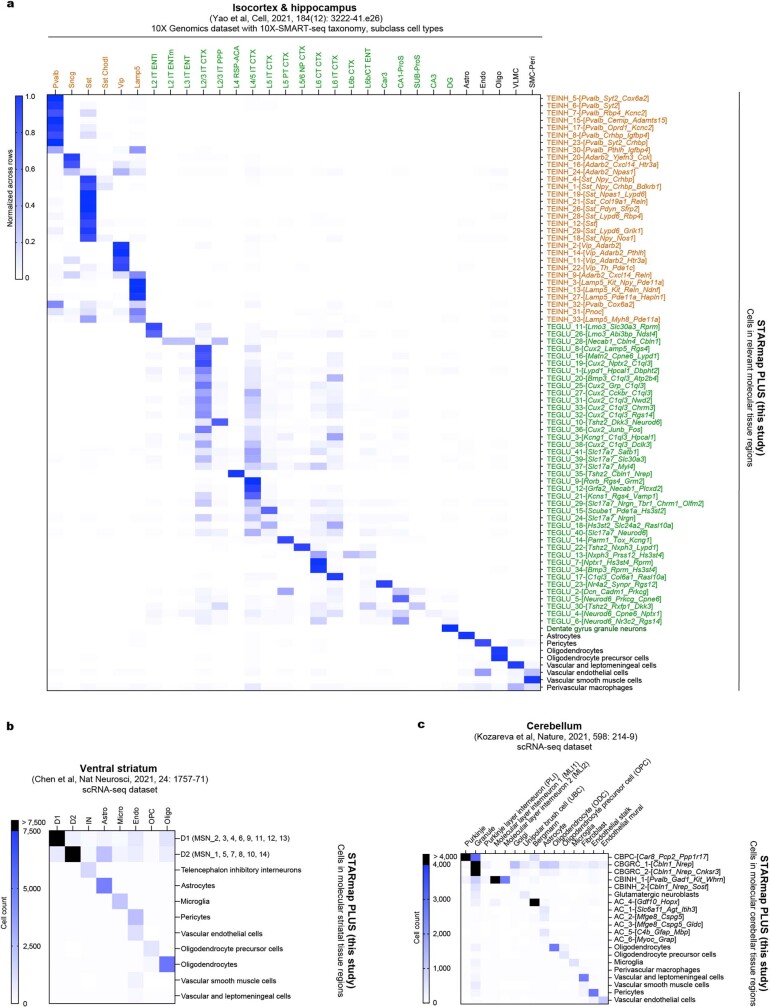
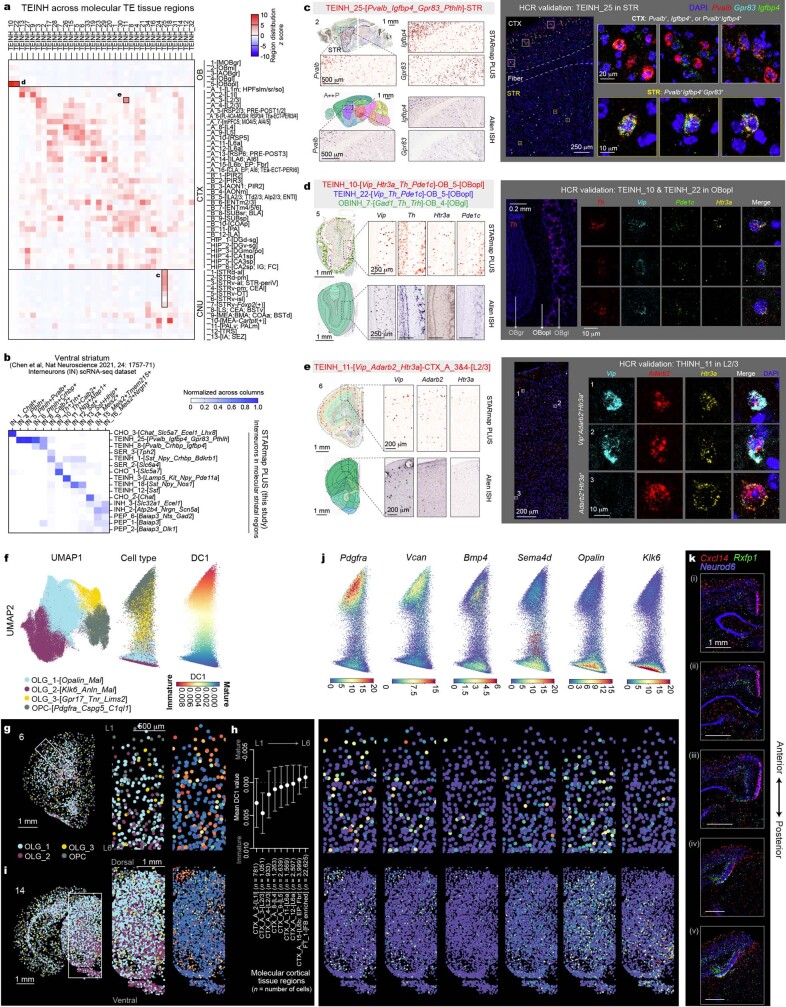
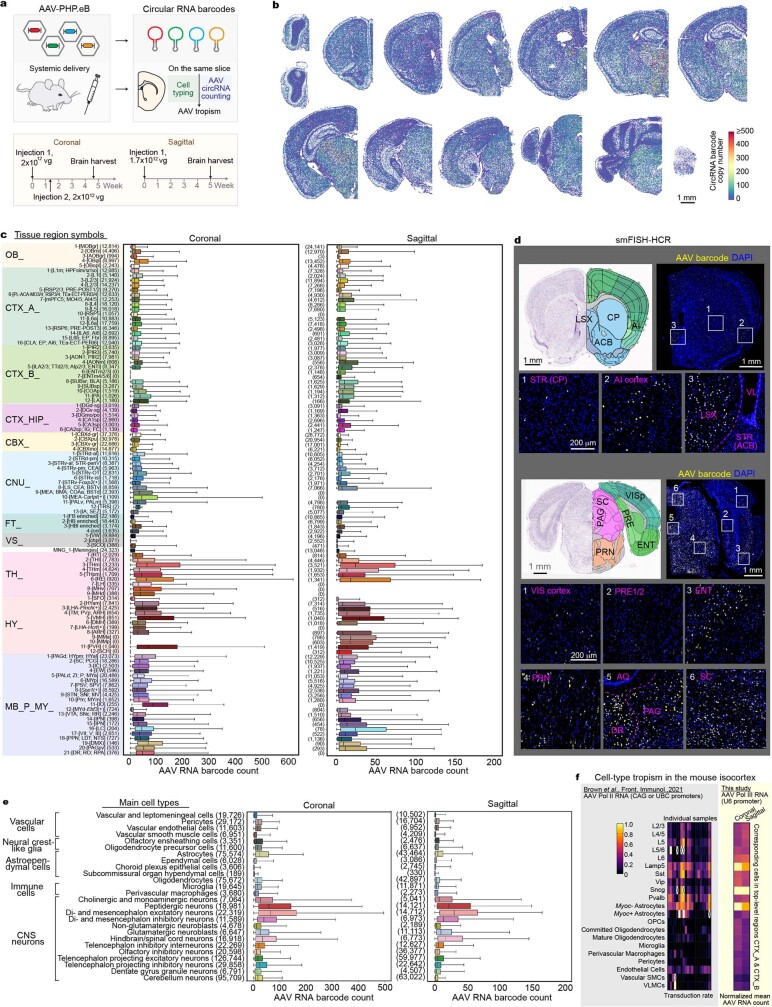
Spatially charting molecular cell types at single-cell resolution across the 3D volume is critical for illustrating the molecular basis of brain anatomy and functions. Single-cell RNA sequencing has profiled molecular cell types in the mouse brain1,2, but cannot capture their spatial organization. Here we used an in situ sequencing method, STARmap PLUS3,4, to profile 1,022 genes in 3D at a voxel size of 194 × 194 × 345 nm3, mapping 1.09 million high-quality cells across the adult mouse brain and spinal cord. We developed computational pipelines to segment, cluster and annotate 230 molecular cell types by single-cell gene expression and 106 molecular tissue regions by spatial niche gene expression. Joint analysis of molecular cell types and molecular tissue regions enabled a systematic molecular spatial cell-type nomenclature and identification of tissue architectures that were undefined in established brain anatomy. To create a transcriptome-wide spatial atlas, we integrated STARmap PLUS measurements with a published single-cell RNA-sequencing atlas1, imputing single-cell expression profiles of 11,844 genes. Finally, we delineated viral tropisms of a brain-wide transgene delivery tool, AAV-PHP.eB5,6. Together, this annotated dataset provides a single-cell resource that integrates the molecular spatial atlas, brain anatomy and the accessibility to genetic manipulation of the mammalian central nervous system.


Conflict of interest statement

X.W., H. Shi and Y.Z. are inventors on pending patent applications related to circular RNA barcodes. X.W. and J.R. are inventors on pending patent applications related to STARmap PLUS. X.W. is a scientific cofounder of Stellaromics. The other authors declare no competing interests.

Figures

Fig. 1
Fig. 1. Spatial maps of molecular cell types across the adult mouse CNS at subcellular resolution.
a, Overview of the study. Mouse brain tissue slices were collected four to five weeks after systemic administration of barcoded AAVs. STARmap PLUS, was performed to detect single RNA molecules from a targeted list of 1,022 endogenous genes and the trans-expressed AAV barcodes. The RNA spot matrix was converted to a cell-by-gene expression matrix via ClusterMap. By integrating with existing mouse CNS scRNA-seq data, we generated a CNS spatial atlas with cell cluster nomenclatures jointly defined by molecular cell types and molecular tissue regions, and imputed single-cell transcriptome-wide expression profiles. circRNA, circular RNA; AC, astrocytes; CB, cerebellum; CHO/MA, cholinergic and monoaminergic neurons; CHOR, choroid plexus epithelial cells; DE/MEGLU, diencephalon/mesencephalon excitatory neurons; DE/MEINH, diencephalon/mesencephalon inhibitory neurons; DGGRC, dentate gyrus granule cells; EPEN, ependymal cells; GNBL, glutamatergic neuroblasts; HB/SP, hindbrain/spinal cord; HYPEN, subcommissural organ hypendymal cells; MGL, microglia; MSN, telencephalon projecting inhibitory neurons (or medium spiny neurons); NGNBL, non-glutamatergic neuroblasts; OBINH, olfactory inhibitory neurons; OEC, olfactory ensheathing cells; OLG, oligodendrocytes; OPC, oligodendrocyte precursor cells; PEP, peptidergic neurons; PER, pericytes; PVM, perivascular macrophages; TEGLU, telencephalon projecting excitatory neurons; TEINH, telencephalon inhibitory interneurons; VEN, vascular endothelial cells; VLM, vascular and leptomeningeal cells; VSM, vascular smooth muscle cells. b, Uniform manifold approximation and projection (UMAP) of 1.09 million cells coloured by subcluster. The surrounding diagrams show 230 subclusters from 26 main clusters. Top right, UMAP coloured by slice directions; bottom right, UMAP coloured by slice identity as in c. c, Molecular cell-type maps of the 20 mouse CNS slices coloured by subcluster. Each dot represents one cell. d, A zoomed-in view of tissue slice 12 in c. Each dot represents a DNA amplicon generated from an RNA molecule, colour-coded by its cell-type identity. Brain region abbreviations are based on the Allen Mouse Brain Reference Atlas. alv, alveus; cc, corpus callosum; chpl, choroid plexus; cing, cingulum bundle; CP, caudoputamen; CTX, cerebral cortex; df, dorsal fornix; DG, dentate gyrus; FC, fasciola cinereum; fi, fimbria of hippocampus; HPF, hippocampal formation; int, internal capsule; L2/3, layer 2/3; L4, layer 4; L5, layer 5; L6, layer 6; LH, lateral habenula; MH, medial habenula; mo, molecular layer; po, polymorph layer; RSP, retrosplenial cortex; RT, reticular nucleus of the thalamus; sg, granule cell layer; slm, stratum lacunosum-moleculare; so, stratum oriens; sp, pyramidal layer; sr, stratum radiatum; STR, striatum; TH, thalamus; v3, third ventricle; VL, lateral ventricle. e, A zoomed-in view of the habenula region in d with cell boundaries outlined (left) and a mesh graph of physically neighbouring cells connected by edges (middle). Symbols for cell types with more than two counts were labelled (right). HABCHO, habenular cholinergic neurons; HABGLU, habenular excitatory neurons; INH, inhibitory neurons; NA, unannotated (see Methods, ‘Main cluster and subcluster cell-type annotation’). f, A representative fluorescent image of the region highlighted in e from the first cycle of SEDAL. Each dot represents an amplicon.
Fig. 2
Fig. 2. Molecular tissue regions across the adult mouse CNS.
a, Schematics of the workflow of clustering molecular tissue regions by single-cell resolved spatial niche gene expression. A spatial niche gene expression vector of each cell was formed by concatenating its single-cell gene expression vector and those of the kNNs in physical space. The vectors of all cells were stacked into a spatial niche gene expression matrix and Leiden-clustered into molecular tissue regions. b, Allen Mouse Brain Common Coordinate Framework (CCFv3, 10 μm resolution) registration to facilitate molecular tissue region annotation. c,d, Molecular tissue region maps registered into the visualizations in 3D (c; 16 coronal and 3 sagittal brain slices combined) and 2D (d; individual slices). Representative registrations are shown to compare corresponding molecular tissue regions with anatomical tissue regions (anatomical outlines on top of molecular cell-type maps) on the same slice (d, right). Each dot represents a cell. Anatomical region definitions are labelled in blue. Tissue region abbreviations are based on the Allen Mouse Brain Reference Atlas (Supplementary Notes). ACA, anterior cingulate area; Alp, posterior agranular insular area; AOBgr, accessory olfactory bulb, granule layer; AQ, cerebral aqueduct; AUD, auditory areas; CTXsp, cortical subplate; ECT, ectorhinal area; ENT, entorhinal area; ENTm, entorhinal area, medial part; GRN, gigantocellular reticular nucleus; HY, hypothalamus; IC, inferior colliculus; IG, indusium griseum; MB, midbrain; MDRN, medullary reticular nucleus; MM, medial mammillary nucleus; MO, somatomotor areas; MOBgr, main olfactory bulb, granular layer; MV, medial vestibular nucleus; ORB, orbital areas; PAG, periaqueductal gray; PAL, pallidum; PALm, pallidum, medial region; PG, pontine gray; PH, posterior hypothalamic nucleus; PIR, piriform area; PRN, pontine reticular nucleus; RSP, retrosplenial area; sAMY, striatum-like amygdalar nuclei; SC, superior colliculus; SFO, subfornical organ; SSp, primary somatosensory area; SSs, supplemental somatosensory area; TEa, temporal association areas; TRN, tegmental reticular nucleus; TRS, triangular nucleus of septum; VIS, visual areas; VISC, visceral area.
Fig. 3
Fig. 3. Joint nomenclature of cell clusters through the combination of molecular cell types and molecular tissue regions.
a, Schematic illustrating the workflow that combines molecular cell types and molecular tissue regions to jointly define cell-type nomenclatures. b, Heat map showing the distribution of molecular cell types across molecular tissue regions. The cell-type percentage composition is calculated for each molecular tissue region. Then for each cell type, the z-scores of its percentages across regions are plotted. Subtypes of the same main cell type are grouped together. CBX, cerebellar cortex; CHO, cholinergic neurons; CNU, cerebral nuclei; DOP, dopaminergic neurons; FT, fibre tracts; HA, histaminergic neurons; HAB, habenular cells; HBGLU, hindbrain excitatory neurons; HBINH, hindbrain inhibitory neurons; MB_P_MY, midbrain, pons and medulla; OB, olfactory bulb; SER, serotonergic neurons; VS, ventricular systems. See also Fig. 1b. Molecular tissue region abbreviations are provided in Supplementary Notes. Data are provided in the accompanying Source Data file. Source data
Fig. 4
Fig. 4. Joint analysis and validation of molecular cell types in molecular tissue regions.
a,b, From top to bottom: molecular tissue region maps, anatomical tissue maps registered to Allen CCFv3 (ref. ), marker cell-type distribution maps (cells within the specified region marked in dots, otherwise in ‘×’), marker gene STARmap PLUS measurements, marker gene Allen Mouse Brain ISH expression and smFISH–HCR validation of molecular cortical superficial laminar structure (CTX_A_3-[L2/3]) within the anatomical cortical L2/3 (a) and anterior–posterior (i–v) distribution of molecular RSP tissue regions (b). Cortical areas adjacent to RSP are labelled in the anatomical tissue maps. ACAd, anterior cingulate area, dorsal part; ILA, infralimbic area; MOp, primary motor area; MOs, secondary motor area; PL, prelimbic area; POST, postsubiculum; PRE, presubiculum; SUB, subiculum. c, Epha7 and Atp2b4 expression plotted in the single-cell gene expression UMAP of DGGRCs (top) and the spatial niche gene expression UMAP of molecular DG regions (middle), and spatial niche gene expression UMAP coloured by molecular cell types and molecular DG sublevel tissue regions (bottom). DGd-sg, dentate gyrus granule cell layer, dorsal part; DGv-sg, dentate gyrus granule cell layer, ventral part. d, Molecular tissue region map, molecular cell-type map and anatomical region map of dentate gyrus granule cell layer (DGsg) (top), STARmap PLUS measurements and Allen ISH expression (middle), and smFISH–HCR validation (bottom) of Epha7 and Atp2b4. smFISH–HCR images are representative of two (a,d) and three (b) experiments. The ISH data were obtained from the Allen Mouse Brain Atlas.
Fig. 5
Fig. 5. Transcriptome-scale adult mouse CNS spatial atlas by gene imputation.
a, Schematics of the imputation workflow. Using the STARmap PLUS measurements and a scRNA-seq atlas as inputs, we first performed intermediate mappings using a leave-one-(gene)-out strategy (Methods). The resulting intermediate mappings were used to compute weights between STARmap PLUS cells and scRNA-seq cells for a final imputation to output 11,844 gene-expression profiles in STARmap PLUS cells. b, Representative imputed spatial gene expression maps with corresponding STARmap PLUS and Allen Mouse Brain ISH gene-expression maps. Each dot represents a cell coloured by the expression level of a gene. Scale bar, 0.5 mm. The sample slice number was labelled (top left). c, Examples of imputed spatial expression profile of genes outside the STARmap PLUS 1,022 gene list with the corresponding Allen ISH images. Scale bar, 1 mm. The ISH data were obtained from Allen Mouse Brain Atlas.
Extended Data Fig. 1
Extended Data Fig. 1. Probe designs and raw fluorescent images of adult mouse CNS STARmap PLUS datasets.
a, Mouse brain single-cell RNA-seq (scRNA-seq) sources for the STARmap PLUS 1,022 gene-list selection. b, SNAIL probes (primer and padlock probes) for 1,022 endogenous genes. The padlock probe contains a 5-nt gene-unique identifier, which is amplified during rolling-circle amplification and read out by six cycles of sequential SEDAL through adaptor sequence A. c, Schematics showing the construct design and biogenesis of circular RNA barcodes. RtcB, RNA 2’,3’-cyclic phosphate and 5’-OH ligase. d, SNAIL probes for circular RNA barcodes. Each barcode is converted to a 1-nt identifier and read out by one additional cycle of SEDAL through adaptor sequence B. e, Raw fluorescent images of SEDAL of brain slice 12. The left panels show the image stack maximum projection of SEDAL cycles 1 (top) and 7 (bottom), merged into an entire hemisphere slice. The top-right panels show zoomed-in views of SEDAL cycles 1 to 7 and amplicons colored by gene identity from the square highlighted in the left panels. The bottom-right panels show the corresponding zoomed-in views of the square highlighted in the top-right panels.
Extended Data Fig. 2
Extended Data Fig. 2. Spatial cell typing workflow and data quality.
a, Data structure of the study and the workflow from raw images to a cell-by-gene matrix with cell spatial coordinates. Chs, channels. b, Summary of the number of tiles (i.e., imaging area), reads and cells in each tissue sample slice. The number of cells is labeled on the figure. c, Workflow of cell quality control, batch correction and cell typing. Key parameters and thresholds were labeled. d, Dot plots of the top three marker genes for each main cluster. e, Main-cluster cell-type composition of each tissue sample slice as in absolute cell number (left) and cell fraction normalized within each tissue slice (right). M, medial; L, lateral; A, anterior; P, posterior. Data are provided in the accompanying Source Data file. Source data
Extended Data Fig. 3
Extended Data Fig. 3. Subclustering of main cell types.
a-o, Subcluster spatial maps on representative sample slices for astrocytes (a), oligodendrocytes and oligodendrocyte precursor cells (b), microglia and perivascular macrophages (c), ependymal cells, choroid plexus epithelial cells and subcommissural organ hypendymal cells (d), olfactory inhibitory neurons (e), cerebellum neurons (f), telencephalon projecting inhibitory neurons (g), di- and mesencephalon excitatory neurons (h), glutamatergic neuroblasts (i), non-glutamatergic neuroblasts (j), di- and mesencephalon inhibitory neurons (k), cholinergic and monoaminergic neurons (l), peptidergic neurons (m), hindbrain/spinal cord neurons (n), and vascular cells (o). Also see Methods and Supplementary Table 4.
Extended Data Fig. 4
Extended Data Fig. 4. Subclustering of telencephalon projecting excitatory neurons and telencephalon inhibitory interneurons, and spatial maps of representative subcluster cell types.
a,b, Subcluster spatial maps of telencephalon projecting excitatory neurons (TEGLU, a) and telencephalon inhibitory interneurons (TEINH, b). c-e, Cell-type spatial maps, zoomed-in spatial expression heatmap of cell-type marker genes measured by STARmap PLUS and corresponding In Situ Hybridization (ISH) images of the marker genes from the Allen Mouse Brain ISH database, for subcluster cell types HA_1 (c), HBGLU_2 and HABGLU_1 (d) and EPEN_1 and EPEN_2 (e). Each dot represents a cell colour-coded by its subcluster cell-type symbol. Scale bars, 250 μm if not indicated. f, Mesh graph of cells shown on the STARmap PLUS molecular cell type map. Each cell is represented by a spot in the colour of its corresponding main cell type. Physically neighboring cells are connected via edges. Zoomed-in views of the top, middle, and bottom squares in the middle are shown on the right. g, First-tier cell-cell adjacency quantified by the normalized number of edges between individual pairs of main cell types (left). For each main cell type, the proportion of edges formed with cells of the same main type over the total number of edges with adjacent cells is shown in the bar plot (right). HA, histaminergic neurons; HBGLU, hindbrain excitatory neurons; HABGLU, habenular excitatory neurons; EPEN, ependymal cells; AC, astrocytes; MGL, microglia; DGGRC, dentate gyrus granule cells; DEGLU, diencephalon excitatory neurons. Also see Methods and Supplementary Table 4. Data are provided in the accompanying Source Data file. Source data
Extended Data Fig. 5
Extended Data Fig. 5. Brain anatomy registration (Allen CCFv3) and marker genes of molecular tissue regions.
a,b, Spatial plots of 20 sample slices coloured by CCF anatomical labels according to the Allen Institute 3D Mouse Brain Atlas (a) and top-level molecularly defined tissue regions (b). Each dot represents a cell. c, Heatmap showing the correspondence between main anatomical regions and top-level molecularly defined tissue regions. d,e, Marker gene heatmaps for top-level molecular tissue regions (top ten markers per region, ranked by z-scores of mean expression across regions, d) and sublevel molecular tissue regions (top three markers per region, ranked by z-scores of mean expression across regions, e). Tissue region abbreviations: OB, olfactory bulb; CTX, cerebral cortex; CBX, cerebellar cortex; CNU, cerebral nuclei; TH, thalamus; HY, hypothalamus; MB_P_MY, midbrain, pons, and medulla; FT, fibre tracts; VS, ventricular systems; H, habenula; MYdp, medulla, dorsoposterior part; HPFmo, non-pyramidal area of hippocampal formation; MNG, meninges; ENTm, entorhinal area, medial part; HIP, hippocampal region; DG, dentate gyrus; STR, striatum; CTXpl, cortical plate; LSX, lateral septal complex; PAL, pallidum; HB, hindbrain; CBN, cerebellar nuclei. Data are provided in the accompanying Source Data file. Source data
Extended Data Fig. 6
Extended Data Fig. 6. Molecular diversity within the cerebral cortex and the cerebellar cortex granular layer.
a, Spatial expression heatmap of representative marker genes for molecular cerebral cortical regions. b, Molecular tissue regions, molecular cell types and anatomical definition maps (from the Allen Mouse Brain Atlas,) at the cerebellar cortex granule layer (top), spatial maps of molecular cerebellar cortex granule layer coloured by the value of the first eigenvector of the diffusion map (DC1) (bottom left), and DC embeddings of spatial niche gene expression coloured by molecular tissue region identities (bottom middle) or molecular cell type identities (bottom right). IV-V, culmen lobules IV-V; FL, flocculus. c, STARmap PLUS, Allen ISH and smFISH-HCR images of Adcy1 and Nrep that are enriched in the dorsal and ventral parts of the cerebellar cortex granular layer (CBX_1-[CBXd_gr] versus CBX_3-[CBXv_gr]), respectively. smFISH-HCR images are representative of two experiments. d, Comparison of the molecular and anatomical tissue layer composition in various cortical regions covering the anterior-posterior, lateral-medial, and dorsal-ventral axes. Anatomical maps were shown as the registered tissue slices in CCFv3. Anatomical tissue region abbreviations: MO, somatomotor areas; MOs, secondary motor area; MOp, primary motor area; ACA, anterior cingulate area; ACAd, anterior cingulate area, dorsal part; PL, prelimbic area; AId, agranular insular area, dorsal part; AIp, agranular insular area, posterior part; ORB, orbital area; ILA, infralimbic area; RSP, retrosplenial area; RSPv, retrosplenial area, ventral part; RSPagl, retrosplenial area, lateral agranular part; RSPd, retrosplenial area, dorsal part; SSp, primary somatosensory area; SSs, supplemental somatosensory area; VISC, visceral area; GU, gustatory areas; PIR, piriform area; VISam, anteromedial visual area; VISpm, posteromedial visual area; VISp, primary visual area; VISrl, rostrolateral visual area; VISl, lateral visual area; VISli, laterointermediate area; VISpor, postrhinal area; AUDd, dorsal auditory area; AUDp, primary auditory area; AUDv, ventral auditory area; TEa, temporal association areas; ECT, ectorhinal area; PERI, perirhinal area; ENT, entorhinal area; ENTl, entorhinal area, lateral part; TR, postpiriform transition area; COA, cortical amygdalar area; PRE, presubiculum; POST, postsubiculum. Molecular tissue region abbreviations, see Supplementary Notes and Supplementary Table 5.
Extended Data Fig. 7
Extended Data Fig. 7. Cross-reference correspondence of STARmap PLUS main and subcluster cell types.
Cell-type correspondence to cell types annotated in scRNA-seq datasets of adult mouse brain subregions including datasets on isocortex and hippocampus from the Allen Institute (a), ventral striatum (nucleus accumbens, b) and cerebellum (c). Cell type abbreviations: IT, intratelencephalic; PT, pyramidal tract; NP, near-projecting. Data are provided in the accompanying Source Data file. Source data
Extended Data Fig. 8
Extended Data Fig. 8. Joint analysis and validation of molecular cell clusters in molecular tissue regions.
a, Heatmap showing the distribution of telencephalon inhibitory interneuron (TEINH) cell types across molecular telencephalon (TE) tissue regions. b, Correspondence of interneuron subtypes within the molecular striatal tissue regions to interneuron (IN) cell types annotated in the scRNA-seq dataset of adult mouse ventral striatum (nucleus accumbens). c-e, Cell type maps overlaid on molecular tissue regions, spatial expression heatmap of cell-type marker genes measured by STARmap PLUS, corresponding ISH images of the marker genes from the Allen Mouse Brain ISH database and independent smFISH-HCR validation of the distribution of the positive cells for TEINH_25 in the striatum (c), TEINH_10 and TEINH_22 in the olfactory bulb outer plexiform layer (OBopl, d) and TEINH_11 in cerebral cortical layer 2/3 (e). smFISH-HCR images are representative of two experiments (c-e). The ISH data were obtained from Allen Mouse Brain Atlas. f, UMAP embedding of OPC and OLG (left) and DC embedding coloured by molecular cell types (middle) and DC1 value (right). g,i, Spatial distribution of DC1 values of the OPC-OLG lineage and OPC-OLG molecular cell cluster identities in the cerebral cortical layers (g) and midbrain-pons dorsal-ventral axis (i). h, DC1 values of the OPC-OLG lineage across the molecular cortical layers. Data shown as mean ± s.t.d. j, DC embedding (top) and spatial maps (bottom) coloured by marker gene expression levels indicating oligodendrocyte differentiation and maturation states. Only OPC and OLG cells are plotted (g,i,j). k, STARmap PLUS expression heatmap of Cxcl14, Rxfp1, and Neurod6 in representative coronal slices along the anterior-posterior axis. Data are provided in the accompanying Source Data file. Source data
Extended Data Fig. 9
Extended Data Fig. 9. Imputation parameter optimization and performance evaluation.
a, Cumulative curves of the imputation performance scores across STARmap PLUS genes in the intermediate mapping using different numbers of scRNA-seq cell nearest neighbors. The upper-left inset shows a zoomed-in view of the rectangular region highlighted in the bottom right. The performance score of a gene was calculated as the Pearson’s correlation coefficient (PCC, across cells) between its imputed values and measured STARmap PLUS expression level. b, Scatter plots of spatial expression heterogeneity (Moran’s I of the gene’s spatial expression map) versus gene expression level in the STARmap PLUS datasets (left), and single-cell expression heterogeneity (Moran’s I of scRNA-seq UMAP coloured by the gene’s expression) versus gene expression level in the scRNA-seq atlas (right). Each dot represents a gene and is coloured by the gene’s imputation performance score. n = 1016 genes. c, More examples of the comparison of imputed spatial gene expression with measured expression from STARmap PLUS and Allen Mouse Brain ISH database. Each dot represents a cell coloured by the expression level of a specified gene. Scale bar, 0.5 mm. The sample slice numbers were labeled in gray. d,e, Imputed spatial gene expression heatmaps of putative marker genes of the ventral part (d) and the dorsal part (e) of medial habenula and the paired ISH images from the Allen Mouse Brain ISH database. Data are provided in the accompanying Source Data file. Source data
Extended Data Fig. 10
Extended Data Fig. 10. AAV barcode quantification across molecular tissue regions and molecular cell types and validation.
a, Schematics of AAV-PHP.eB tropism characterization strategy across the adult mouse CNS. vg, viral genome. b, Representative spatial heatmaps showing circular RNA expression on coronal slices. Each dot represents a cell colour-coded by its AAV barcode expression level. c,e, Boxplots of circular RNA expression level across molecular tissue regions (c) and main molecular cell types (e). Boxplot elements: the vertical line, median; the box, first to third quartiles; whiskers, 2.5–97.5%. Numbers in parentheses, number of cells in the group. Abbreviations for tissue region and cell type are the same as in the main figures (also see Supplementary Tables 4 and 5). d, smFISH-HCR validation of AAV-PHP.eB tissue region tropisms. Images are representative of two experiments. The brain pictures were obtained from Allen Mouse Brain Atlas. f, Comparison of transduction rates observed in AAV-PHP.eB tropism profiling in the mouse isocortex via scRNA-seq and the AAV RNA barcode expression in paired regions in the STARmap PLUS dataset. Anatomical tissue region abbreviations: STR, striatum; VL, lateral ventricle; LSX, lateral septal complex; CP, caudoputamen; ACB, nucleus accumbens; AI, agranular insular area; PAG, periaqueductal gray; PRN, pontine reticular nucleus; VIS, visual areas; PRE, presubiculum; ENT, entorhinal area; AQ, cerebral aqueduct; DR, dorsal nucleus raphe; SC, superior colliculus. Data are provided in the accompanying Source Data file. Source data

References

    1. Zeisel, A. et al. Molecular architecture of the mouse nervous system. Cell174, 999–1014.e22 (2018). - PMC - PubMed
    1. Saunders, A. et al. Molecular diversity and specializations among the cells of the adult mouse brain. Cell174, 1015–1030.e16 (2018). - PMC - PubMed
    1. Wang, X. et al. Three-dimensional intact-tissue sequencing of single-cell transcriptional states. Science361, eaat5691 (2018). - PMC - PubMed
    1. Zeng, H. et al. Integrative in situ mapping of single-cell transcriptional states and tissue histopathology in a mouse model of Alzheimer’s disease. Nat. Neurosci.26, 430–446 (2023). - PMC - PubMed
    1. Chan, K. Y. et al. Engineered AAVs for efficient noninvasive gene delivery to the central and peripheral nervous systems. Nat. Neurosci.20, 1172–1179 (2017). - PMC - PubMed

Publication types