

Identification of lncRNA-miRNA-mRNA Networks in the Lenticular Nucleus Region of the Brain Contributes to Hepatolenticular Degeneration Pathogenesis and Therapy
- PMID: 37759104
- PMCID: PMC10896925
- DOI: 10.1007/s12035-023-03631-1
Identification of lncRNA-miRNA-mRNA Networks in the Lenticular Nucleus Region of the Brain Contributes to Hepatolenticular Degeneration Pathogenesis and Therapy
Abstract
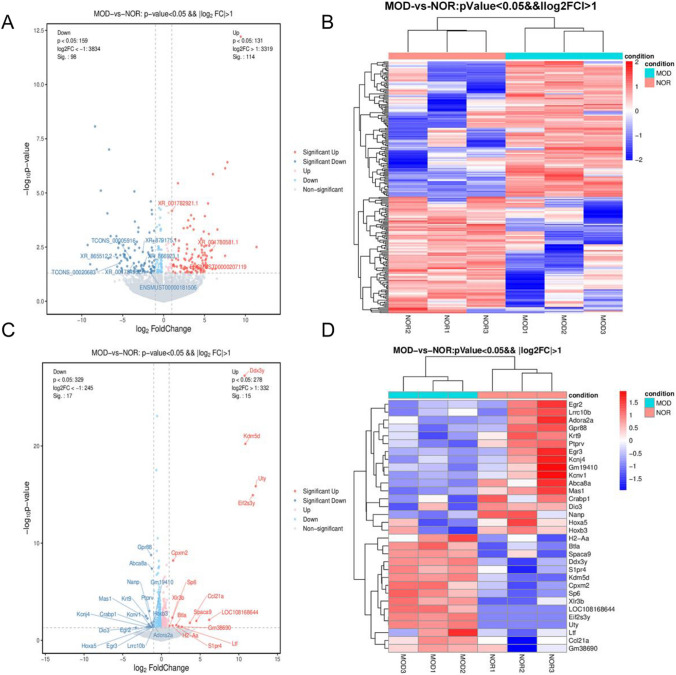
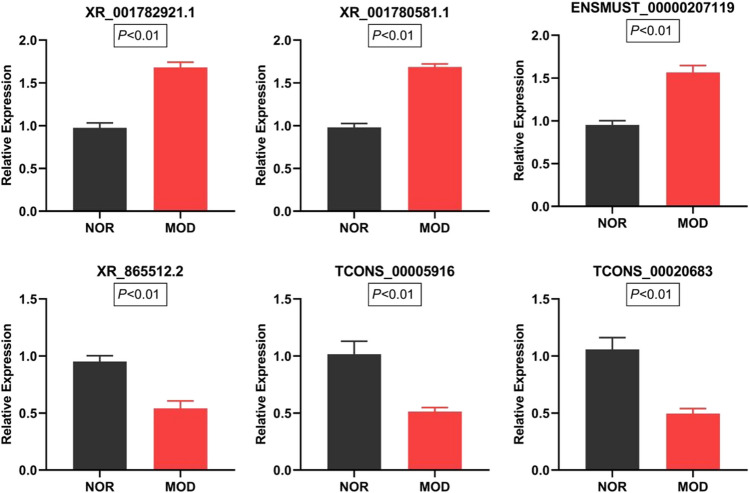
Long non-coding RNAs (lncRNAs) are a recently discovered group of non-coding RNAs that play a crucial role in the regulation of various human diseases, especially in the study of nervous system diseases which has garnered significant attention. However, there is limited knowledge on the identification and function of lncRNAs in hepatolenticular degeneration (HLD). The objective of this study was to identify novel lncRNAs and determine their involvement in the networks associated with HLD. We conducted a comprehensive analysis of RNA sequencing (RNA-seq) data, reverse transcription-quantitative polymerase chain reaction (RT-qPCR), and computational biology to identify novel lncRNAs and explore their potential mechanisms in HLD. We identified 212 differently expressed lncRNAs, with 98 upregulated and 114 downregulated. Additionally, 32 differently expressed mRNAs were found, with 15 upregulated and 17 downregulated. We obtained a total of 1131 pairs of co-expressed lncRNAs and mRNAs by Pearson correlation test and prediction and annotation of the lncRNA-targeted miRNA-mRNA network. The differential lncRNAs identified in this study were found to be involved in various biological functions and signaling pathways. These include translational initiation, motor learning, locomotors behavior, dioxygenase activity, integral component of postsynaptic membrane, neuroactive ligand-receptor interaction, nuclear factor-kappa B (NF-κB) signaling pathway, cholinergic synapse, sphingolipid signaling pathway, and Parkinson's disease signaling pathway, as revealed by the Gene Ontology (GO) and Kyoto Encyclopedia of Genes and Genomes (KEGG) pathway analyses. Six lncRNAs, including XR_001782921.1 (P < 0.01), XR_ 001780581.1 (P < 0.01), ENSMUST_00000207119 (P < 0.01), XR_865512.2 (P < 0.01), TCONS_00005916 (P < 0.01), and TCONS_00020683 (P < 0.01), showed significant differences in expression levels between the model group and normal group by RT-qPCR. Among these, four lncRNAs (TCONS_00020683, XR_865512.2, XR_001780581.1, and ENSMUST00000207119) displayed a high degree of conservation. This study provides a unique perspective for the pathogenesis and therapy of HLD by constructing the lncRNA-miRNA-mRNA network. This insight provides a foundation for future exploration in this field.
Keywords: Hepatolenticular degeneration; Long non-coding RNA; ceRNA.
© 2023. The Author(s).
Conflict of interest statement
The authors declare no competing interests.
Figures


Similar articles
-
Comprehensive analysis of lncRNA-miRNA-mRNA networks during osteogenic differentiation of bone marrow mesenchymal stem cells.BMC Genomics. 2022 Jun 7;23(1):425. doi: 10.1186/s12864-022-08646-x. BMC Genomics. 2022. PMID: 35672672 Free PMC article.
-
Comprehensive Analysis of lncRNA Expression Pattern and lncRNA-miRNA-mRNA Network in a Rat Model With Cavernous Nerve Injury Erectile Dysfunction.J Sex Med. 2020 Sep;17(9):1603-1617. doi: 10.1016/j.jsxm.2020.05.008. Epub 2020 Jul 13. J Sex Med. 2020. PMID: 32675050
-
Comprehensive analysis of the coding and non-coding RNA transcriptome expression profiles of hippocampus tissue in tx-J animal model of Wilson's disease.Sci Rep. 2023 Jun 7;13(1):9252. doi: 10.1038/s41598-023-36503-8. Sci Rep. 2023. PMID: 37286730 Free PMC article.
-
Pathogenetic Significance of Long Non-Coding RNAs in the Development of Thoracic and Abdominal Aortic Aneurysms.Biochemistry (Mosc). 2024 Jan;89(1):130-147. doi: 10.1134/S0006297924010085. Biochemistry (Mosc). 2024. PMID: 38467550 Review.
-
Emerging roles of long non-coding RNAs in human epilepsy.Epilepsia. 2024 Jun;65(6):1491-1511. doi: 10.1111/epi.17937. Epub 2024 Apr 30. Epilepsia. 2024. PMID: 38687769 Free PMC article. Review.
Cited by
-
Psychiatric Symptoms in Wilson's Disease-Consequence of ATP7B Gene Mutations or Just Coincidence?-Possible Causal Cascades and Molecular Pathways.Int J Mol Sci. 2024 Nov 18;25(22):12354. doi: 10.3390/ijms252212354. Int J Mol Sci. 2024. PMID: 39596417 Free PMC article. Review.
-
An Epigenetic Manifestation of Alzheimer's Disease: DNA Methylation.Actas Esp Psiquiatr. 2024 Jun;52(3):365-374. doi: 10.62641/aep.v52i3.1595. Actas Esp Psiquiatr. 2024. PMID: 38863055 Free PMC article. Review.
References
MeSH terms
Substances
Grants and funding
LinkOut - more resources
Full Text Sources
Medical
Molecular Biology Databases
