

Analytical methods for identifying sequences of utilization in health data: a scoping review
- PMID: 37759162
- PMCID: PMC10523647
- DOI: 10.1186/s12874-023-02019-y
Analytical methods for identifying sequences of utilization in health data: a scoping review
Abstract
Background: Healthcare, as with other sectors, has undergone progressive digitalization, generating an ever-increasing wealth of data that enables research and the analysis of patient movement. This can help to evaluate treatment processes and outcomes, and in turn improve the quality of care. This scoping review provides an overview of the algorithms and methods that have been used to identify care pathways from healthcare utilization data.
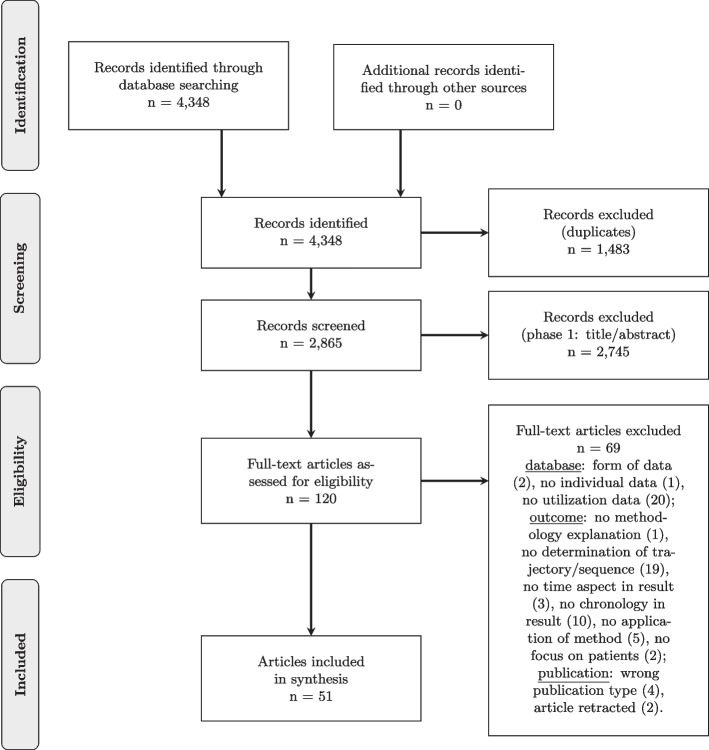
Method: This review was conducted according to the methodology of the Joanna Briggs Institute and the Preferred Reporting Items for Systematic Reviews Extension for Scoping Reviews (PRISMA-ScR) Checklist. The PubMed, Web of Science, Scopus, and EconLit databases were searched and studies published in English between 2000 and 2021 considered. The search strategy used keywords divided into three categories: the method of data analysis, the requirement profile for the data, and the intended presentation of results. Criteria for inclusion were that health data were analyzed, the methodology used was described and that the chronology of care events was considered. In a two-stage review process, records were reviewed by two researchers independently for inclusion. Results were synthesized narratively.
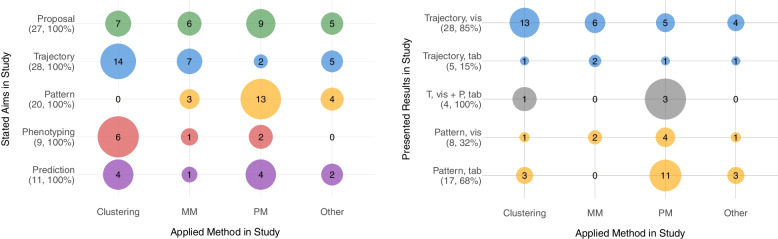
Results: The literature search yielded 2,865 entries; 51 studies met the inclusion criteria. Health data from different countries ([Formula: see text]) and of different types of disease ([Formula: see text]) were analyzed with respect to different care events. Applied methods can be divided into those identifying subsequences of care and those describing full care trajectories. Variants of pattern mining or Markov models were mostly used to extract subsequences, with clustering often applied to find care trajectories. Statistical algorithms such as rule mining, probability-based machine learning algorithms or a combination of methods were also applied. Clustering methods were sometimes used for data preparation or result compression. Further characteristics of the included studies are presented.
Conclusion: Various data mining methods are already being applied to gain insight from health data. The great heterogeneity of the methods used shows the need for a scoping review. We performed a narrative review and found that clustering methods currently dominate the literature for identifying complete care trajectories, while variants of pattern mining dominate for identifying subsequences of limited length.
Keywords: Care pathway; Claims data; Data mining method; Health data; Patient pathway; Pattern mining; Scoping review; Sequences.
© 2023. The Author(s).
Conflict of interest statement
The authors declare that they have no conflict of interests. Prof. Leonie Sundmacher was Co-author of one included study [57]. The authors made every effort to treat and analyze all studies equally.
Figures
Similar articles
-
Beyond the black stump: rapid reviews of health research issues affecting regional, rural and remote Australia.Med J Aust. 2020 Dec;213 Suppl 11:S3-S32.e1. doi: 10.5694/mja2.50881. Med J Aust. 2020. PMID: 33314144
-
The Effectiveness of Integrated Care Pathways for Adults and Children in Health Care Settings: A Systematic Review.JBI Libr Syst Rev. 2009;7(3):80-129. doi: 10.11124/01938924-200907030-00001. JBI Libr Syst Rev. 2009. PMID: 27820426
-
How has the impact of 'care pathway technologies' on service integration in stroke care been measured and what is the strength of the evidence to support their effectiveness in this respect?Int J Evid Based Healthc. 2008 Mar;6(1):78-110. doi: 10.1111/j.1744-1609.2007.00098.x. Int J Evid Based Healthc. 2008. PMID: 21631815
-
Strategies used for childhood chronic functional constipation: the SUCCESS evidence synthesis.Health Technol Assess. 2024 Jan;28(5):1-266. doi: 10.3310/PLTR9622. Health Technol Assess. 2024. PMID: 38343084 Free PMC article.
-
Public sector reforms and their impact on the level of corruption: A systematic review.Campbell Syst Rev. 2021 May 24;17(2):e1173. doi: 10.1002/cl2.1173. eCollection 2021 Jun. Campbell Syst Rev. 2021. PMID: 37131927 Free PMC article. Review.
Cited by
-
Palliative care pathways in Amyotrophic Lateral Sclerosis (ALS): a sequence analysis of health claims data.BMC Palliat Care. 2025 Jul 14;24(1):200. doi: 10.1186/s12904-025-01843-x. BMC Palliat Care. 2025. PMID: 40660191 Free PMC article.
-
Exploring patterns in pediatric type 1 diabetes care and the impact of socioeconomic status.BMC Med. 2025 Apr 23;23(1):229. doi: 10.1186/s12916-025-04049-3. BMC Med. 2025. PMID: 40264139 Free PMC article.
-
Exploring heterogeneity in coxarthrosis medication use patterns before total hip replacement: a State Sequence Analysis.BMJ Open. 2024 Sep 17;14(9):e080348. doi: 10.1136/bmjopen-2023-080348. BMJ Open. 2024. PMID: 39289022 Free PMC article.
-
Sequence Analysis to Phenotype Health Care Patterns in Adults With Musculoskeletal Conditions Using Primary Care Electronic Health Records.Arthritis Care Res (Hoboken). 2025 Jul;77(7):906-915. doi: 10.1002/acr.25514. Epub 2025 Apr 19. Arthritis Care Res (Hoboken). 2025. PMID: 40025785 Free PMC article.
-
Improving community health centres with big data analytics: A systematic literature review on adoption.Digit Health. 2025 May 6;11:20552076251314548. doi: 10.1177/20552076251314548. eCollection 2025 Jan-Dec. Digit Health. 2025. PMID: 40351847 Free PMC article. Review.
References
-
- Rydning DRJGJ, Reinsel J, Gantz J. The digitization of the world from edge to core, vol. 16. Framingham: International Data Corporation; 2018. p. 1–28.
-
- Kreis K, Neubauer S, Klora M, Lange A, Zeidler J. Status and perspectives of claims data analyses in germany—a systematic review. Health Pol (Amsterdam, Netherlands). 2016;120(2):213–26. 10.1016/j.healthpol.2016.01.007. - PubMed
-
- Blin P, Lassalle R, Thurin N, Bosco-Levy P, Droz-Perroteau C, Moore N. Snds, the french nationwide claims database: A powerful tool for pharmacoeconomy and pharmacoepidemiology. Value Health 21. 10.1016/j.jval.2018.09.221
-
- Vanasse A, Courteau J, Courteau M, Benigeri M., Chiu YM, Dufour I, Couillard S., Larivee, P., Hudon, C.: Healthcare utilization after a first hospitalization for copd: a new approach of state sequence analysis based on the ‘6w’ multidimensional model of care trajectories. BMC Health Serv Res 2020;20(1). 10.1186/s12913-020-5030-0 - PMC - PubMed
Publication types
MeSH terms
LinkOut - more resources
Full Text Sources
Miscellaneous
