. 2023 Oct 10;57(40):14892-14903.
doi: 10.1021/acs.est.3c05207. Epub 2023 Sep 27.

Effects of In Utero PFOS Exposure on Epigenetics and Metabolism in Mouse Fetal Livers

Affiliations

Effects of In Utero PFOS Exposure on Epigenetics and Metabolism in Mouse Fetal Livers

Tsz Chun Ho et al. Environ Sci Technol. .

Abstract

Prenatal exposure to perfluorooctanesulfonate (PFOS) increases fetus' metabolic risk; however, the investigation of the underlying mechanism is limited. In this study, pregnant mice in the gestational days (GD, 4.5-17.5) were exposed to PFOS (0.3 and 3 μg/g of body weight). At GD 17.5, PFOS perturbed maternal lipid metabolism and upregulated metabolism-regulating hepatokines (Angptl4, Angptl8, and Selenop). Mass-spectrometry imaging and whole-genome bisulfite sequencing revealed, respectively, selective PFOS localization and deregulation of gene methylation in fetal livers, involved in inflammation, glucose, and fatty acid metabolism. PCR and Western blot analysis of lipid-laden fetal livers showed activation of AMPK signaling, accompanied by significant increases in the expression of glucose transporters (Glut2/4), hexose-phosphate sensors (Retsat and ChREBP), and the key glycolytic enzyme, pyruvate kinase (Pk) for glucose catabolism. Additionally, PFOS modulated the expression levels of PPARα and PPARγ downstream target genes, which simultaneously stimulated fatty acid oxidation (Cyp4a14, Acot, and Acox) and lipogenesis (Srebp1c, Acaca, and Fasn). Using human normal hepatocyte (MIHA) cells, the underlying mechanism of PFOS-elicited nuclear translocation of ChREBP, associated with a fatty acid synthesizing pathway, was revealed. Our finding implies that in utero PFOS exposure altered the epigenetic landscape associated with dysregulation of fetal liver metabolism, predisposing postnatal susceptibility to metabolic challenges.

Keywords: AMPK; ChREBP; MIHA; MS-imaging; PPAR; hepatokine; whole-genome bisulfite sequencing.


Conflict of interest statement

The authors declare no competing financial interest.

Figures
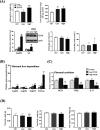
Figure 1
Figure 1
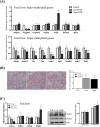
Effect of in utero PFOS exposure on maternal metabolism, placental and fetal body weights, and placental cytokine profiles at gestational day 17.5. (A) Metabolic measurement of maternal mice: the exposure caused an increase of maternal liver weights and triglyceride levels (upper panel) and an increased expression of Cyp4a14, Lpl, and Cd36 (lower panel). There was no significant change in maternal fasting serum glucose and fatty acid levels among the control and PFOS-exposed groups. (B) Maternal hepatokines: PFOS elicited a significant upregulation of Angptl4, Angptl8, and Selenop and a downregulation of Angptl6. (C) Placental cytokine profiles: a significant reduction in the expression of MCP-1, TNF-β, and IL-15 levels at the high-dose of PFOS exposure was noted. (D) Placental and fetal body weights: a significant reduction in placental and fetal body weights was noted at the high-dose of PFOS exposure. There was no noticeable change in the fetal relative liver weights. Data were presented as the mean ± SD *P (treatment vs control), #P (low-dose vs high-dose) < 0.05; **P and ##P denote <0.01.
Figure 2
Figure 2
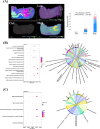
AFADESI-mass spectrophotometry imaging of PFOS-distribution of fetuses and whole-genome bisulfite sequencing (WGBS) of fetal livers at gestational day 17.5. (A) AFADESI-MS imaging: left-top corner, the annotation of the major tissues of the control fetus. Ion image of PFOS distribution in different fetal regions in control and PFOS-exposed groups (left-bottom and right-top and bottom). A box and dot plot showed the signal intensity of PFOS (498.92769 m/z ± 0.05 Da) in the cross-section of whole fetuses. The box represents the lower and upper quantiles. Signal intensities are represented by blue dots, while outliers are represented by red dots. (B) WGBS-gene ontology (GO): the biological functions and signaling pathways of fetal hepatic genes, commonly identified in both low- and high-dose PFOS-exposed groups. The left panel: an enrichment analysis highlighted the involvement of PFOS-elicited DMR genes in biological processes related to fatty acid and glucose metabolism and inflammatory responses. The rich factor for each functional term (y-axis) was calculated as the number of DMR genes annotated to the terms divided by the number of reference genes annotated to those terms. The size of the bubble represented the number of DMR genes. The color of the bubble represented the significance of the processes. The right panel: the Circos plot showed the relationships and interactions of DMR genes in the highlighted biological processes. Along the circle’s circumference, different data tracks are displayed in a circular layout. A track displays the gene name, and another displays functional categories or pathways. (C) WGBS-KEGG analysis: the left panel: an enrichment analysis highlighted the involvement of PFOS-elicited DMR genes in cholesterol metabolism, chemical carcinogenesis, type II diabetes mellitus, and the AMPK pathway. The right panel: the Circos plot showed the involvement of DMRs in the highlighted signaling pathways.
Figure 3
Figure 3
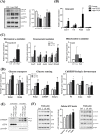
Differential expression of hypo-, hyper-methylated, and PPAR genes in fetal livers at gestational day 17.5. (A) Validation of WGBS data: analysis of differentially methylated gene clusters in fetal livers commonly identified in both low- and high-dose in utero PFOS exposure using real-time PCR. The upper panel: there were significant elevated expression levels of the hypo-methylated genes. The lower panel, the expression levels of hyper-methylated genes were significantly reduced. (B) Significant increases in the number of hepatic microvesicular lipid droplets were noted in PFOS-exposed fetuses. (C) Expression profiles of PPARs and PGC1α in fetal livers. Left panel: A significant increase but a decrease in the expression levels of Pparγ and Pgc1α, respectively, were noted in high-dose PFOS-exposed groups. Right panel: Western blot showed a significant increase of PPARγ. Data were presented as the mean ± SD *P (treatment vs control), #P (low-dose vs high-dose) < 0.05; **P and ##P denote <0.01.
Figure 4
Figure 4
In utero PFOS exposure perturbed energy sensing, inflammation, and glucose-fatty acid metabolic gene expression in fetal livers at gestational day 17.5 and in the human normal liver cell-line. (A) PFOS exposure significantly increased and decreased pAMPK/AMPK and p-mTOR/mTOR levels, respectively, in the livers of fetuses. (B) The master markers of inflammation Icam-1, interleukin 6 (Il6), and the antioxidant enzyme peroxiredoxin 6 (Prdx6) were significantly increased in PFOS-exposed groups. (C) Hepatic mRNA expression of key genes in microsomal ω- and peroxisomal β-oxidation was significant upregulation in PFOS-exposed groups. (D) The expression of rate-limiting metabolic genes involved in glucose transport [Slc2a2 (Glut2), Slc2a4 (Glut4)], glucose-sensing (Retsat, ChREBP), glycolytic enzyme (pyruvate kinase, Pk), and lipogenesis (Srebp1c, Acaca) in the fetal livers was significantly upregulated in PFOS-exposed groups. (E) Human normal hepatocyte cells (MIHA): PFOS treatment increased the nuclear translocation of ChREBP, a glucose-sensing transcription factor. As the loading controls, cytosolic and nuclear markers are total ERK and laminB1, respectively. (F) Human normal hepatocyte cells (MIHA): a significant increase in ATP levels was associated with upregulation of glycolytic and fatty acid synthesis enzymes in PFOS treatment. Data were presented as the mean ± SD *P (treatment vs control), #P (low-dose vs high-dose) < 0.05; **P and ##P denote <0.01.

References

    1. Rahman M. L.; Zhang C.; Smarr M. M.; Lee S.; Honda M.; Kannan K.; Tekola-Ayele F.; Buck Louis G. M. Persistent organic pollutants and gestational diabetes: A multi-center prospective cohort study of healthy US women. Environ. Int. 2019, 124, 249–258. 10.1016/j.envint.2019.01.027. - DOI - PubMed
    1. Yan D.; Jiao Y.; Yan H.; Liu T.; Yan H.; Yuan J. Endocrine-disrupting chemicals and the risk of gestational diabetes mellitus: a systematic review and meta-analysis. Environ. Health 2022, 21 (1), 53.10.1186/s12940-022-00858-8. - DOI - PMC - PubMed
    1. Braun J. M. Enhancing Regulations to Reduce Exposure to PFAS — Federal Action on “Forever Chemicals”. N. Engl. J. Med. 2023, 388 (21), 1924–1926. 10.1056/NEJMp2303333. - DOI - PubMed
    1. Frisbee S. J.; Brooks A. P. Jr.; Maher A.; Flensborg P.; Arnold S.; Fletcher T.; Steenland K.; Shankar A.; Knox S. S.; Pollard C.; Halverson J. A.; Vieira V. M.; Jin C.; Leyden K. M.; Ducatman A. M. The C8 health project: design, methods, and participants. Environ. Health Perspect. 2009, 117 (12), 1873–1882. 10.1289/ehp.0800379. - DOI - PMC - PubMed
    1. Gaber N.; Bero L.; Woodruff T. J. The Devil they Knew: Chemical Documents Analysis of Industry Influence on PFAS Science. Ann. Glob. Health 2023, 89 (1), 37.10.5334/aogh.4013. - DOI - PMC - PubMed