. 2023 Sep 27;24(1):574.
doi: 10.1186/s12864-023-09659-w.

Defining super-enhancers by highly ranked histone H4 multi-acetylation levels identifies transcription factors associated with glioblastoma stem-like properties

Affiliations

Defining super-enhancers by highly ranked histone H4 multi-acetylation levels identifies transcription factors associated with glioblastoma stem-like properties

Nando D Das et al. BMC Genomics. .

Abstract

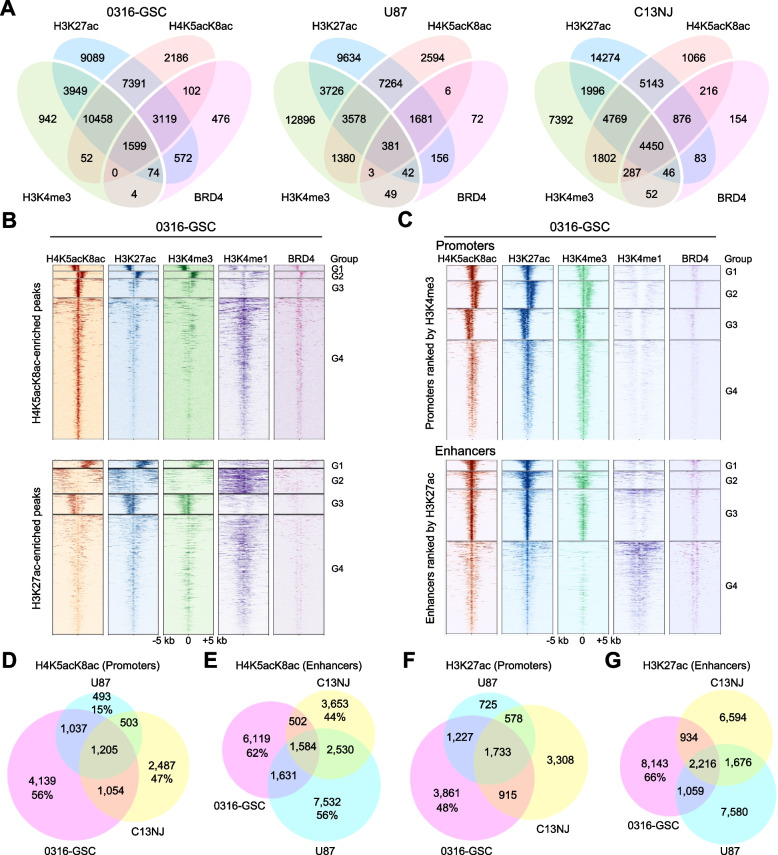
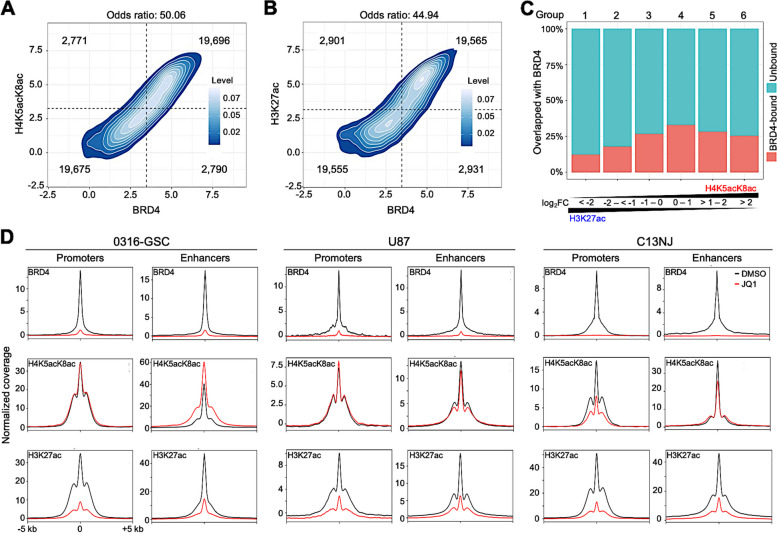
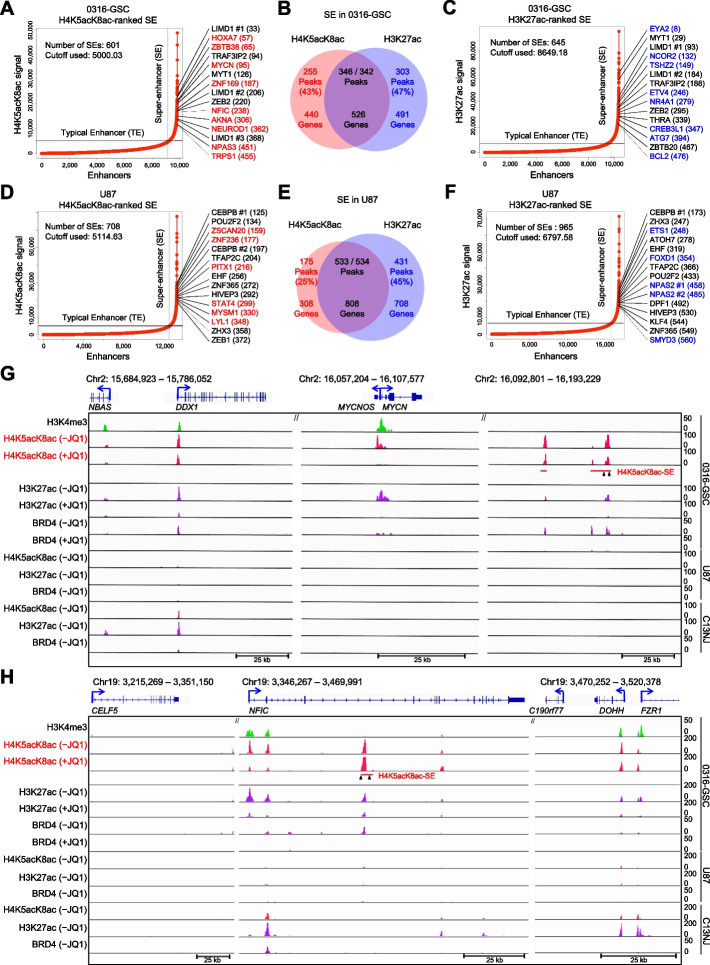
Background: Super-enhancers (SEs), which activate genes involved in cell-type specificity, have mainly been defined as genomic regions with top-ranked enrichment(s) of histone H3 with acetylated K27 (H3K27ac) and/or transcription coactivator(s) including a bromodomain and extra-terminal domain (BET) family protein, BRD4. However, BRD4 preferentially binds to multi-acetylated histone H4, typically with acetylated K5 and K8 (H4K5acK8ac), leading us to hypothesize that SEs should be defined by high H4K5acK8ac enrichment at least as well as by that of H3K27ac.

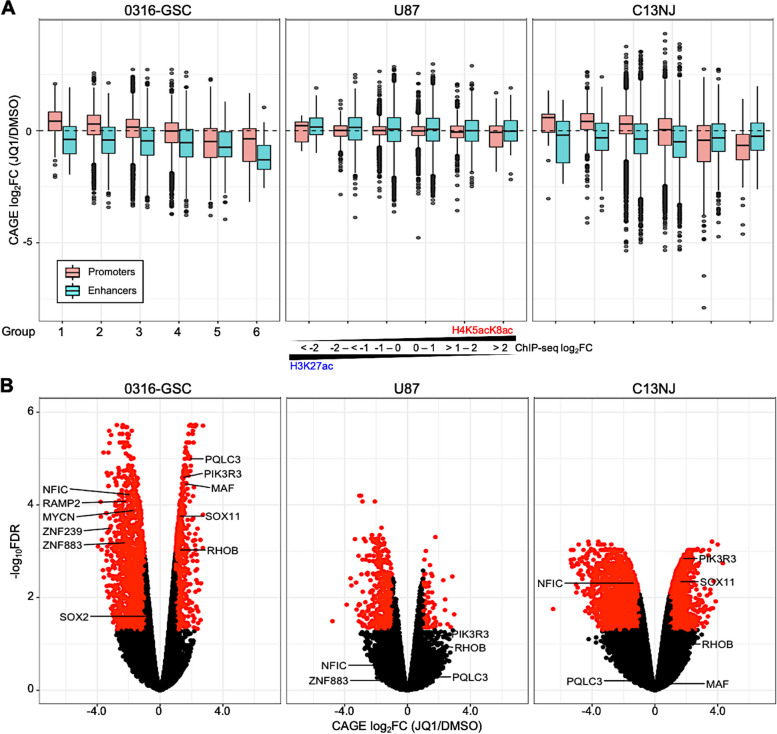
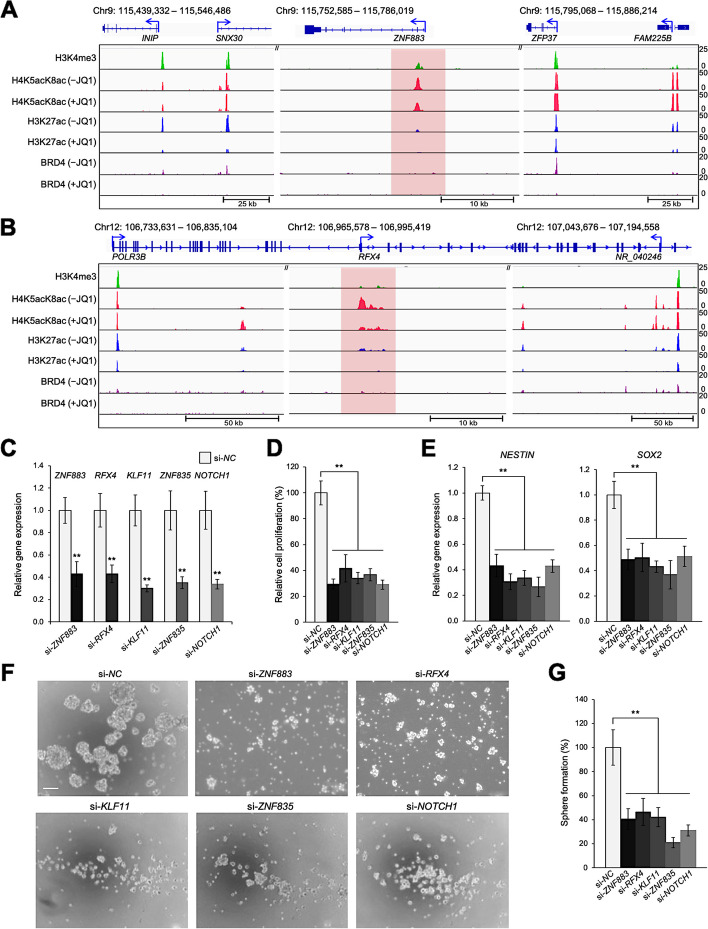
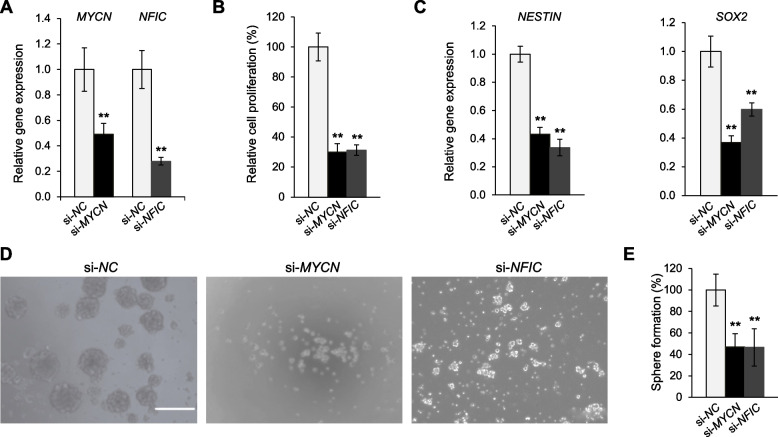
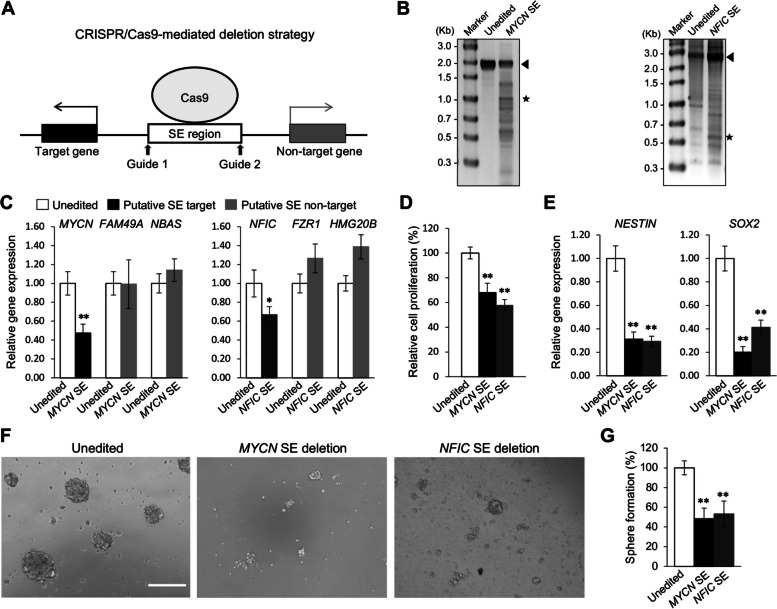
Results: Here, we conducted genome-wide profiling of H4K5acK8ac and H3K27ac, BRD4 binding, and the transcriptome by using a BET inhibitor, JQ1, in three human glial cell lines. When SEs were defined as having the top ranks for H4K5acK8ac or H3K27ac signal, 43% of H4K5acK8ac-ranked SEs were distinct from H3K27ac-ranked SEs in a glioblastoma stem-like cell (GSC) line. CRISPR-Cas9-mediated deletion of the H4K5acK8ac-preferred SEs associated with MYCN and NFIC decreased the stem-like properties in GSCs.

Conclusions: Collectively, our data highlights H4K5acK8ac's utility for identifying genes regulating cell-type specificity.

Keywords: Epigenetics; Histone acetylation; Inhibitor; Nucleosome; Tumorigenesis.


Conflict of interest statement

BK took a position with AstraZeneca R&D during the submission of this manuscript. AstraZeneca R&D was not involved at any stage of the work presented here and there is no conflict of interest related to AstraZeneca R&D for this work. BK may own stock options of AstraZeneca. The authors declare no competing interests.

Figures

Fig. 1
Fig. 1
Enrichment of H4K5acK8ac at promoters and enhancers across glial cell lines. A Venn diagrams showing overlap of ChIP-seq peaks of H4K5acK8ac with a known enhancer mark (H3K27ac), a known promoter mark (H3K4me3), and BRD4 in 0316-GSC, U87, and C13NJ cell lines. In 0316-GSC cells, 90% of H4K5acK8ac-enriched peaks intersected with 65% of H3K27ac and 46% of H4K5acK8ac with 74% of H3K4me3. B and C Heatmaps representing different ChIP-seq datasets (H4K5acK8ac, H3K27ac, H3K4me3, H3K4me1, and BRD4) in 0316-GSC cells. Data are from within ± 5-kb from the summit of H4K5acK8ac-enriched peaks (upper, B) and H3K27ac-enriched peaks (lower, B), and promoters defined by H3K4me3 at the promoters (upper, C) and enhancers defined by H3K27ac located outside a promoter (lower, C). Each row represents a single peak. Color density indicates the average enrichment of each mark at the selected regions. H4K5acK8ac- or H3K27ac-enriched peaks and promoters or enhancers are each clustered into four groups (G1 to G4) according to the ChIP-seq profiles. DG Venn diagrams showing overlap of ChIP-seq peaks at promoters and enhancers. H4K5acK8ac-enriched promoters (D) and enhancers (E), and H3K27ac-enriched promoters (F) and enhancers (G) intersect across the three cell lines
Fig. 2
Fig. 2
Effect of JQ1 on H4K5acK8ac-enriched regulatory regions across glial cell lines. A and B Density plots showing the association between the normalized ChIP-seq signal of BRD4 binding and H4K5acK8ac (A) and H3K27ac (B) binding. Based on the signals, the regions were categorized into four groups (separated by dotted lines); the number representing weak and strong categories of compared marks in each group is given. A higher odds ratio of binding means a higher association. A Fisher exact test was used to test whether the odds ratio was equal to 1. C Colocalization of BRD4 with acetylated peaks. The percentages of BRD4 ChIP-seq peaks (y-axis) that cover H4K5acK8ac- or H3K27ac-enriched peaks (x-axis) in 0316-GSC cells are shown: red bars, BRD4-bound; blue bars, BRD-unbound; FC, relative ChIP-seq signal of H4K5acK8ac over H3K27ac. D Effects of JQ1 on the enrichment of BRD4 (top), H4K5acK8ac (middle), and H3K27ac (bottom) at promoters and enhancers. ChIP-seq meta-profiles for dimethylsulfoxide (DMSO) (black) and JQ1-treated (red) cells represent the average read counts at reads per million (RPM) of ± 5-kb regions from the summit of BRD4-, H4K5acK8ac-, and H3K27ac-enrichment at promoters and enhancers
Fig. 3
Fig. 3
Transcriptional changes of genes with H4K5acK8ac-preferred promoters upon JQ1 treatment. A Relative expression of genes upon JQ1 treatment. Box plots of gene expression fold changes (FCs) for 24-h JQ1 treatment relative to DMSO (vehicle control) are shown for H3K27ac-preferred (Groups 1–3) and H4K5acK8ac-preferred (Groups 4–6; see Methods) promoters (peaks within 1-kb of the transcription start site (TSS) and enhancers (peaks > 1-kb from the TSS) in 0316-GSC, U87, and C13NJ cells (n = 2 biological replicates for each histone modification and FC value of each gene is the average of the FCs of the two biological replicates). B Volcano plot showing the expression differences of H4K5acK8ac-preferred differentially regulated genes in 0316-GSC cells upon JQ1 treatment. The x and y-axes show log2FC values and log10 of the false discovery rate (FDR) values, respectively. A combination of thresholds for log2FC values and for − log10FDR values are used to classify the genes as significant. Black dots represent genes that were not statistically significant
Fig. 4
Fig. 4
Disruption of glioblastoma stem-like properties by siRNA knockdown of genes with H4K5acK8ac-preferred promoters. A and B Comparative ChIP-seq occupancy tracks of H3K4me3, H4K5acK8ac, H3K27ac, and BRD4 at representative loci, in the presence or absence of JQ1. The promoter regions of ZNF883 (A) and RFX4 (B) were specifically enriched with H4K5acK8ac in 0316-GSC cells. The unique enrichment of H4K5acK8ac at promoters is highlighted in red. ChIP-seq reads were averaged from two biological replicates. CE Disruption of gene expression by siRNA knockdown. C Efficiencies of siRNA knockdown of genes from Group 6 with H4K5acK8ac-preferred promoters and the GSC-specific control marker (NOTCH1) are compared with the negative control (si-NC) in 0316-GSC cells (n = 3). D Short-term proliferation assay of 0316-GSC cells subjected to siRNA knockdown. Cell proliferation rates at 7 days after siRNA knockdown of the selected genes are shown (n = 6). E Expression of stem cell marker genes, NESTIN and SOX2, following siRNA knockdown of the selected genes (n = 3). F and G Sphere formation assay following siRNA knockdown of the selected genes. F Phase-contrast images of 0316-GSC cells treated with target-specific siRNA. Images are representative of three independent experiments. Scale bar, 50 μm. G In vitro sphere formation efficiency of 0316-GSC cells treated with siRNA for 2 weeks (n = 3). CE and G Data are means ± SEM **P < 0.01 (two-tailed Student’s t-test)
Fig. 5
Fig. 5
Defining super-enhancers by H4K5acK8ac enrichment ranking. Enhancers in 0316-GSC (AC) and U87 (DF) cells were ranked by H4K5acK8ac or H3K27ac signal level by using the ROSE algorithm; those with extremely high signals were defined as super-enhancers (SEs) (see Methods for threshold calculations). JQ1-downregulated transcription factor candidate genes with H4K5acK8ac- (red) or H3K27ac-preferred (blue) SEs are shown. Venn diagrams show the number of peaks and associated genes with H4K5acK8ac- or H3K27ac-preferred SEs or both (the intersection, purple) for each cell line. G and H Representative ChIP-seq occupancy tracks of genes with H4K5acK8ac-preferred SEs (MYCN and NFIC) in 0316-GSC, U87, and C13NJ cells. Arrowheads under the SE bar show the position for CRISPR-Cas9–mediated deletion of the SE region. ChIP-seq reads were averaged from two biological replicates
Fig. 6
Fig. 6
Disruption of glioblastoma stem-like properties by siRNA knockdown of genes with H4K5acK8ac-preferred super-enhancers. AC Disruption of genes by siRNA knockdown. A siRNA knockdown of MYCN and NFIC compared with the negative control (si-NC) in 0316-GSC cells (n = 3). B Short-term proliferation assay of 0316-GSC cells subjected to siRNA knockdown. Cell proliferation rates at 7 days after siRNA knockdown of MYCN and NFIC are shown (n = 6). C Expression of stem cell marker genes, NESTIN (left) and SOX2 (right), following siRNA knockdown of MYCN and NFIC (n = 3). D Sphere formation assay. Phase-contrast images of 0316-GSC cells treated with si-MYCN, si-NFIC, or si-NC for 2 weeks. Images are representative of three independent experiments. Scale bar, 50 μm. E Quantitation of sphere formation results for 0316-GSC cells (n = 3). AC and E Data are means ± SEM **P < 0.01 (two-tailed Student’s t-test)
Fig. 7
Fig. 7
Genes associated with H4K5acK8ac-preferred super-enhancers are involved in the glioblastoma stem-like properties. A Schematic representation showing the CRISPR-Cas9–mediated genome editing approach for SEs. Guide indicates gRNA. B Deletion of the H4K5acK8ac-preferred SEs associated with MYCN and NFIC in 0316-GSC cells. Expected band sizes of genomic DNA for unedited (arrowhead) and SE-edited samples (asterisk) are marked. Images of the uncropped gel are shown in Figure S9A. CG Biological effects of deletion of the H4K5acK8ac-preferred SEs associated with MYCN and NFIC in 0316-GSC cells. C Quantitative reverse-transcription PCR analysis of the expression of MYCN and NFIC and non-target genes following SE deletion (n = 3). D Cell proliferation rates at 4 days after SE deletion (n = 4). E Expression of stem cell marker genes, NESTIN (left) and SOX2 (right), at 4 days after SE deletion (n = 3). F Phase-contrast images of 0316-GSC cells at 14 days after SE deletion. Images are representative of three independent experiments. Scale bar, 50 μm. G In vitro sphere formation efficiency of 0316-GSC cells at 2 weeks after SE deletion (n = 3). CE and G Data are means ± SEM *P < 0.05, **P < 0.01 (two-tailed Student’s t-test)

References

    1. Burton A, Torres-Padilla ME. Chromatin dynamics in the regulation of cell fate allocation during early embryogenesis. Nat Rev Mol Cell Biol. 2014;15:723–734. - PubMed
    1. Heintzman ND, Hon GC, Hawkins RD, Kheradpour P, Stark A, Harp LF, Ye Z, Lee LK, Stuart RK, Ching CW, et al. Histone modifications at human enhancers reflect global cell-type-specific gene expression. Nature. 2009;459:108–112. - PMC - PubMed
    1. Hnisz D, Abraham BJ, Lee TI, Lau A, Saint-Andre V, Sigova AA, Hoke HA, Young RA. Super-enhancers in the control of cell identity and disease. Cell. 2013;155:934–947. - PMC - PubMed
    1. Spitz F, Furlong EE. Transcription factors: from enhancer binding to developmental control. Nat Rev Genet. 2012;13:613–626. - PubMed
    1. Kim S, Shendure J. Mechanisms of interplay between transcription factors and the 3D genome. Mol Cell. 2019;76:306–319. - PubMed