. 2023 Sep 15;12(18):2280.
doi: 10.3390/cells12182280.

The Impact of Ca2+ on Intracellular Distribution of Hemoglobin in Human Erythrocytes

Affiliations

The Impact of Ca2+ on Intracellular Distribution of Hemoglobin in Human Erythrocytes

Leonid Livshits et al. Cells. .

Abstract

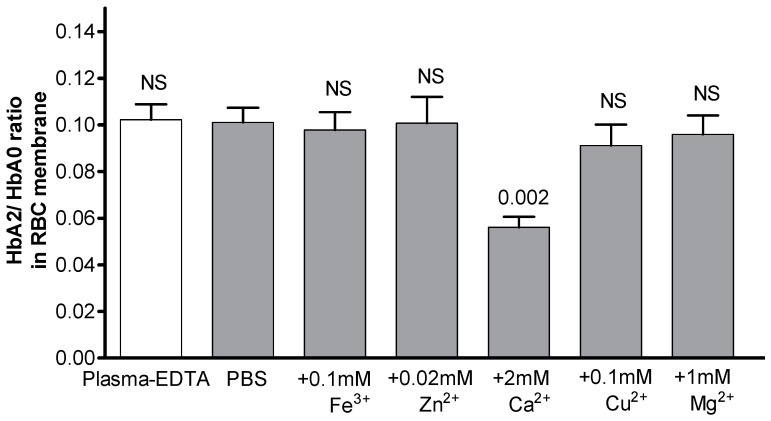
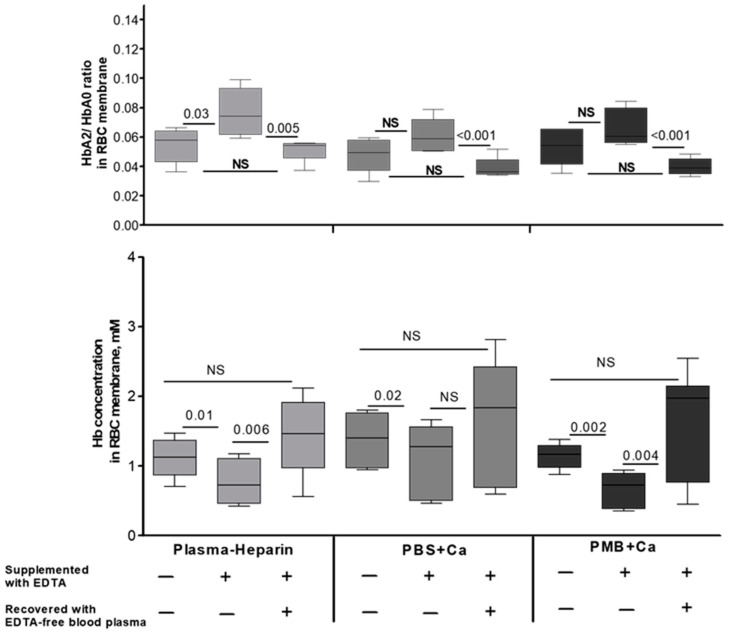
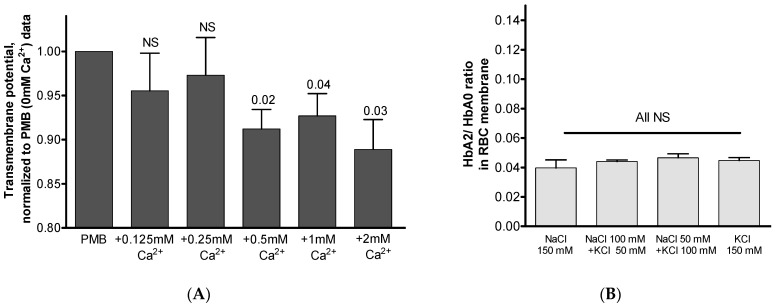
The membrane-bound hemoglobin (Hb) fraction impacts red blood cell (RBC) rheology and metabolism. Therefore, Hb-RBC membrane interactions are precisely controlled. For instance, the signaling function of membrane-bound deoxy-Hb and the structure of the docking sites in the cytosolic domain of the anion exchanger 1 (AE-1) protein are well documented; however, much less is known about the interaction of Hb variants with the erythrocyte's membrane. Here, we identified factors other than O2 availability that control Hb abundance in the membrane-bound fraction and the possible variant-specific binding selectivity of Hb to the membrane. We show that depletion of extracellular Ca2+ by chelators, or its omission from the extracellular medium, leads to membrane-bound Hb release into the cytosol. The removal of extracellular Ca2+ further triggers the redistribution of HbA0 and HbA2 variants between the membrane and the cytosol in favor of membrane-bound HbA2. Both effects are reversible and are no longer observed upon reintroduction of Ca2+ into the extracellular medium. Fluctuations of cytosolic Ca2+ also impact the pre-membrane Hb pool, resulting in the massive transfer of Hb to the cellular cytosol. We hypothesize that AE-1 is the specific membrane target and discuss the physiological outcomes and possible clinical implications of the Ca2+ regulation of the intracellular Hb distribution.

Keywords: calcium; hemoglobin A2; hemoglobin distribution; red blood cells.


Conflict of interest statement

The authors declare no conflict of interest.

Figures

Figure 1
Figure 1
Effects of routinely used anticoagulants and CPDA-1 storage solution on Hb isoform distribution in RBCs. HbA2/HbA0 ratios in intact RBCs, and RBC cytosol and membrane of samples collected into (A) EDTA-supplemented (n = 6) or (B) heparin-supplemented (n = 8) tubes are shown. (C) HbA2/HbA0 membrane pools in RBCs collected in K3EDTA (n = 21), heparin (n = 16), and citrate (n = 5) tubes from different individuals. The blood samples were kept at room temperature prior to the tests. The total time period between the blood collection and the measurement did not exceed four hours. RBCs were isolated from plasma and buffy coat via short 1700× g centrifugation. Immediately after that, the measurement of Hb isoforms in intact RBCs and the isolation of RBC membranes (as described above) were performed. Wilcoxon signed-rank test was used to test significance for HbA2/HbA0 pools in the membranes of RBCs preserved in various anticoagulants; data are presented as median ± CI. Note the minimal differences (non-significant, NS) between intact RBCs’ HbA2/HbA0 ratios. (D) CPDA-1 study (n = 6), where cells were incubated at 4 °C for increasing periods to a maximum of 28 days, and HbA2/HbA0 ratios for intact and membrane RBC fractions were evaluated. The paired-matched data presented in panels (A,B,D) (means ± SD) were found to be normally distributed and were compared using paired Student’s t-test. Distributions of Hb isoforms (HbF, HbA0, and HbA2) corresponding to the data at current and next Figures are provided in the Supplementary Data document.
Figure 2
Figure 2
Changes in Hb concentration and isoform distribution in the membranes of RBCs incubated in cell-maintenance solutions DPBS and PMB. For time–response studies (A), RBCs from the same individuals (n = 3) collected in EDTA tubes were exposed to the media for 24 h with sampling at different time points. The HbA2/HbA0 ratio in intact RBCs was 0.032 ± 0.001. The matched comparison for (B) HbA2/HbA0 in membrane pools (n = 6) and (C) Hb concentration (n = 6) in intact RBCs and RBC membranes exposed to EDTA plasma, DPBS, and PMB (2 h, 37 °C) are shown. Results are presented as means ± SD. Significance for each presented set was determined using paired Student’s t-test at p ≤ 0.05; NS, not significant. Mean HbA2/HbA0 ratio in intact RBCs was 0.028 ± 0.003, while bulk Hb concentration (±SD) in intact RBCs made up 19.4 ± 0.76 mM.
Figure 3
Figure 3
Ca2+, but not other bi-/trivalent cations, modifies membrane Hb isoform distribution. Cells from the same individuals were exposed to bi-/trivalent cation-free DPBS (i.e., commercially produced buffer with negligible contents of these electrolytes) supplemented with either Zn2+, Ca2+, Mg2+, Cu2+, or Fe3+ at near-physiological concentrations for 2 h at 37 °C prior to membrane isolation. Data are presented as means ± SD. Significance was determined for each presented set using paired Student’s t-test at p ≤ 0.05; NS, not significant. Mean HbA2/HbA0 ratio (±SD) in intact RBC was 0.030 ± 0.002.
Figure 4
Figure 4
Dose response to extracellular Ca2+ of Hb isoform ratio in RBC membrane. Erythrocytes were exposed to increasing concentrations of Ca2+ pre-added to Ca2+-free DPBS (n = 6) or PMB (n = 4). Data are presented as means ± SD. Significance compared to the corresponding ‘0 mM Ca2+’ set of DPBS or PMB was determined using paired Student’s t-test at p ≤ 0.05; NS, not significant. Non-paired Student’s t-test was used to determine the significance of HbA2/HbA0 membrane pools in DPBS- vs. PMB-exposed RBCs for the same Ca2+ concentrations. Except for the significance shown for the ‘2 mM Ca2+’ sets (p = 0.008), no substantial differences for supplemented Ca2+ concentrations were noted for independent measurements of maintenance in DPBS vs. PMB. Mean HbA2/HbA0 ratios (±SD) in intact RBCs exposed to DPBS and PMB were 0.029 ± 0.003 and 0.032 ± 0.003, respectively.
Figure 5
Figure 5
Involvement of additional extracellular factors in changes in membrane Hb concentration and isoform distribution under normo- and hypo-calcemic conditions. The erythrocytes were incubated in heparin-preserved plasma or 2 mM Ca2+-supplemented PBS or PMB (indicated by various colors) with or without 5 mM EDTA for 2 h at 37 °C. Erythrocytes were then quickly washed and incubated for an additional 2 h with EDTA-free plasma or buffers. The corresponding comparisons for the membrane-bound HbA2 pool (upper panel) and Hb concentration (bottom panel) are shown. Wilcoxon signed-rank test was used for statistical analysis; the data are presented as median ± CI. NS, not significant. Median HbA2/HbA0 ratio and Hb concentration in intact RBCs were 0.028 ± 0.003 and 20.7 ± 1.06 mM, respectively.
Figure 6
Figure 6
Extracellular Ca2+ has a minimal influence on RBC morphology and heterogeneity. The erythrocytes were preincubated in PMB with or without 2 mM Ca2+ or in Ca2+-supplemented PMB with or without 5 mM EDTA for 2 h at 37 °C. In the subsequent experiment, RBCs exposed to Ca2+-supplemented PMB with 5 mM EDTA were quickly washed with Ca2+-PMB and then incubated for another 2 h at 37 °C. In panels (A,B), pixeled projected areas were evaluated as described in Section 2.5. The datasets for 5 samples are presented as means ± SD, and no significant differences between the experimental groups were found. In corresponding studies, only a minimal effect of the treatments was observed on RBC heterogeneity (tested by RBC separation on a Percoll density gradient). Representative images for each experimental set are shown.
Figure 7
Figure 7
Effect of increasing concentrations of Ca2+ on Hb isoform distribution in the membranes of RBCs in the presence of Ca2+ ionophore A23187 (final 10 µM). Data are presented as average ± SD. Significance of values for RBCs exposed to increasing Ca2+ levels vs. those for ‘Ca2+-free PMB’ was evaluated. In addition, data for Ca2+-exposed RBCs in the presence vs. absence of the ionophore were compared.
Figure 8
Figure 8
Possible influence of transmembrane potential. (A) Effect of increasing Ca2+ concentration on transmembrane potential was determined using means of the voltage-sensitive dye DiBAC4(3) and a flow cytometry approach as detailed in Section 2.7. Data were normalized to the ‘0 mM Ca2+’ value, and significance relative to this value is shown. (B) Membrane HbA2/HbA0 ratios in RBCs exposed to increasing fractions of KCl (0, 50, 100, and 150 mM) replacing the equivalent fractions of NaCl, in the presence of the K+ ionophore valinomycin (final 1 µM). Data are presented as means ± SD; minimal differences (all NS, p > 0.05) between all matching tests were examined using paired Student’s t-test. Mean HbA2/HbA0 ratio (±SD) in intact RBCs in these experiments was 0.031 ± 0.001.
Figure 9
Figure 9
Possible involvement of AE-1 in the observed mechanism. Cells collected in heparin tubes were washed of plasma and treated in 2 mM of Ca2+-PMB with either 5 mM of EDTA, 50 µM of DIDS or 2 mM of ZnCl2. Wilcoxon signed-rank test was used for statistical analysis; data for 8 subjects are presented as median ± CI. Significance vs. control ‘PMB + 2 mM Ca2+’ dataset is presented, where NS relates to p > 0.05. Median HbA2/HbA0 ratio (±CI) in intact RBCs was 0.029 ± 0.001.
Figure 10
Figure 10
The proposed model.

Similar articles

Cited by

References

    1. Barvitenko N., Adragna N., Weber R. Erythrocyte Signal Transduction Pathways, Their Oxygenation Dependence and Functional Significance. Cell. Physiol. Biochem. 2005;15:1–18. doi: 10.1159/000083634. - DOI - PubMed
    1. Kosmachevskaya O.V., Topunov A.F. Alternate and Additional Functions of Erythrocyte Hemoglobin. Biochemistry. 2018;83:1575–1593. doi: 10.1134/S0006297918120155. - DOI - PubMed
    1. Issaian A., Hay A., Dzieciatkowska M., Roberti D., Perrotta S., Darula Z., Redzic J., Busch M.P., Page G.P., Rogers S.C., et al. The Interactome of the N-Terminus of Band 3 Regulates Red Blood Cell Metabolism and Storage Quality. Haematologica. 2021;106:2971–2985. doi: 10.3324/haematol.2020.278252. - DOI - PMC - PubMed
    1. Patel R.P. Biochemical Aspects of the Reaction of Hemoglobin and NO: Implications for Hb-Based Blood Substitutes. Free Radic. Biol. Med. 2000;28:1518–1525. doi: 10.1016/S0891-5849(00)00259-8. - DOI - PubMed
    1. Puchulu-Campanella E., Chu H., Anstee D.J., Galan J.A., Tao W.A., Low P.S. Identification of the Components of a Glycolytic Enzyme Metabolon on the Human Red Blood Cell Membrane. J. Biol. Chem. 2013;288:848–858. doi: 10.1074/jbc.M112.428573. - DOI - PMC - PubMed

Publication types

LinkOut - more resources