. 2023 Sep 15;12(18):2281.
doi: 10.3390/cells12182281.

Epidural Injection of Harpagoside for the Recovery of Rats with Lumbar Spinal Stenosis

Affiliations

Epidural Injection of Harpagoside for the Recovery of Rats with Lumbar Spinal Stenosis

Jin Young Hong et al. Cells. .

Abstract

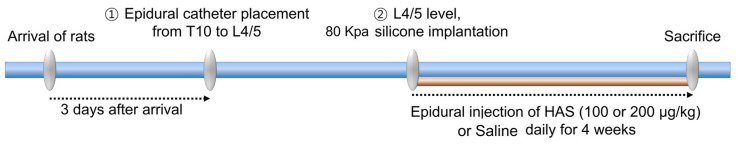
Epidural administration is the leading therapeutic option for the management of pain associated with lumbar spinal stenosis (LSS), which is characterized by compression of the nerve root due to narrowing of the spinal canal. Corticosteroids are effective in alleviating LSS-related pain but can lead to complications with long-term use. Recent studies have focused on identifying promising medications administered epidurally to affected spinal regions. In this study, we aimed to investigate the effectiveness of harpagoside (HAS) as an epidural medication in rats with LSS. HAS at various concentrations was effective for neuroprotection against ferrous sulfate damage and consequent promotion of axonal outgrowth in primary spinal cord neurons. When two concentrations of HAS (100 and 200 μg/kg) were administered to the rat LSS model via the epidural space once a day for 4 weeks, the inflammatory responses around the silicone block used for LSS were substantially reduced. Consistently, pain-related factors were significantly suppressed by the epidural administration of HAS. The motor functions of rats with LSS significantly improved. These findings suggest that targeted delivery of HAS directly to the affected area via epidural injection holds promise as a potential treatment option for the recovery of patients with LSS.

Keywords: epidural injection; harpagoside; inflammation; lumbar spinal stenosis; neuropathic pain; pain relief.


Conflict of interest statement

The authors declare no conflict of interest.

Figures

Figure 1
Figure 1
Survivability and axonal outgrowth of primary cultured spinal cord neurons when treated with HAS after FeSO4 injury. (a) Cell Counting Kit assay of primary spinal cord neurons treated with HP extract, HAS, or HAG for 24 h without FeSO4 injury and (b) with FeSO4 injury (n = 10). (c) Live/dead staining images for live (green) and dead (red) cells in blank, FeSO4-injured, and HAS (50, 100, or 200 μg/mL) + FeSO4-injured neurons. White scale bar = 200 µm, yellow scale bar = 50 µm. The yellow boxes indicate magnified regions in the law magnification images. (d) Quantitative determination of the fluorescence intensity of red-stained dead cells in each group. (e) Representative ICC images for Tuj1 (green) and F-actin (red) in each group. The yellow boxes indicate magnified regions in the law magnification images. (f,g) Analysis of axonal growth by measuring the mean and total neurite lengths of each group. Data are expressed as the means ± standard deviations. Significant differences were analyzed using ordinary one-way analysis of variance with Tukey’s post hoc analysis as follows: # p < 0.05. ## p < 0.01, and #### p < 0.0001 vs. blank group; * p < 0.05, ** p < 0.01, *** p < 0.001, and **** p < 0.0001 vs. FeSO4 group.
Scheme 1
Scheme 1
Experimental procedures for epidural catheterization and lumbar spinal stenosis induction.
Figure 2
Figure 2
Epidural harpagoside (HAS) delivery with anti-inflammatory effect in rats with lumbar spinal stenosis (LSS). (a) Representative immunohistochemical (IHC) axial images of ectodermal dysplasia protein (ED)1+ (green) macrophages 4 weeks after epidural HAS injection to rats with LSS. White scale bar = 500 μm, yellow scale bar = 200 μm. The yellow boxes indicate magnified regions in the law magnification images. (b) The relative fluorescence intensity for ED1+ cells in the L4 level of sham, LSS, and HAS (100 or 200 μg/kg) + LSS groups. (c) Representative IHC images of inducible nitric oxide synthase (iNOS) (red) at 4 weeks in each group. White scale bar = 100 μm, red scale bar = 30 μm. The yellow boxes indicate magnified regions in the law magnification images. (d) The relative fluorescence intensity for iNOS+ cells in the spinal cord of each group. (ej) Quantification of the mRNA expression level of pro- and anti-inflammatory marker genes, including (e) iNOS, (f) IL-1β, (g) TNF-α, (h) COX 2, (i) IL-10, and (j) Arg1, in each group. Data are expressed as the means ± standard deviations. Significant differences were analyzed using ordinary one-way analysis of variance with Tukey’s post hoc analysis as follows: #### p < 0.0001 vs. sham group; ** p < 0.01, *** p < 0.001, and **** p < 0.0001 vs. LSS group.
Figure 3
Figure 3
Epidural harpagoside (HAS) delivery with pain-relieving effect in rats with lumbar spinal stenosis (LSS). (a) Representative images of neuronal nuclear protein (NeuN) (red) and transient receptor potential vanilloid type 1 channel (TRPV1) (green) in dorsal root ganglia (DRG) neurons of each group. White scale bar = 200 μm, yellow scale bar = 40 μm. The yellow boxes indicate magnified regions in the law magnification images. (b) Images stained with NeuN (red) and TRPV1 (green) in cleared DRG tissue from each group. The white boxes indicate magnified regions in the law magnification images. (c) Quantification of TRPV1+ intensity within DRG neurons. (d) Quantification of the mRNA expression level of TRPV1 gene in each group. Data are expressed as the means ± standard deviations. Significant differences were analyzed using ordinary one-way analysis of variance with Tukey’s post hoc analysis as follows: #### p < 0.0001 vs. sham group; **** p < 0.0001 vs. LSS group.
Figure 4
Figure 4
Epidural harpagoside (HAS) delivery with pain-relieving effect in rats with lumbar spinal stenosis (LSS). (a) Representative images of neurofilament 200 (NF200) (blue), isolectin B4 (IB4) (green), and calcitonin gene-related peptide (CGRP) (red) in DRG neurons of each group. White scale bar = 200 μm, yellow scale bar = 40 μm. The yellow boxes indicate magnified regions in the law magnification images. (bd) Percentage of cells expressing NF200, IB4, or CGRP in DRG of each group. (e,f) Quantification of the mRNA expression level of pain-related genes, including (e) interleukin 1 receptor antagonist and (f) sodium voltage-gated channel alpha subunit 9 in each group. Data are expressed as the means ± standard deviations. Significant differences were analyzed using ordinary one-way analysis of variance with Tukey’s post hoc analysis as follows: #### p < 0.0001 vs. sham group; **** p < 0.0001 vs. LSS group.
Figure 5
Figure 5
Epidural harpagoside (HAS) delivery with axonal-sprouting-promoting effect in rats with lumbar spinal stenosis (LSS). (a) Representative immunohistochemical spinal cord images of 5-hydroxytryptamine (5HT) (red) 4 weeks after epidural HAS injection in rats with LSS. DH = dorsal horn. White scale bar = 100 μm, and yellow scale bar = 20 μm. The yellow boxes indicate magnified regions in the law magnification images. (b) The relative fluorescence intensity for 5HT positivity in the spinal cord of the sham, LSS, and HAS (100 or 200 μg/kg) + LSS groups. (c) Quantification of the relative intensity for 5HT positivity in the spinal dorsal horn of each group. (d) Quantification of the NF200 mRNA expression level as a regeneration-associated gene. Data are expressed as the means ± standard deviations. Significant differences were analyzed using ordinary one-way analysis of variance with Tukey’s post hoc analysis as follows: #### p < 0.0001 vs. sham group; ** p < 0.01 and **** p < 0.0001 vs. LSS group.
Figure 6
Figure 6
Epidural harpagoside (HAS) delivery with motor-function-enhancing effect in rats with lumbar spinal stenosis (LSS). (a) Representative footprint images by hindlimb walking on paper at 4 weeks of each group. (bd) Quantitative analysis of footprint patterns for hindlimb gait, including (b) stride length, (c) step length, and (d) toe-out angle, in each group. (e) Basso, Beattie, and Bresnahan score using the open-field behavioral test, (f) percentage of missing steps using the horizontal ladder test, and (g) latency time of the right hindlimb using the Von Frey test. Data (bd) are expressed as the means ± standard deviations. Data (e,f) are expressed as the means ± standard errors of the mean. Significant differences were analyzed using ordinary one-way analysis of variance with Tukey’s post hoc analysis as follows: ## p < 0.01, ### p < 0.001, and #### p < 0.0001 vs. sham group; * p < 0.05, ** p < 0.01, *** p < 0.001, and **** p < 0.0001 vs. LSS group.

Similar articles

Cited by

References

    1. Lurie J., Tomkins-Lane C. Management of lumbar spinal stenosis. BMJ. 2016;352:h6234. doi: 10.1136/bmj.h6234. - DOI - PMC - PubMed
    1. Siebert E., Pruss H., Klingebiel R., Failli V., Einhaupl K.M., Schwab J.M. Lumbar spinal stenosis: Syndrome, diagnostics and treatment. Nat. Rev. Neurol. 2009;5:392–403. doi: 10.1038/nrneurol.2009.90. - DOI - PubMed
    1. Yang S., Kim W., Kong H.H., Do K.H., Choi K.H. Epidural steroid injection versus conservative treatment for patients with lumbosacral radicular pain: A meta-analysis of randomized controlled trials. Medicine. 2020;99:e21283. doi: 10.1097/MD.0000000000021283. - DOI - PMC - PubMed
    1. Luijsterburg P.A., Verhagen A.P., Ostelo R.W., van Os T.A., Peul W.C., Koes B.W. Effectiveness of conservative treatments for the lumbosacral radicular syndrome: A systematic review. Eur. Spine J. 2007;16:881–899. doi: 10.1007/s00586-007-0367-1. - DOI - PMC - PubMed
    1. Gunzburg R., Szpalski M. The conservative surgical treatment of lumbar spinal stenosis in the elderly. Eur. Spine J. 2003;12((Suppl. S2)):S176–S180. doi: 10.1007/s00586-003-0611-2. - DOI - PMC - PubMed

Publication types