. 2023 Sep 15;12(18):2290.
doi: 10.3390/cells12182290.

Unveiling the Secrets of the Stressed Hippocampus: Exploring Proteomic Changes and Neurobiology of Posttraumatic Stress Disorder

Affiliations

Unveiling the Secrets of the Stressed Hippocampus: Exploring Proteomic Changes and Neurobiology of Posttraumatic Stress Disorder

Andrea Nieto-Quero et al. Cells. .

Abstract

Intense stress, especially traumatic stress, can trigger disabling responses and in some cases even lead to the development of posttraumatic stress disorder (PTSD). PTSD is heterogeneous, accompanied by a range of distress symptoms and treatment-resistant disorders that may be associated with a number of other psychopathologies. PTSD is a very heterogeneous disorder with different subtypes that depend on, among other factors, the type of stressor that provokes it. However, the neurobiological mechanisms are poorly understood. The study of early stress responses may hint at the way PTSD develops and improve the understanding of the neurobiological mechanisms involved in its onset, opening the opportunity for possible preventive treatments. Proteomics is a promising strategy for characterizing these early mechanisms underlying the development of PTSD. The aim of the work was to understand how exposure to acute and intense stress using water immersion restraint stress (WIRS), which could be reminiscent of natural disaster, may induce several PTSD-associated symptoms and changes in the hippocampal proteomic profile. The results showed that exposure to WIRS induced behavioural symptoms and corticosterone levels reminiscent of PTSD. Moreover, the expression profiles of hippocampal proteins at 1 h and 24 h after stress were deregulated in favour of increased inflammation and reduced neuroplasticity, which was validated by histological studies and cytokine determination. Taken together, these results suggest that neuroplastic and inflammatory dysregulation may be a therapeutic target for the treatment of post-traumatic stress disorders.

Keywords: corticosterone; cytokines; hippocampal inflammation; hippocampus; natural disaster; neuroplasticity; posttraumatic stress disorder (PTSD); proteomic; water immersion restraint stress (WIRS).


Conflict of interest statement

The authors declare no conflict of interest.

Figures

Figure 1
Figure 1
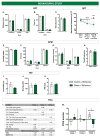
Experimental blocks with an acute WIRS protocol and evolution of CORT levels. (A) First experimental block to analyse the evolution of animal behaviour with a WIRS protocol. On Day 5 of the experiment, a subset of the control (n = 7) and stressed (n = 7) animals were sacrificed. The remaining control and stressed animals were sacrificed on Day 10. (B) CORT levels. No significant differences were observed 24 h after the application of an acute stressor, but significant differences were observed 90 min after finishing the behavioural tests in both behavioural groups, indicating a possible stressor effect of these tests. ‘a’ and ‘b’ indicate significant differences (p ≤ 0.05) in ‘Control + Behaviour’ or ‘Stress + Behaviour’ animals compared to the previous assessment without behavioural testing using repeated-measures ANOVA. (C) Second experimental block for molecular studies. The left hippocampus (Hippoc.) of each animal was used for the cytokine study and the right hippocampus was used for mass protein determination and validation by Western blotting. (D) CORT levels increased 10 and 30 min after stress application (Student’s t tests). The continuous lines represent the data for all groups, since the treatment was the same up to that time. The dashed lines refer to the means obtained at 1 h (Control and Stress 1 h) and 24 h (Control and Stress 24 h) after the application of the stressor for each group. (E) Third experimental block to study the effects of acute stress on neurogenesis and the hippocampal microglial response. (F) Significant differences in CORT levels were observed 24 and 28 h after the application of an acute stressor (environmental treatment factor from repeated-measures ANOVA). * p ≤ 0.05; *** p ≤ 0.005; **** p ≤ 0.0005 degrees of significance between two measures (Control vs. Stress).
Figure 2
Figure 2
Acute WIRS-type stress exposure has an anhedonic effect at the behavioural level. Along with stress, a battery of behavioural tests modelling depression and anxiety were applied. (AC) Basal levels of animals’ locomotor activity in the OFT. (D) Preference for saccharin assessed by SPT at baseline (Test I), 24 h post-stress (Test II) and 6 days post-stress (Test III). The red discontinuous line indicates the minimum threshold of preference for the 0.05% saccharin solution. Anxiety levels (E), locomotor activity (F,G), and time/frequency ratio on open arms (H) of the animals in the EPM. (IK) Immobility, energy and power of movement measures in the TST. (L) Data from the PCA performed with relevant behavioural outcomes. Negative scores indicate an inverse correlation to the component (Comp.). KMO = 0.57; χ2 = 243.20; p = 0. In addition, Student’s t-statistics for PCA scores in each component are provided. (M) PCA scores for each component and group (‘Control + Behaviour’ and ‘Stress + Behaviour’). * p ≤ 0.05; ** p ≤ 0.01; *** p ≤ 0.005 differences between groups using Student’s t test.
Figure 3
Figure 3
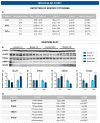
Western blots validate the effects of acute stress on the hippocampal protein profile measured by Q-Orbitrap-MS. (A) Cytokines studied with Luminex technology. (B) Representative micrograph of Western blot (consult Figure S2 for complete membranes) of proteins whose abundance (as measured by Q-Orbitrap-MS) was modified 1 h and 24 h post-acute stress (n = 5, for each group). Western blot analysis demonstrated low levels of GLUR7 in the hippocampus at 1 h following acute WIRS-type stress exposure (C) and Pi4k2a at 24 h (D). Furthermore, Western blot analysis demonstrated high levels of UBE2H in the hippocampus at 1 h following acute WIRS-type stress exposure (E) and Smad3 at 24 h (F); * p ≤ 0.05, ** p ≤ 0.01; *** p ≤ 0.005 differences for the stress group compared to their respective controls. (G) Statistical results of protein determinations by Western blot * p ≤ 0.05, *** p ≤ 0.005 differences for the stress group compared to their respective controls.
Figure 4
Figure 4
Acute stress induced an impairment of the hippocampal protein profile. Functional network in the context of 1 h (A) and 24 h (B) after the application of the acute stressor. The nodes (circles) indicate cellular functions or components in which the altered proteins are involved. Thus, each node has an identity in one or several clusters, represented by one or several colours. Clusters with grey font indicate underexpressed functions, and black font indicates overexpressed functions.
Figure 5
Figure 5
Acute stress induced cellular changes in the DG. (AJ) Study of microglia (Iba1+ cells) in terms of soma morphology parameters (AD) and distribution parameters (EG). (H) Panoramic micrograph of the hippocampal DG using anti-Iba1. (I) Morphological activation phenotype clustering: homeostatic and reactive. (J) Representative morphologies for clusters indicated in (I): homeostatic state (white arrow) and reactive to acute WIRS-type stress (dark arrow). (K) Labelling of DCX+ cells in the DG. (L) Detail in (K) showing classification of DCX+ cells following the maturity grading criteria described in the text (A, B and C, in white font). (M) DCX+ cell density in the DG. (N) Representation of the percentages of BrdU/DCX+ cells in the SGZ/CL of the DG. (O) Confocal microscopy images showing the presence of BrdU/DCX+ cells in the SGZ (subgranular zone) of the control and stressed groups. * p ≤ 0.05; *** p ≤ 0.005; **** p ≤ 0.0005 Control vs. Stress using Student’s t tests.

Similar articles

References

    1. American Psychiatric Association . Diagnostic and Statistical Manual of Mental Disorders (DSM-5) 5th ed. American Psychiatric Association; Washington, DC, USA: 2013.
    1. Dunlop B.W., Kaye J.L., Youngner C., Rothbaum B. Assessing Treatment-Resistant Posttraumatic Stress Disorder: The Emory Treatment Resistance Interview for PTSD (E-TRIP) Behav. Sci. 2014;4:511–527. doi: 10.3390/bs4040511. - DOI - PMC - PubMed
    1. Rytwinski N.K., Scur M.D., Feeny N.C., Youngstrom E.A. The co-occurrence of major depressive disorder among individuals with posttraumatic stress disorder: A meta-analysis. J. Trauma. Stress. 2013;26:299–309. doi: 10.1002/jts.21814. - DOI - PubMed
    1. Tipps M.E., Raybuck J.D., Lattal K.M. Substance abuse, memory, and post-traumatic stress disorder. Neurobiol. Learn. Mem. 2014;112:87–100. doi: 10.1016/j.nlm.2013.12.002. - DOI - PMC - PubMed
    1. Staniaszek K., Cyniak-Cieciura M., Zawadzki B. Posttraumatic stress disorder symptom profiles—The role of temperament, traumatization, and cognitive factors. Pers. Individ. Differ. 2022;193:111595. doi: 10.1016/j.paid.2022.111595. - DOI

LinkOut - more resources