. 2023 Sep 19;12(18):2313.
doi: 10.3390/cells12182313.

Let-7g Upregulation Attenuated the KRAS-PI3K-Rac1-Akt Axis-Mediated Bioenergetic Functions

Affiliations

Let-7g Upregulation Attenuated the KRAS-PI3K-Rac1-Akt Axis-Mediated Bioenergetic Functions

Kuang-Chen Hung et al. Cells. .

Abstract

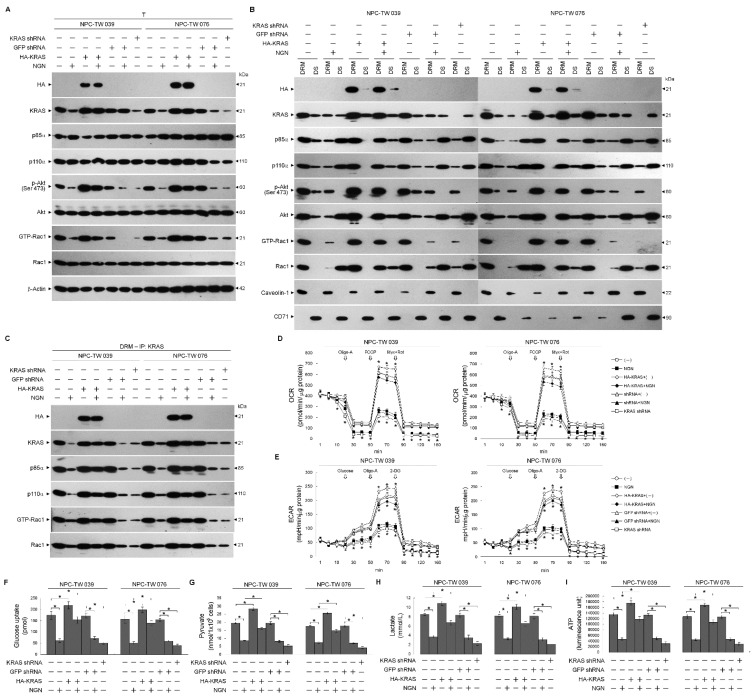
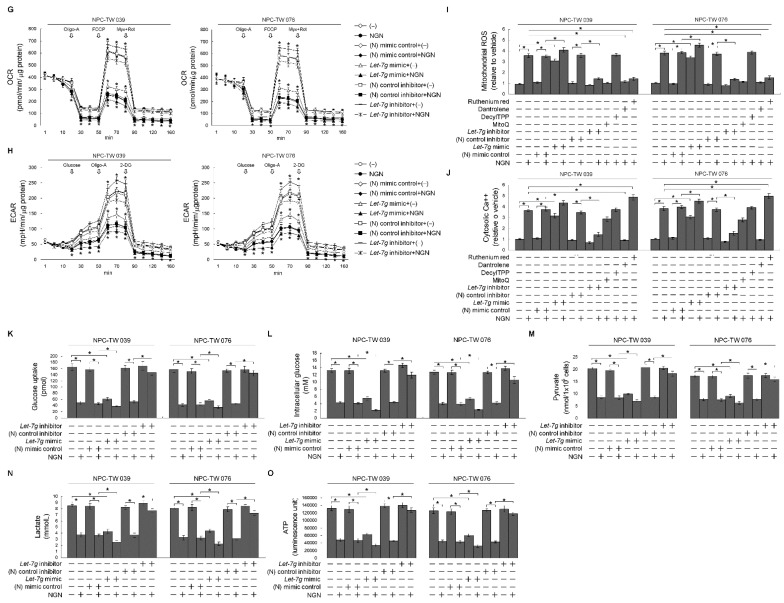
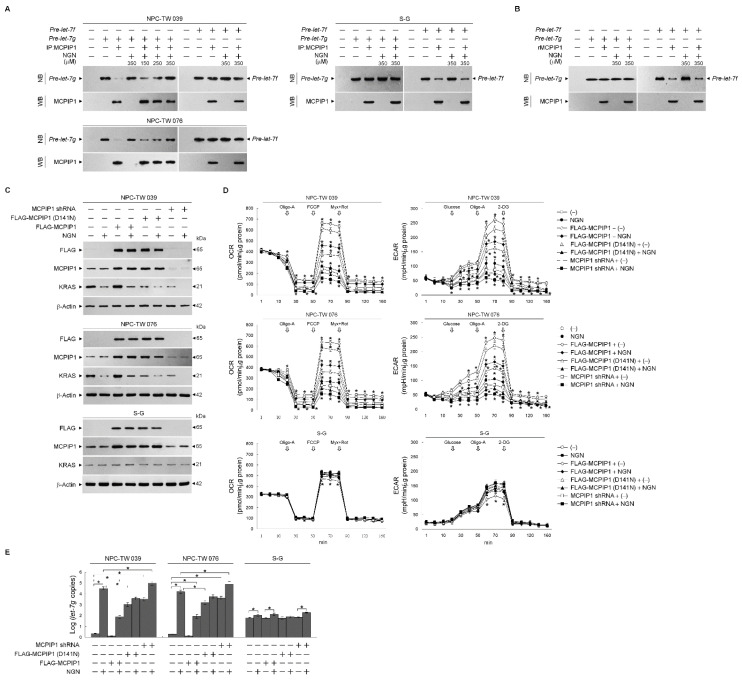
The aberrant activation of signaling pathways contributes to cancer cells with metabolic reprogramming. Thus, targeting signaling modulators is considered a potential therapeutic strategy for cancer. Subcellular fractionation, coimmunoprecipitation, biochemical analysis, and gene manipulation experiments revealed that decreasing the interaction of kirsten rat sarcoma viral oncogene homolog (KRAS) with p110α in lipid rafts with the use of naringenin (NGN), a citrus flavonoid, causes lipid raft-associated phosphatidylinositol 3-kinase (PI3K)-GTP-ras-related C3 botulinum toxin substrate 1 (Rac1)-protein kinase B (Akt)-regulated metabolic dysfunction of glycolysis and mitochondrial oxidative phosphorylation (OXPHOS), leading to apoptosis in human nasopharyngeal carcinoma (NPC) cells. The use of lethal-7g (let-7g) mimic and let-7g inhibitor confirmed that elevated let-7g resulted in a decrease in KRAS expression, which attenuated the PI3K-Rac1-Akt-BCL-2/BCL-xL-modulated mitochondrial energy metabolic functions. Increased let-7g depends on the suppression of the RNA-specificity of monocyte chemoattractant protein-induced protein-1 (MCPIP1) ribonuclease since NGN specifically blocks the degradation of pre-let-7g by NPC cell-derived immunoprecipitated MCPIP1. Converging lines of evidence indicate that the inhibition of MCPIP1 by NGN leads to let-7g upregulation, suppressing oncogenic KRAS-modulated PI3K-Rac1-Akt signaling and thereby impeding the metabolic activities of aerobic glycolysis and mitochondrial OXPHOS.

Keywords: KRAS; MCPIP1; bioenergetic metabolism; let-7g; naringenin.


Conflict of interest statement

The authors declare no conflict of interest.

Figures

Figure 1
Figure 1
Dysfunction of glycolysis and mitochondrial oxidative phosphorylation (OXPHOS) by naringenin (NGN) confers apoptosis in nasopharyngeal carcinoma (NPC) cells. (A) The effect of NGN on NPC and Smulow–Glickman (S-G) cell growth. Cells treated with vehicle (−) or the indicated concentrations of NGN for 36 h. The 3-(4,5-dimethylthiazol-2-yl)-2,5-diphenyltetrazolium bromide (MTT) assay determined cell growth. (BF) The effects of NGN on the induction of NPC cell growth inhibition and apoptosis. After 36 h treatment with (−), NGN (160 μM), Z-VAD-FMK (8 μM) or NGN (160 μM) and Z-VAD-FMK (8 μM), cell growth and viability were determined by the MTT and flow cytometric analysis of PI uptake, respectively. DNA fragmentation was determined using a Cell Death Detection enzyme-linked immunosorbent assay (ELISA) kit. Annexin V-biotinylated vehicle- or NGN-treated cells were fractionated by subcellular fractionation centrifugation to isolate the plasma membrane (M) fraction. The levels of the indicated proteins in the lysates of (−)-, NGN-, -Z-VAD-FMK, and the NGN plus Z-VAD-FMK co-treated M fraction were determined by Western blot analysis using streptavidin-horseradish peroxidase (HRP) and specific antibody to Annexin V or cadherin. Antibody against cadherin was used as an internal control for the plasma membrane. The levels of phosphorylated histone H2A.X (Ser 139) (p-γ-H2AX (Ser 139)), H2AX, and caspase-3 in the total cell (T) lysates were determined by Western blot analysis with specific antibodies. β-Actin was used as an internal control for sample loading. (G,H) The effects of NGN on glycolysis and mitochondrial oxidative phosphorylation (OXPHOS). Cells treated with vehicle or NGN (160 μM) for the indicated periods. The oxygen consumption rate (OCR) was measured in the presence of oligomycin-A (Oligo-A) (1 μM), carbonylcyanide-p-trifluoromethoxyphenylhydrazone (FCCP) (0.5 μM), and rotenone (Rot) (30 μM) plus myxothiazol (Myx) (10 μM) at the indicated time points. The extracellular acidification rate (ECAR) was examined under the sequential addition of glucose, Oligo-A (1 μM), and 2-deoxy-D-glucose (2-DG) (25 mM) at the indicated time points. The OCR and ECAR were measured using a Seahorse Bioscience XF24 Analyzer. (IM) The effects of NGN on the levels of glucose uptake, pyruvate, lactate, ATP, and mitochondrial DNA (mtDNA) copy number. After 36 h of treatment with (−) or NGN (160 μM), the pyruvate, lactate, and ATP values were analyzed using the Pyruvate Assay kit, Lactate Assay kit, and ATP-based CellTiter-Glo Luminescent Cell Viability kit, respectively. Glucose uptake was measured using the Glucose Uptake Colorimetric assay kit. The level of mtDNA was analyzed using quantitative real-time PCR (qRT-PCR). The mtDNA expression was determined relative to that of β-actin. The values are presented as three independent experiments’ mean ± standard error. * p < 0.05: significantly different from vehicle- or NGN-treated cells.
Figure 2
Figure 2
Decreased level of kirsten rat sarcoma viral oncogene homolog (KRAS) in the lipid rafts causes attenuation in the formation of lipid raft-associated KRAS–phosphatidylinositol 3-kinase (PI3K)–active GTP-binding Ras-related C3 botulinum toxin substrate (GTP-Rac1) complexes. (A) Nasopharyngeal carcinoma (NPC) cells were treated with vehicle (−) or naringenin (NGN) for 36 h. Detergent-resistant membrane (DRM) and detergent-soluble (DS) fractions were prepared by flotation along a sucrose density gradient. The levels of the indicated proteins in the lysates of (−)- or NGN-treated DRM and DS fractions and total cell (T) lysates were determined by Western blot analysis using specific antibodies. Antibodies against caveolin-1/CD55 and CD71 were used as internal controls for DRM and DS fractions. (B,C) After 36 h of treatment with (−) or NGN, DRM fractions were prepared by flotation along a sucrose density gradient. The antibody used for coimmunoprecipitation is indicated at the top. The proteins from the immunoprecipitated complexes were detected using Western blotting with specific antibodies. Normal IgG was used as a control for antibody specificity. Total and DRM lysates from (−)- or NGN-treated cells were used to monitor the indicated protein levels and were determined using Western blot analysis with specific antibodies.
Figure 3
Figure 3
Disruption of kirsten rat sarcoma viral oncogene homolog (KRAS)–phosphatidylinositol 3-kinase (PI3K)–active GTP-binding Ras-related C3 botulinum toxin substrate (GTP-Rac1) complex formation and impaired energetic synthesis of the glycolysis and mitochondrial respiration pathways. (AC) At 12 h after transfection with hemagglutinin (HA)-KRAS, GFP short hairpin RNA (shRNA), or KRAS shRNA, cells were treated with vehicle (−) or naringenin (NGN) for 36 h. The levels of the indicated proteins in the lysates of the total cell (T), detergent-resistant membrane (DRM), and detergent-soluble (DS) fractions were determined by Western blot analysis using specific antibodies. Co-immunoprecipitation of KRAS, p85α, p110α, and GTP-Rac1 was performed using the DRM fractions prepared from the cells treated as described above. The KRAS antibody used for co-immunoprecipitation is indicated at the top. The proteins from the immunoprecipitated complexes were detected using Western blotting with specific antibodies. Normal IgG was used as a control for antibody specificity. (D,E) Oxygen consumption rate (OCR) was measured in the presence of oligomycin-A (Oligo-A), carbonylcyanide-p-trifluoromethoxyphenylhydrazone (FCCP), and rotenone (Rot) plus myxothiazol (Myx) at the indicated time points. Extracellular acidification rate (ECAR) was examined in the sequential addition of glucose, Oligo-A, and 2-deoxy-D-glucose (2-DG) at the indicated time points. The OCR and ECAR were measured using a Seahorse Bioscience XF24 Analyzer. (FI) The pyruvate, lactate, and ATP values were analyzed using the Pyruvate Assay kit, Lactate Assay kit, and ATP-based CellTiter-Glo Luminescent Cell Viability kit, respectively. In addition, glucose uptake was measured using the Glucose Uptake Colorimetric assay kit. The values are presented as three independent experiments’ mean ± standard error. * p < 0.05: significantly different from vehicle-treated empty vector-transfected, vehicle-treated GFP-transfected, or NGN-treated empty vector-transfected cells.
Figure 4
Figure 4
Metabolic dysfunction of glycolysis and mitochondrial oxidative phosphorylation associated with lethal-7g (let-7g)-attenuated kirsten rat sarcoma viral oncogene homolog (KRAS)–phosphatidylinositol 3-kinase (PI3K)–Ras-related C3 botulinum toxin substrate (Rac1)–protein kinase B (Akt) signaling. (A) Cells were treated with vehicle (−) or naringenin (NGN) for 36 h. The expression of let-7 was determined using quantitative real-time polymerase chain reaction (qRT-PCR). The let-7 value was normalized to the U6 level. The Y-axis shows the denary logarithm of the normalized let-7 copy number. (B,C) The effects of the protein kinase C (PKC) inhibitor chelerythrine (CHE) on let-7g and OCT-1 expression. After treating with CHE (0.5 μM) for 36 h, the relative expression levels of let-7g and OCT-1 were determined by qRT-PCR. The let-7g and OCT-1 values were normalized to the U6 level and β-actin, respectively. The Y-axis shows the denary logarithm of the normalized let-7g or OCT-1 copy number. (DF) At 12 h after transfection with the negative (N) mimic control, let-7g mimic, (N) mimic control inhibitor, or let-7g inhibitor, cells were treated with (−) or NGN for 36 h. Five mM bismaleimidohexane (BMH)-treated cells were subjected to subcellular fractionation to obtain the mitochondrial (Mt) and endoplasmic reticulum (ER)/microsomal (Ms) fractions. In total, 20 μg of total protein from the recovered fractions was analyzed by 10% sodium dodecyl sulfate polyacrylamide gel electrophoresis (SDS-PAGE) and probed with specific antibodies, as indicated. Cytochrome c oxidase subunit II (Cox-2), calnexin, and α-tubulin were used as internal controls for the mitochondria, ER, and cytosol, respectively. The levels of the indicated proteins in the total cell (T) lysates were determined by Western blot analysis using specific antibodies. (G,H) At 12 h after transfection with the (N) mimic control, let-7g mimic, (N) mimic control inhibitor, or let-7g inhibitor, cells were treated with (−) or NGN in the presence of 1 μM oligomycin-A (Oligo-A), carbonylcyanide-p-trifluoromethoxyphenylhydrazone (FCCP), and rotenone (Rot) plus myxothiazol (Myx) or the sequential addition of glucose, Oligo-A, and 2-DG at the indicated time points. The oxygen consumption rate (OCR) and extracellular acidification rate (ECAR) were measured using a Seahorse Bioscience XF24 Analyzer. (I,J) At 12 h after transfection with the (N) mimic control, let-7g mimic, (N) mimic control inhibitor, or let-7g inhibitor, cells were treated with vehicle (−), NGN, NGN plus Mitoquinone (MitoQ) (10 μM), decyltriphenylphosphonium bromide (DecylTPP) (1 μM), NGN plus dantrolene (25 μM), or NGN plus ruthenium red (1 μM) for 36 h. Flow cytometry determined the levels of mitochondrial reactive oxygen species (ROS) and cytosolic calcium (Ca++) by measuring the increased fluorescence. (KO) Transfected cells were harvested 36 h after treatment with (−) or NGN. The glucose, pyruvate, lactate, and ATP values were analyzed using the Glucose assay, Pyruvate Assay kit, Lactate Assay kit, and ATP-based CellTiter-Glo Luminescent Cell Viability kit, respectively. In addition, glucose uptake was measured using the Glucose Uptake Colorimetric Assay kit. The values are presented as three independent experiments’ mean ± standard error. * p < 0.05: significantly different from vehicle-treated empty vector-transfected, vehicle-treated (N) mimic control-transfected, or vehicle-treated (N) mimic control inhibitor-transfected cells.
Figure 4
Figure 4
Metabolic dysfunction of glycolysis and mitochondrial oxidative phosphorylation associated with lethal-7g (let-7g)-attenuated kirsten rat sarcoma viral oncogene homolog (KRAS)–phosphatidylinositol 3-kinase (PI3K)–Ras-related C3 botulinum toxin substrate (Rac1)–protein kinase B (Akt) signaling. (A) Cells were treated with vehicle (−) or naringenin (NGN) for 36 h. The expression of let-7 was determined using quantitative real-time polymerase chain reaction (qRT-PCR). The let-7 value was normalized to the U6 level. The Y-axis shows the denary logarithm of the normalized let-7 copy number. (B,C) The effects of the protein kinase C (PKC) inhibitor chelerythrine (CHE) on let-7g and OCT-1 expression. After treating with CHE (0.5 μM) for 36 h, the relative expression levels of let-7g and OCT-1 were determined by qRT-PCR. The let-7g and OCT-1 values were normalized to the U6 level and β-actin, respectively. The Y-axis shows the denary logarithm of the normalized let-7g or OCT-1 copy number. (DF) At 12 h after transfection with the negative (N) mimic control, let-7g mimic, (N) mimic control inhibitor, or let-7g inhibitor, cells were treated with (−) or NGN for 36 h. Five mM bismaleimidohexane (BMH)-treated cells were subjected to subcellular fractionation to obtain the mitochondrial (Mt) and endoplasmic reticulum (ER)/microsomal (Ms) fractions. In total, 20 μg of total protein from the recovered fractions was analyzed by 10% sodium dodecyl sulfate polyacrylamide gel electrophoresis (SDS-PAGE) and probed with specific antibodies, as indicated. Cytochrome c oxidase subunit II (Cox-2), calnexin, and α-tubulin were used as internal controls for the mitochondria, ER, and cytosol, respectively. The levels of the indicated proteins in the total cell (T) lysates were determined by Western blot analysis using specific antibodies. (G,H) At 12 h after transfection with the (N) mimic control, let-7g mimic, (N) mimic control inhibitor, or let-7g inhibitor, cells were treated with (−) or NGN in the presence of 1 μM oligomycin-A (Oligo-A), carbonylcyanide-p-trifluoromethoxyphenylhydrazone (FCCP), and rotenone (Rot) plus myxothiazol (Myx) or the sequential addition of glucose, Oligo-A, and 2-DG at the indicated time points. The oxygen consumption rate (OCR) and extracellular acidification rate (ECAR) were measured using a Seahorse Bioscience XF24 Analyzer. (I,J) At 12 h after transfection with the (N) mimic control, let-7g mimic, (N) mimic control inhibitor, or let-7g inhibitor, cells were treated with vehicle (−), NGN, NGN plus Mitoquinone (MitoQ) (10 μM), decyltriphenylphosphonium bromide (DecylTPP) (1 μM), NGN plus dantrolene (25 μM), or NGN plus ruthenium red (1 μM) for 36 h. Flow cytometry determined the levels of mitochondrial reactive oxygen species (ROS) and cytosolic calcium (Ca++) by measuring the increased fluorescence. (KO) Transfected cells were harvested 36 h after treatment with (−) or NGN. The glucose, pyruvate, lactate, and ATP values were analyzed using the Glucose assay, Pyruvate Assay kit, Lactate Assay kit, and ATP-based CellTiter-Glo Luminescent Cell Viability kit, respectively. In addition, glucose uptake was measured using the Glucose Uptake Colorimetric Assay kit. The values are presented as three independent experiments’ mean ± standard error. * p < 0.05: significantly different from vehicle-treated empty vector-transfected, vehicle-treated (N) mimic control-transfected, or vehicle-treated (N) mimic control inhibitor-transfected cells.
Figure 5
Figure 5
Lethal-7g (let-7g) upregulation attenuates glucose transporter-1 (GLUT-1) lipid raft membrane-targeting without affecting hypoxia-inducible factor 1α (HIF-1α)-mediated pyruvate kinase type M2 (PKM2), pyruvate dehydrogenase kinase 1 (PDK1), hexokinase II (HK-II), lactate dehydrogenase (LDH), and succinate dehydrogenase (SDH) activities. (AI) At 12 h after transfection with the negative (N) mimic control, let-7g mimic, (N) mimic control inhibitor, or let-7g inhibitor, cells treated with vehicle (−) or naringenin (NGN) for 36 h. The levels of the indicated proteins in the total cell (T) lysates or detergent-resistant membrane (DRM) fractions were determined by Western blot analysis using specific antibodies. The FKM2, PDK1, HK-II, LDH, and SDH activities were analyzed using the Colorimetric-Based Pyruvate Kinase Activity Assay, ADP-GloTM Kinase Assay, Colorimetric Hexokinase Activity Assay, Lactate Dehydrogenase Assay, and Succinate Dehydrogenase Activity Colorimetric Assay, respectively. The Succinate Colorimetric Assay kit determined the succinate level. β-Actin was used as an internal control for sample loading. * p < 0.05.
Figure 6
Figure 6
Suppression of monocyte chemoattractant protein-induced protein-1 (MCPIP1)-mediated degradation of lethal-7g (let-7g) by naringenin (NGN) involved the attenuation of glycolysis and mitochondrial mitochondrial oxidative phosphorylation (OXPHOS). (A,B) Immunoprecipitated MCPIP1 (IP:MCPIP1) from the nasopharyngeal carcinoma (NPC) or Smulow–Glickman (S-G) cells and recombinant purified MCPIP1 (rMCPIP1) used in the experiments. The inhibition of the let-7g degradation of MCPIP1-mediated by NGN, performed by in vitro RNA cleavage assay and analyzed by Northern blotting (NB). The levels of the IP:MCPIP1 or rMCPIP1 in reactions were determined by Western blot (WB) analysis using specific antibodies. (CE) At 12 h after transfection with FLAG-MCPIP1, FLAG-MCPIP1 (D141N), or MCPIP1 short hairpin RNA (shRNA), cells were treated with vehicle (−) or NGN in the presence of 1 μM oligomycin-A (Oligo-A), carbonylcyanide-p-trifluoromethoxyphenylhydrazone (FCCP), and rotenone (Rot) plus myxothiazol (Myx) or the sequential addition of glucose, Oligo-A, and 2-deoxy-D-glucose (2-DG) at the indicated time points. The oxygen consumption rate (OCR) and extracellular acidification rate (ECAR) were measured using a Seahorse Bioscience XF24 Analyzer. Western blot analysis using specific antibodies determined the levels of the indicated proteins in the total cell lysates. Quantitative real-time polymerase chain reaction (qRT-PCR) determined the relative expression level of let-7g. The let-7g value was normalized to the U6 level. The Y-axis shows the denary logarithm of the normalized let-7g copy number. The values are presented as three independent experiments’ mean ± standard error. * p < 0.05: significantly different from (−)-treated empty vector-transfected, NGN-treated empty vector-transfected, (−)-treated FLAG-MCPIP1-transfected, or (−)-treated MCPIP1 shRNA-transfected cells.
Figure 7
Figure 7
A molecular model for the naringenin (NGN)-induced impairment of the mitochondria-mediated bioenergetics in nasopharyngeal carcinoma (NPC) cells. (A) The selective interaction of argonaute (AG) protein or an undefined factor with monocyte chemoattractant protein-induced protein-1 (MCPIP1) may accomplish the sequence-specific targeting of pre-lethal-7g (pre-let-7g) and promote MCPIP1-mediated pre-let-7g degradation to decrease the biogenesis of let-7g, resulting in the attenuation of the let-7g-mediated translational repression of kirsten rat sarcoma viral oncogene homolog (KRAS) mRNA. The resultant elevated KRAS increases the formation of clustered KRAS- phosphatidylinositol 3-kinase (PI3K)-active GTP-binding Ras-related C3 botulinum toxin substrate (GTP-Rac1)–protein kinase B (Akt) signaling molecules in the lipid raft membranes, constituting a central element in the initiation of the coordination of glycolysis with mitochondrial oxidative phosphorylation (OXPHOS) for ATP generation. (B) Under the condition of the cellular uptake of NGN, NGN may bind to the AG protein or an undefined cofactor to block the degradation of pre-let-7g by MCPIP1, increasing the level of let-7g, thus inducing the let-7g-mediated translational repression of KRAS mRNA and thereby dismissing the interaction between KRAS and p110α in the lipid raft membrane. The absence of KRAS in the p85α–p110α complexes causes the destabilization of p85α–p110α complexes in the lipid raft membrane. The resultant loss of the KRAS–p85α–p110α complexes in the lipid raft membrane leads to blocking PI3K-GTP-Rac1-mediated Akt activation. Attenuated Akt impaired the aerobic glycolysis and mitochondria-regulated bioenergetic functions in NPC cells.

Similar articles

Cited by

References

    1. Gatenby R.A., Gillies R.J. Why do cancers have high aerobic glycolysis? Nat. Rev. Cancer. 2004;4:891–899. doi: 10.1038/nrc1478. - DOI - PubMed
    1. Zhao Y., Butler E.B., Tan M. Targeting cellular metabolism to improve cancer therapeutics. Cell Death Dis. 2013;4:e532. doi: 10.1038/cddis.2013.60. - DOI - PMC - PubMed
    1. Ward P.S., Thompson C.B. Metabolic reprogramming: A cancer hallmark even warburg did not anticipate. Cancer Cell. 2012;21:297–308. doi: 10.1016/j.ccr.2012.02.014. - DOI - PMC - PubMed
    1. Goetzman E.S., Prochownik E.V. The Role for Myc in Coordinating Glycolysis, Oxidative Phosphorylation, Glutaminolysis, and Fatty Acid Metabolism in Normal and Neoplastic Tissues. Front. Endocrinol. 2018;9:129. doi: 10.3389/fendo.2018.00129. - DOI - PMC - PubMed
    1. Zheng J. Energy metabolism of cancer: Glycolysis versus oxidative phosphorylation (Review) Oncol. Lett. 2012;4:1151–1157. doi: 10.3892/ol.2012.928. - DOI - PMC - PubMed