. 2023 Sep 20;12(18):2322.
doi: 10.3390/cells12182322.

TRPV1 Channels Are New Players in the Reticulum-Mitochondria Ca2+ Coupling in a Rat Cardiomyoblast Cell Line

Affiliations

TRPV1 Channels Are New Players in the Reticulum-Mitochondria Ca2+ Coupling in a Rat Cardiomyoblast Cell Line

Nolwenn Tessier et al. Cells. .

Abstract

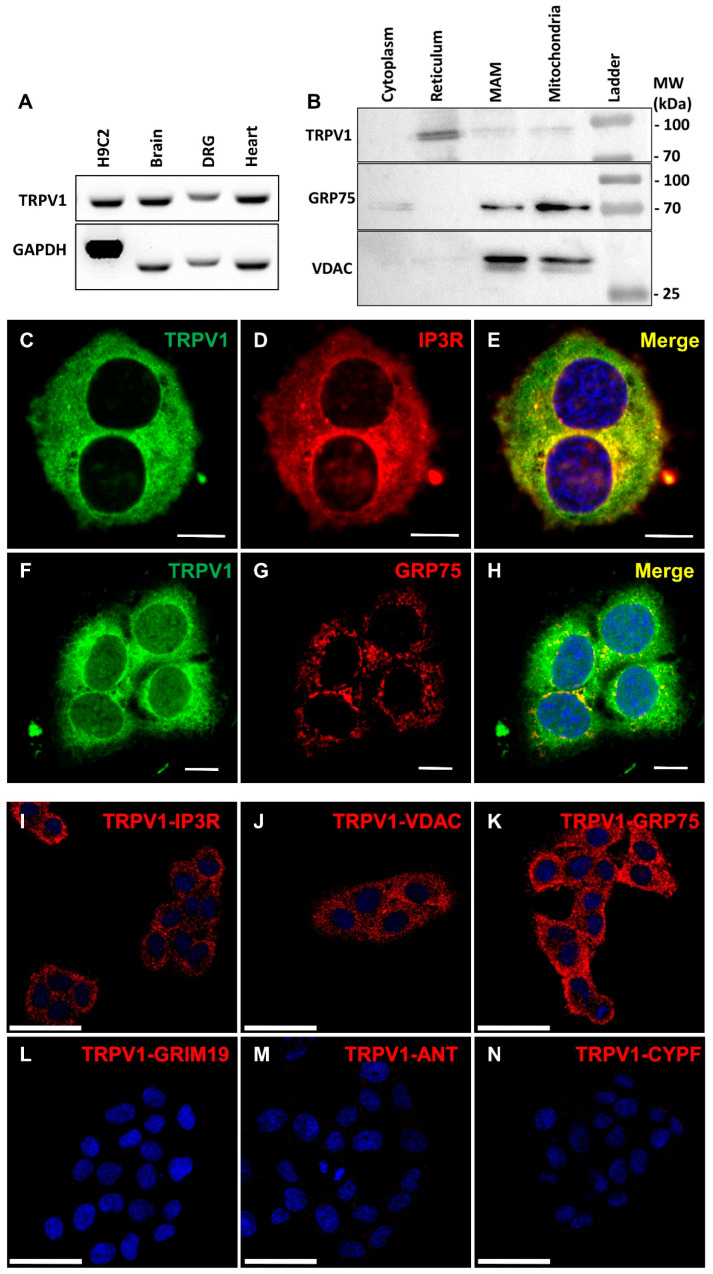
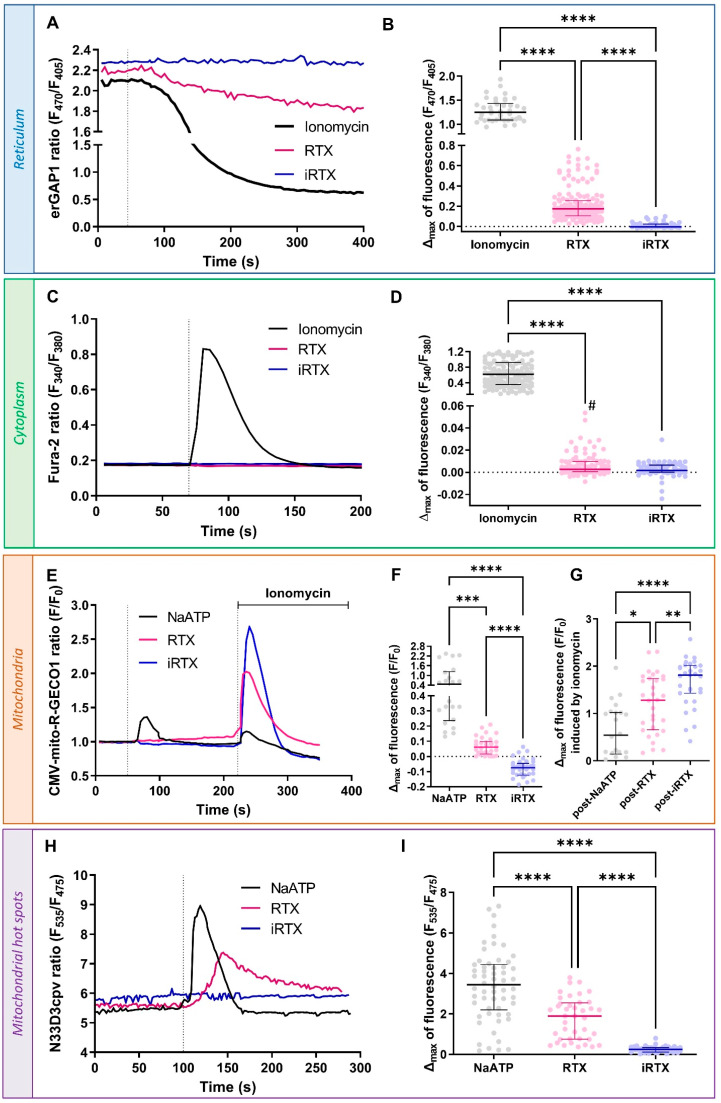
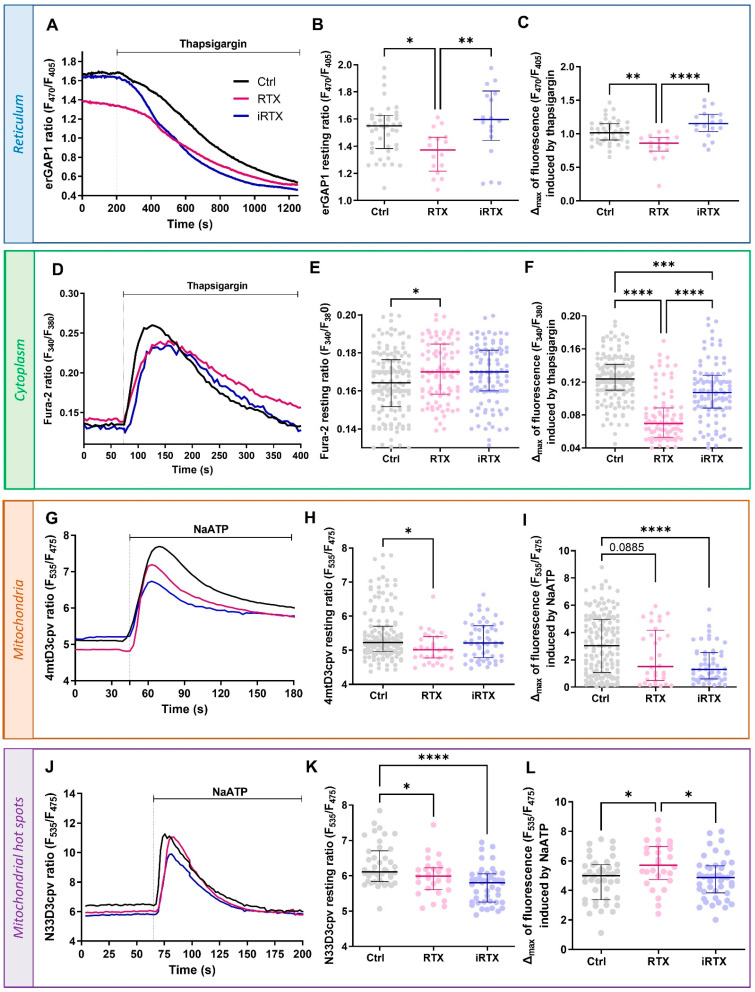
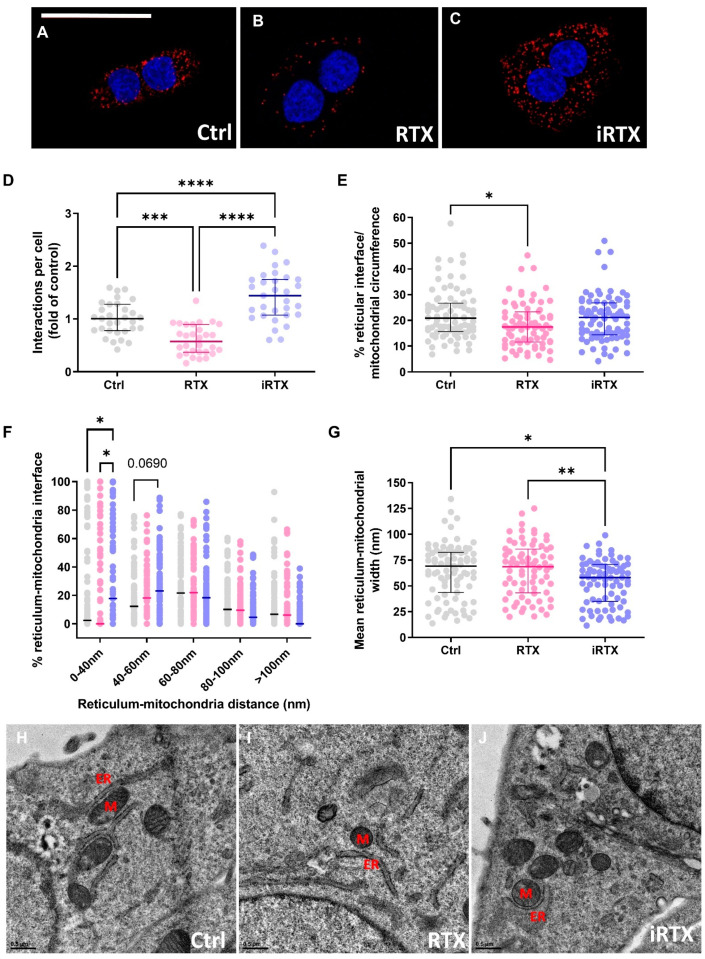
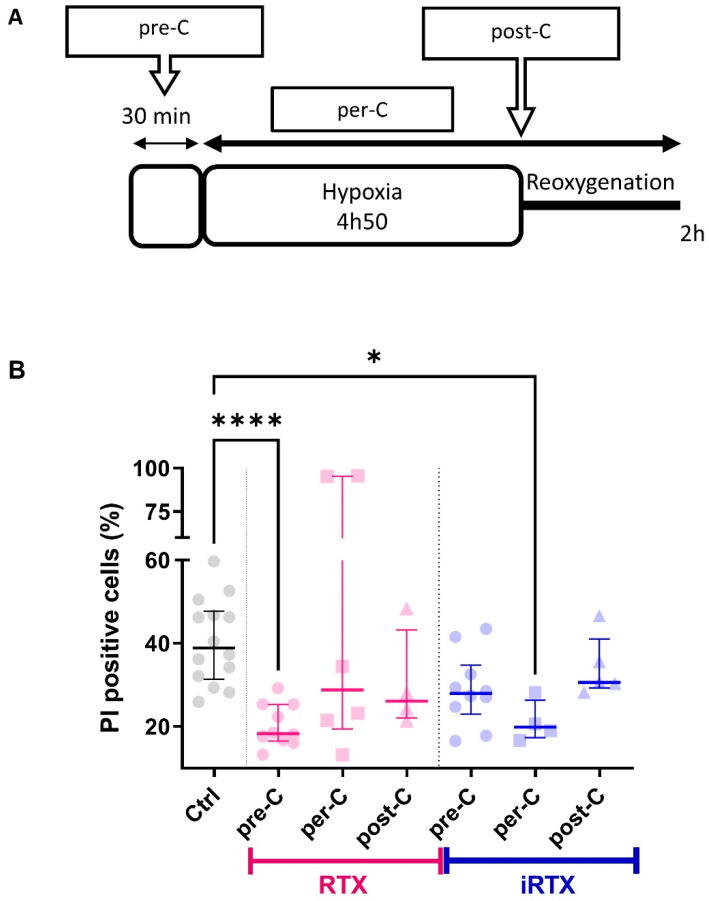
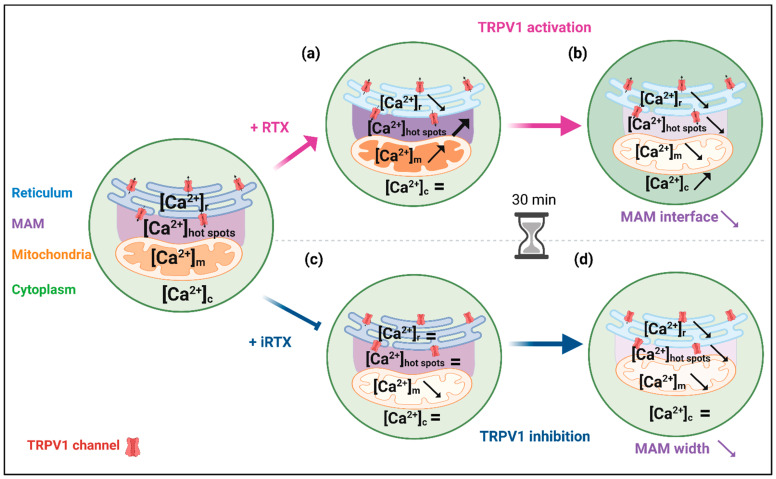
The Ca2+ release in microdomains formed by intercompartmental contacts, such as mitochondria-associated endoplasmic reticulum membranes (MAMs), encodes a signal that contributes to Ca2+ homeostasis and cell fate control. However, the composition and function of MAMs remain to be fully defined. Here, we focused on the transient receptor potential vanilloid 1 (TRPV1), a Ca2+-permeable ion channel and a polymodal nociceptor. We found TRPV1 channels in the reticular membrane, including some at MAMs, in a rat cardiomyoblast cell line (SV40-transformed H9c2) by Western blotting, immunostaining, cell fractionation, and proximity ligation assay. We used chemical and genetic probes to perform Ca2+ imaging in four cellular compartments: the endoplasmic reticulum (ER), cytoplasm, mitochondrial matrix, and mitochondrial surface. Our results showed that the ER Ca2+ released through TRPV1 channels is detected at the mitochondrial outer membrane and transferred to the mitochondria. Finally, we observed that prolonged TRPV1 modulation for 30 min alters the intracellular Ca2+ equilibrium and influences the MAM structure or the hypoxia/reoxygenation-induced cell death. Thus, our study provides the first evidence that TRPV1 channels contribute to MAM Ca2+ exchanges.

Keywords: Ca2+ homeostasis; ER–mitochondria contact sites; H9c2; TRP channels; TRPV1; hypoxia–reoxygenation.


Conflict of interest statement

The authors declare no conflict of interest. The funders had no role in the study’s design; in the collection, analyses, or interpretation of data; in the writing of the manuscript; or in the decision to publish the results.

Figures

Figure 1
Figure 1
Expression and intracellular localization of TRPV1 in SV40-transformed H9c2 cells. (A) RT-PCR obtained RNA expression of TRPV1 in SV40-transformed H9c2 cells and mouse tissues (brain, dorsal root ganglion (DRG), heart). (B) Immunoblot analysis of TRPV1, voltage-dependent anion channel (VDAC), and glucose-regulated protein 75 (GRP75) on subcellular fractions from SV40-transformed H9c2 cells. (CH) Double-staining immunofluorescence was applied to SV40-transformed H9c2 cells using antibodies against TRPV1 ((C,F); green signal) and IP3R (inositol 1,4,5-trisphosphate receptor; (D); red signal) or GRP75 ((G); red signal). Both color channels were merged to demonstrate co-distribution (yellow signal) of both immunofluorescence staining signals (E,H). Scale bar = 10 µm. (IN) Representative confocal microscopy images of the TRPV1-IP3R (I), TRPV1-VDAC (J), TRPV1-GRP75 (K), TRPV1-GRIM19 (genes associated with retinoid–IFN-induced mortality-19; (L)), TRPV1-ANT (adenine nucleotide translocase; (M)), and TRPV1-CYPF (cyclophilin F; (N)) interactions in SV40-transformed H9c2 cells by proximity ligation assay. Scale bar = 50 µm.
Figure 2
Figure 2
Acute effect of TRPV1 modulation on Ca2+ homeostasis. (A,B) Reticular Ca2+ concentration ([Ca2+]r). (A) Time traces showing [Ca2+]r measured with erGAP1 probe during ionomycin (1 µM; black line), resiniferatoxin (RTX) stimulation (10 µM; pink line), or 5′-iodoresiniferatoxin (iRTX) stimulation (10 µM; blue line). (B) Scatter plots representing reticular Ca2+ content assessed by ionomycin (1 µM; black; n = 156), RTX (10 µM; pink; n = 69), or iRTX (10 µM; blue; n = 42) stimulation. (C,D) Cytosolic Ca2+ concentration ([Ca2+]c). (C) Time traces showing [Ca2+]c measured with Fura-2 AM probe during ionomycin (1 µM; black line), RTX (10 µM; pink line), or iRTX (10 µM; blue line) stimulation. (D) Scatter plots representing cytosolic Ca2+ content assessed by ionomycin (1 µM; black; n = 156), RTX (10 µM; pink; n = 105), or iRTX (10 µM; blue; n = 74) stimulation. (EG) Mitochondrial Ca2+ concentration ([Ca2+]m). (E) Time traces showing [Ca2+]m measured with CMV-mito-R-GECO1 probe during NaATP (100 µM; black line), RTX (10 µM; pink line), or iRTX (10 µM; blue line) stimulation. (F) Scatter plots representing mitochondrial Ca2+ content assessed by NaATP (100 µM; black; n = 21), RTX (10 µM; pink; n = 32), or iRTX (10 µM; blue; n = 31) stimulation. (G) Scatter plots representing mitochondrial total Ca2+ content assessed by ionomycin (1 µM) after NaATP (black; n = 21), RTX (pink; n = 32), or iRTX (blue; n = 31) stimulation. (H,I) Ca2+ concentration in mitochondrial hot spots ([Ca2+]hot spots). (H) Time traces showing [Ca2+]hot spots measured with N33D3cpv probe during RTX (10 µM; pink line), iRTX (10 µM; blue line), or NaATP (100 µM; black line) stimulation. (I) Scatter plots representing Ca2+ content in mitochondrial hot spots assessed by NaATP (100 µM; black; n = 58), RTX (10 µM; pink; n= 40), or iRTX (10 µM; blue; n = 43) stimulation. Data are from at least three independent experiments. Statistics: * p < 0.05, ** p < 0.01, *** p < 0.001, **** p < 0.0001; # p < 0.05, RTX vs. iRTX Mann–Whitney test.
Figure 3
Figure 3
Effects of 30 min prolonged TRPV1 modulation on Ca2+ homeostasis. (AC) Reticular Ca2+ concentration ([Ca2+]r. (A) Time traces showing [Ca2+]r measured with erGAP1 probe during thapsigargin stimulation (2 µM) from control cells (Ctrl, black line) and 30 min-pretreated cells with RTX (10 µM; pink line) or iRTX (10 µM; blue line). (B) Scatter plots representing the steady-state [Ca2+]r concentration and (C) the total reticular Ca2+ content assessed by thapsigargin (2 µM) from control cells (black; n = 45) and 30 min-pretreated cells with RTX (10 µM; pink; n = 16) or iRTX (10 µM; blue; n = 18). (DF) Cytosolic Ca2+ concentration ([Ca2+]c. (D) Time traces showing [Ca2+]c measured with Fura-2 AM probe during thapsigargin stimulation (2 µM) from control cells (black line) and 30 min-pretreated cells with RTX (10 µM; pink line) or iRTX (10 µM; blue line). (E) Scatter plots representing the steady-state [Ca2+]c and (F) the total cytosolic Ca2+ content assessed by thapsigargin (2 µM) from control cells (black; n = 150) and 30 min-pretreated cells with RTX (10 µM; pink; n = 92) or iRTX (10 µM; blue; n = 103). (GI) Mitochondrial Ca2+ concentration ([Ca2+]m. (G) Time traces showing [Ca2+]m measured with 4mtD3cvp probe during NaATP stimulation (100 µM) from control cells (black line) and 30 min-pretreated cells with RTX (10 µM; pink line) or iRTX (10 µM; blue line). (H) Scatter plots representing the steady-state [Ca2+]m and (I) the total mitochondrial Ca2+ content assessed by NaATP (100 µM) from control cells (black; n = 151) and 30 min-pretreated cells with RTX (10 µM; pink; n = 32) or iRTX (10 µM; blue; n = 53). (JL) Ca2+ concentration in mitochondrial hot spots ([Ca2+]hot spots). (J) Time traces showing [Ca2+]hot spots measured with N33D3cpv probe during NaATP stimulation (100 µM) from control cells (black line) and 30 min-pretreated cells with RTX (10 µM; pink line) or iRTX (10 µM; blue line). (K) Scatter plots representing the steady-state [Ca2+]hot spots and (L) total Ca2+ content in mitochondrial hot spots by NaATP (100 µM) from control cells (black; n = 42) and 30 min-pretreated cells with RTX (10 µM; pink; n = 28) or iRTX (10 µM; blue; n = 44). Data are from at least three independent experiments. Statistics: * p < 0.05, ** p < 0.01, *** p < 0.001, **** p < 0.0001.
Figure 4
Figure 4
Effects of 30 min prolonged TRPV1 modulation on interactions between endoplasmic reticulum and mitochondria. (AC) Representative confocal microscopy images of in situ IP3R–VDAC interactions depicted as red dots (A) in control cells and 30 min-pretreated cells with (B) RTX (10 µM) or (C) iRTX (10 µM). Nuclei appear in blue. Scale bar: 50 µm. (D) Quantification of the interactions per cell presented as a fold of control; n = 30–31 cells. (EJ) Ultrastructural analysis by electron microscopy of reticulum–mitochondria interactions in control cells (black; n = 83) and in 30 min-pretreated cells with RTX (10 µM; pink; n = 73) or iRTX (10 µM; blue; n = 79). Schematics of the different parameters measured are explained in Figure S5. (E) Quantification of reticulum–mitochondria interface expressed as a percentage of the mitochondrial circumference. (F) Frequency distribution of reticulum–mitochondria interactions. (G) Mean of the reticulum–mitochondria interaction width. (HJ) Representative images of electron microscopy in control cells (H) and 30 min-pretreated cells with RTX (I) or iRTX (J). M, mitochondria; ER, endoplasmic reticulum. Data are from at least three independent experiments. Statistics: * p < 0.05, ** p < 0.01, *** p < 0.001, **** p < 0.0001.
Figure 5
Figure 5
Effects of TRPV1 conditioning on in vitro hypoxia/reoxygenation-induced cell death. (A) The experimental design representing hypoxia/reoxygenation (H/R) protocols achieved in control cells and cells treated with RTX (10 µM) or iRTX (10 µM): preconditioning (pre-C), per-conditioning (per-C), or postconditioning (post-C). (B) Dot plot showing mortality of SV40-transformed H9c2 cells to H/R (Ctrl) or concomitantly subjected to H/R and RTX or iRTX treatment. Evaluation of SV40-transformed H9c2 cell mortality was assessed via propidium iodide (PI) staining by flow cytometry. Sample size appears as follows: N = number of independent experiments; each symbol represents the mean of a triplicate, where each triplicate value corresponds to 10,000 events. Statistics: **** p < 0.0001,* p < 0.05 vs. Ctrl.
Figure 6
Figure 6
Schematic summary of the main results. (a) Acute TRPV1 activation induced a slow decrease in the reticular Ca2+ content. It led to a Ca2+ increase at the mitochondrial surface and within the mitochondrial matrix, with an almost imperceptible cytosolic Ca2+ change at the whole-cell level. (b) When TRPV1 activation was prolonged for 30 min, [Ca2+]r dropped, reducing the MAM interface and decreasing mitochondrial Ca2+ content (matrix and surface) in favor of an increase in the cytosol. (c) Acute TRPV1 inhibition had no apparent effect on reticulum, cytosol, and mitochondrial hot spot contents, probably due to a SERCA pumping adaptation, but slowly depleted the mitochondrial compartment of Ca2+. (d) Over 30 min, TRPV1 inhibition increased and brought the ER–mitochondria interactions closer. We could expect an increase in [Ca2+]m in this condition. It was not the case, as the amount of Ca2+ released from the reticulum was slightly lowered. The figure was created with BioRender.com (agreement number: JH25TUV6AR).

References

    1. Tominaga M., Caterina M.J., Malmberg A.B., Rosen T.A., Gilbert H., Skinner K., Raumann B.E., Basbaum A.I., Julius D. The Cloned Capsaicin Receptor Integrates Multiple Pain-Producing Stimuli. Neuron. 1998;21:531–543. doi: 10.1016/S0896-6273(00)80564-4. - DOI - PubMed
    1. Caterina M.J., Leffler A., Malmberg A.B., Martin W.J., Trafton J., Petersen-Zeitz K.R., Koltzenburg M., Basbaum A.I., Julius D. Impaired Nociception and Pain Sensation in Mice Lacking the Capsaicin Receptor. Science. 2000;288:306–313. doi: 10.1126/science.288.5464.306. - DOI - PubMed
    1. Caterina M.J., Schumacher M.A., Tominaga M., Rosen T.A., Levine J.D., Julius D. The Capsaicin Receptor: A Heat-Activated Ion Channel in the Pain Pathway. Nature. 1997;389:816–824. doi: 10.1038/39807. - DOI - PubMed
    1. Edwards J.G. TRPV1 in the Central Nervous System: Synaptic Plasticity, Function, and Pharmacological Implications. Prog. Drug Res. Fortschritte Arzneimittelforschung Prog. Rech. Pharm. 2014;68:77–104. doi: 10.1007/978-3-0348-0828-6_3. - DOI - PubMed
    1. Inoue K., Koizumi S., Fuziwara S., Denda S., Inoue K., Denda M. Functional Vanilloid Receptors in Cultured Normal Human Epidermal Keratinocytes. Biochem. Biophys. Res. Commun. 2002;291:124–129. doi: 10.1006/bbrc.2002.6393. - DOI - PubMed

Publication types

Substances

LinkOut - more resources